Abundance Profiles in Disk Galaxies from Nebulae111Invited review presented at the workshop on “Abundance Profiles: Diagnostic Tools For Galaxy History”, held October 12-15, 1997, at Université Laval, Québec City, Québec.
Abstract
Galactic and extragalactic abundance studies of H II regions, planetary nebulae, and supernova remnants are compiled and their implications briefly reviewed. Galaxy global metallicity appears to be related directly to total mass and morphology, while gradient slopes are uncorrelated with these parameters, although barred spirals tend to have flatter profiles than non-barred spirals. N/O behavior is consistent with primary, then secondary, production of N as metallicity increases, and empirical evidence for a metallicity-sensitive C yield is seen. Metallicity-invariant primary production mechanisms are suggested for S, Ne, Ar, and O.
Department of Physics & Astronomy, University of Oklahoma, Norman, OK 73019 USA
1. Introduction
Abundance measurements of C, N, O, Ne, S, and Ar in galactic and extragalactic H II regions, planetary nebulae, and supernova remnants represent a major source of information about elemental levels in the interstellar media of spiral disks. Measured from the ground in most cases, the strengths of the numerous emission features produced by these objects can be converted in a straightforward way to ionic and elemental abundances. When the abundances for nebular objects within a single galaxy are compiled, several correlations are shown to exist either between interstellar metallicity and galactocentric distance, i.e. an abundance gradient, or between pairs of abundance ratios. Since the former is directly linked to matter distribution and star formation rates, and the latter depends on the IMF and stellar yields, complete abundance profile information for a galactic disk provides important constraints on galactic chemical evolution models and hence our global understanding of how elemental composition changes within a galaxy as a function of time and location. The purpose of this review is to provide a summary of extant data pertaining to nebular abundance profiles in disk galaxies along with brief interpretations. Readers are referred to other papers in this volume for more detailed theoretical explorations of abundance gradients.
2. Metallicity Profiles of Spiral Disks
Because oxygen is readily accessible spectroscopically, its abundance provides a convenient tracer of metallicity distribution in a galactic disk. I begin by discussing the Milky Way oxygen profile and then follow up with a summary of general results for a large number of other spirals.
Data for oxygen in the Milky Way disk were taken from the following papers: Shaver et al. (1983), the first major survey of abundances in galactic H II regions; Vílchez & Esteban (1996), a focused study of H II regions at large galactocentric distances; and Maciel & Köppen (1994), where a large number of galactic type 2 planetary nebulae were used to map abundances in the disk. Abundances were generally derived in these papers by combining measured line strengths directly with atomic data and ionization correction factors as described in Osterbrock (1989).
Figure 1 shows 12+log(O/H) versus galactocentric distance in kpc for the Milky Way, where symbol shape indicates the data source.

Also included are the recent B star results from Smartt & Rolleston (1997). Numbers in square brackets in the legend give 12+log(O/H) at the sun’s distance (8.5 kpc) and the slope in dex/kpc, respectively, for least squares fits. Parameter uncertainties are given in parentheses. The sun’s position (Grevesse & Noels 1993) is indicated with an ‘x’. Error bars here and in subsequent figures show typical uncertainties.
Besides the presence of a negative metallicity gradient, Fig. 1 implies the following. (1) The galactic oxygen gradient flattens beyond 10kpc, according to the Vílchez H II region data. (2) The B star oxygen profile is consistent with H II region results inside of 10kpc and shows no flattening beyond 10kpc. (3) The oxygen abundances in planetary nebulae are systematically less than in H II regions at corresponding distances by roughly 0.14 dex, qualitatively consistent with the idea that planetary nebulae represent an older, less metal-rich population than H II regions.
Turning now to the consideration of spiral galaxies generally, large surveys of O/H in extragalactic H II regions include those of McCall (1982; 40 galaxies), Vila-Costas & Edmunds (1992; 32 galaxies), and Zaritsky, Kennicutt, & Huchra (1994; 39 galaxies). Detailed results for O/H in individual spirals can be found in these papers. To show general findings here I have extracted characteristic abundances222The characteristic abundance is the abundance at 0.4ro as determined by a least squares fit to the data, where ro is the isophotal radius at mag arcsec-2. and gradient slopes from Zaritsky et al. and present them in Figure 2
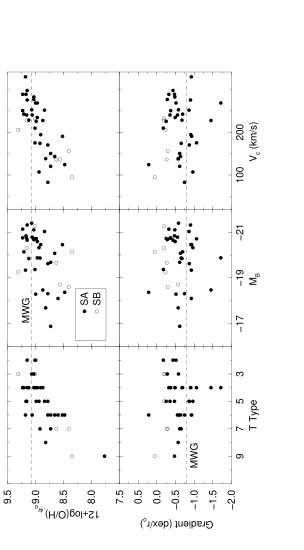
as functions of galaxy morphological type (T type), absolute blue magnitude MB, and maximum circular velocity Vc in km/s. All three of these independent parameters are indicators of galaxy mass, where smaller T type indices, more luminous integrated blue magnitudes, and larger rotational velocities generally correspond with more massive spirals. Gradient slopes are shown in dex/ro. Normal and barred spirals are shown separately using filled and open symbols, respectively. Parameters from the Shaver data for the Milky Way are indicated in Fig. 2 with dashed lines, where I have adopted 11.5kpc for the isophotal radius (de Vaucouleurs & Pence 1978). I note that while isophotal radius is employed as the normalization standard here, use of effective radius (the half light radius) or kiloparsecs produces similar results. The choice of normalization standard is discussed by Garnett in this volume.
Two points are implied by Fig. 2: (1) Characteristic abundances increase with galaxy mass, while gradient slopes are uncorrelated with this parameter; and (2) Characteristic abundances in normal and barred spirals are indistinguishable, but barred spirals appear to have flatter gradients. Both of these results have been noted previously. Garnett & Shields (1987) plotted characteristic O/H values against galaxy mass for numerous spirals and found a direct correlation between these two parameters, while Pagel et al. (1979) first suggested that barred spirals may have flatter gradients.
3. Abundance Ratios of Heavy Elements
While metallicity patterns are apparently related closely to global galaxy properties, heavy element ratios such as N/O are expected to reflect characteristics of the IMF, stellar yield patterns, and star formation history. Papers on heavy element abundance ratios for the Milky Way included in this review are: Shaver et al. (1983; N/O, S/O, Ne/O, and Ar/O), Vílchez & Esteban (1996; N/O, S/O), Simpson et al. (1995; N/O, S/O, Ne/O), Maciel & Köppen (1994; Ne/O, S/O, Ar/O), and Fesen, Blair, & Kirshner (1985; N/O, S/O). Ratios for extragalactic H II regions are taken from papers by Thurston, Edmunds, & Henry (1996; N/O), Kobulnicky & Skillman (1996; N/O), Garnett (1989; S/O), and Garnett et al. (1995, 1997; C/O). Note that Simpson et al. used lines in the IR to infer their abundances. All papers considered H II regions with the exception of those by Fesen et al. and Maciel & Köppen which studied supernova remnants and planetary nebulae, respectively.
Figure 3 shows log(N/O) versus 12+log(O/H) for both the Milky Way and extragalactic objects. Milky Way data are shown with symbols whose shapes are interpreted in the legend of Fig. 4.

Notice the segregation in the Milky Way data of the Simpson and Fesen points from the Shaver and Maciel points, perhaps due to the differences in the way these ratios were measured. T Type values are used as symbols for the Thurston et al. spirals, while ‘d’ designates the Kobulnicky & Skillman dwarf galaxies. Parameters for least squares fits are indicated in the figure for the two extragalactic data sets only, where A=y-intercept, B=slope, and C=correlation coefficient. Because of the scatter in the Milky Way data, the following analysis applies only to the extragalactic N/O studies.
The flatter N/O behavior seen at 12+log(O/H)8.0 can be ascribed to the dominance of primary nitrogen production where CNO cycling is fed with carbon and oxygen derived directly from triple alpha processing within the same star. Thus, N/O is relatively independent of the star’s metallicity. The steeper slope in N/O at higher metallcities is probably related to metallicity-sensitive secondary nitrogen production in which significant amounts of carbon and oxygen already present in the star enters into the CNO cycle. [See Vila-Costas & Edmunds (1993) and Thurston et al. (1996) for further discussion.] Finally, note the tendency for early type spirals (low integer values) to have systematically higher log(N/O) for the same 12+log(O/H).
C/H, S/H, Ne/H, and Ar/H are plotted logarithmically against 12+log(O/H) in Fig. 4, where the legend connects symbol shape with data source, and the parameters (and uncertainties) defined as in Fig. 3 for the least squares linear fits are shown in each panel. Note that open and filled symbols designate Milky Way and extragalactic H II regions, respectively.

The top left panel of Figure 4 shows C/H values from Garnett et al. (1995; 1997) for extragalactic H II regions, along with results for galactic objects M 8 (Peimbert et al. 1993) and the Orion Nebula (Walter et al. 1992). The two results for Orion stem from the assumption of line-of-sight temperature fluctuations in the case of the higher value. The two points at low O/H are for I Zw 18. For purposes of the fit, the Orion collisional line abundance and the two points for I Zw 18 were omitted. A clear correlation exists between C and O, and with a slope significantly greater than unity, a metallicity-sensitive production mechanism for carbon is suggested.
Another strong correlation, assisted considerably by the extragalactic data, exists between S/H and O/H (top right panel). It is interesting to note the greater scatter for planetary nebula data than for H II region data. In all but the Simpson et al. work, S abundances were determined by combining S+ abundances with an ionization correction factor. However, the excitation level of planetary nebulae is generally higher than in H II regions, so planetaries should have proportionately less S+, and this method will be less accurate for them. The strong correlation shown in this plot, along with a slope close to unity, implies that S/O is generally constant. The average log(S/O) value is -1.76, close to the solar value of -1.66 (Grevesse & Noels 1993). This result agrees with Garnett (1989), although Díaz (1989) found a negative correlation between log(S/O) and 12+log(O/H). In addition to ionization correction factor uncertainties, sulfur abundance studies also suffer from the effects of severe telluric absorption on the IR [S III] 9069Å and 9532Å lines.
Ne/H and Ar/H appear to be correlated with O/H (bottom two panels), although the slopes are less than unity. Nevertheless, average ratios of and , compare favorably with solar values of -0.80 and -2.27 (Grevesse & Noels 1993), respectively.
Tight correlations such as those between S, Ne, Ar, and O suggest that these elements are produced by primary nucleosynthesis in massive stars with yields that are invariant with metallicity. This issue was explored in the case of Ne and O in particular by Henry (1989), who found the interstellar Ne/O ratio to be constant in several different galaxies.
4. Assorted Issues
The effects of bars on abundance gradients has recently been studied extensively in particular by Martin, Roy, Walsh, Belley, and Julien. The bottom three panels of Fig. 2 show the tendency for barred spirals to possess shallower gradients. The paper by Martin & Roy (1994) further relates gradient slope to bar strength, a quantity which measures bar ellipticity. They find direct relations between the slope of the oxygen abundance gradient of a barred spiral and the galaxy’s bar strength (ellipticity) and length. This empirical result is consistent with radial flow models of chemical evolution in which the presence of a bar enhances large-scale mixing over the galaxy’s disk, damping radial abundance variations.
A negative vertical gradient in O/H in the Milky Way is suggested by planetary nebula studies. Abundance data compiled by Kaler (1980) for PNe ranging in height above the disk from less than 0.4 kpc to greater than 1 kpc show a decrease in O/H with increasing height above the plane. A comparison of more recent studies of PNe close to the plane (Perinotto 1991), greater than 300pc above the plane (Cuisinier et al. 1996), and in the halo (Howard & Henry 1997) shows averages of 12+log(O/H) for these three samples of 8.68, 8.52, and 8.02 respectively, qualitatively consistent with Kaler.
Thorough tests for azimuthal gradients in spiral disks have yet to be carried out. One example of apparent O/H asymmetry is discussed by Kennicutt & Garnett (1996) in their study of M101. They find that H II regions located along a spiral arm southeast of the major axis have a lower oxygen abundance by 0.2-0.4 dex compared with H II regions on the opposite side.
Global metallicities in low surface brightness galaxies are generally found to be subsolar by roughly a factor of three, according to McGaugh (1994), indicating that these galaxies evolve very slowly and form few stars during a Hubble time. Apparently, they also lack detectable gradients. This, despite the fact that these objects are similar in mass and size to prominent spirals defining the Hubble sequence. McGaugh suggests that a galaxy’s environment and surface mass density are more relevant to galaxy evolution than gross size.
Effects of cluster environment on the chemical evolution of galaxies has been investigated by Skillman et al. (1996), who studied oxygen profiles in several Virgo spirals representing a range in H I deficiency (taken as a gauge of cluster environmental interactions). Their results imply that global metal abundances in disks tend to be higher in stripped galaxies, presumably because reduced infall of metal-poor H I gas means less dilution of disk material. Henry et al. (1996 and references therein) investigated metallicity and heavy element abundance ratios (N/O, S/O) in three cluster spiral disks with normal H I and found no clear signatures of environmental effects. Thus, cluster environment alone is apparently not a sufficient condition for altered chemical evolution.
The mathematical form of abundance profiles in spiral disks, has been investigated recently by Henry & Howard (1995), who fit line strength behavior over the disks of M33, M81, and M101 using photoionization models. Their best fits for O/H versus galactocentric distance were produced using exponential profiles, although power law forms could not be ruled out. However, linear profiles poorly reproduced the observations. Henry and Howard also concluded that there is currently no strong observational case for gradient flattening in the outer parts of some disks, although such flattening has been proposed by several authors (see Mollà et al. 1996).
5. Summary
Since the conference review on this same subject by Díaz (1989) both the average number of observed and analyzed H II regions per galaxy and the number of galaxies sampled have steadily risen. Also, a larger number of elements is now being studied. The following points seem solid: (1) Global metallicity in spirals is influenced by galaxy mass. Evidence in Vila-Costas & Edmunds (1992) also suggests that interstellar metallicity scales directly with total surface density, perhaps through a star formation rate which is a function of local density, and thus an abundance gradient merely traces matter distribution. (2) N/O behavior with metallicity clearly suggests a primary then secondary origin of N with chemical evolution. (3) Finally, constant ratios of S/O, Ne/O, and Ar/O are ubiquitous and appear to suggest primary nucleosynthesis in massive stars with metallicity-insensitive yields.
While significant progress has been made over the past decade, more questions remain to be addressed. Is the abundance scatter at a specific galactocentric distance real or observational? Why do collisional and recombination lines give abundances which often differ by as much as a factor of two? Do gradients really flatten in outer regions of disks? Finally, there is the problem of measuring good abundances in low excitation H II regions, where auroral line electron temperature determinations are difficult/impossible to obtain, preventing adequate probes of early spirals as well as the inner disks of late ones. Clearly, there is still plenty of work to do.
Acknowledgments.
I am grateful to Dennis Zaritsky for sharing his abundance data, Reggie Dufour for his stimulating comments, and the University of Oklahoma for assisting with travel support.
References
Cuisinier, F., Acker, A., & Köppen, J. 1996, A&A, 307, 215
de Vaucouleurs, G., & Pense, W.D. 1978, AJ, 83, 1163
Díaz, A.I. 1989, in Evolutionary Phenomena in Galaxies, J.E. Beckman & B.E.J. Pagel, eds. (Cambridge University Press), 377
Fesen, R.A., Blair, W.P., & Kirshner, R.P. 1985, ApJ, 292, 29
Garnett, D.R., & Shields, G.A. 1987, ApJ, 317, 82
Garnett, D.R. 1989, ApJ, 345, 282
Garnett, D.R., et al. 1995, ApJ, 443, 64
Garnett, D.R., et al. 1997, ApJ, in press
Grevesse, N., & Noels, A. 1993, in Origin and Evolution of the Elements, eds. N. Prantzos, E. Vangioni-Flam, & M. Casse (Cambridge University Press), 15
Henry, R.B.C. 1989, MNRAS, 241, 453
Henry, R.B.C., & Howard, J.W. 1995, ApJ, 438, 170
Henry, R.B.C. et al. 1996, MNRAS, 283, 635
Howard, J.W., & Henry, R.B.C. 1997, MNRAS, 284, 465
Kaler, J.B. 1980, ApJ, 239, 78
Kennicutt, R.C., & Garnett, D.R. 1996, ApJ, 456, 504
Kobulnicky, H.A., & Skillman, E.D. 1996, ApJ, 471, 211
Maciel, W.J., & Köppen, J. 1994, A&A, 282, 436
Martin, P., & Roy, J-R. 1994, ApJ, 424, 599
McCall, M.L. 1982, PhD thesis, University of Texas, Austin
McGaugh, S.S. 1994, ApJ, 426, 135.
Mollà, M., Ferrini, F., & Diaz, A.I. 1996, ApJ, 466, 668
Osterbrock, D.E. 1989, Astrophysics of Gaseous Nebulae and Active Galactic Nuclei, (University Science Books)
Pagel, B.E.J., et al. 1979, MNRAS, 189, 95
Peimbert, M., Torres-Peimbert, S., & Dufour, R.J. 1993, ApJ, 418, 760
Perinotto, M. 1991, ApJS, 76, 687
Shaver, P.A., et al. 1983, MNRAS, 204, 53
Simpson, J.P., et al. 1995, ApJ, 444, 721
Skillman, E.D., et al. 1996, ApJ, 462, 147
Smartt, S.J., & Rolleston, R.J. 1997, ApJ,
Thurston, T.R., Edmunds, M.G., & Henry, R.B.C. 1996, MNRAS, 283, 990
Vila-Costas, M.B., & Edmunds, M.G. 1992, MNRAS, 259, 121
Vila-Costas, M.B., & Edmunds, M.G. 1993, MNRAS, 265, 199
Vílchez, J.M., & Esteban, C. 1996, MNRAS, 280, 720
Walter, D.K., Dufour, R.J., & Hester, J.J. 1992, ApJ, 397, 196
Zaritsky, D., Kennicutt, R.C., & Huchra, J.P. 1994, ApJ, 420, 87