DETECTION OF THE GALAXY LENSING THE DOUBLY–IMAGED QUASAR SBS 1520+530
Abstract
band observations with a spatial resolution of 015 carried out with the Canada-France-Hawaii Telescope adaptive optics system show a galaxy between the components of the double BAL QSO SBS 1520+530, thereby confirming this system as a gravitational lens. The galaxy is located 040 from the fainter of the two QSO images and is offset 012 from the line joining them. The H magnitude of the lensing galaxy is 1 mag fainter than expected from the velocity dispersion derived for the lensing galaxy were it at z = 0.72 or z = 0.81, the redshifts of the two absorption line systems.
1 INTRODUCTION
Gravitational lenses have several applications, from the determination of cosmological parameters, to the measurement of galaxy parameters, to the detailed study of the inner regions of quasars (see recent reviews by Narayan and Bartelmann (1998), Refsdal and Surdej (1994) and Schneider (1996). The compilation of Keeton and Kochanek (1996) lists roughly 20 optical quasars and AGN which appear to be multiply imaged. While most of the quadruple systems on this list are rated class “A” candidates by Keeton and Kochanek, most of the double systems are rated class “B” or class “C”. Two closely spaced quasars of similar or even identical redshift may or may not be the result of gravitational lensing; they may simply be a quasar pair located near to each other in space. Identification of the lensing object provides strong additional support that a given candidate is a true lens.
Recently, Chavushyan et al. (1997, hereafter CVSE) reported that the QSO SBS 1520+530 has two components, separated by 16, with identical redshifts, z = 1.855. The two broad emission and absorption line profiles also appear to be identical, and since BAL type absorptions are relatively rare, they argue that SBS 1520+530 is very likely to be a gravitational lens system.
In this paper, we present high spatial resolution observations demonstrating the presence of a galaxy between the two images, confirming the CVSE interpretation of the quasar pair as gravitationally lensed images of a single object.
2 OBSERVATIONS
SBS 1520+530 is located 13″ from an m12 star, which, though a nuisance for conventional imaging, makes it an ideal target for imaging with an adaptive optics system. The CFHT Adaptive Optics Bonnette (AOB) is a general adaptive optics interface which can be mounted at the cassegrain focus, to which cameras and other instruments can be mounted (Arsenault et al. 1994, Rigaut et al. 1998). It makes use of a wavefront curvature sensor and a bimorph mirror with 19 degrees of freedom. For these observations, a beamsplitter was used that diverted the visible light to the wavefront sensor while the near-IR light went to the science detector. The data were recorded with MONICA, the Université de Montreal Infrared Camera, which uses a 256 256 NICMOS HgCdTe array. Special optics were installed in the camera for use with AOB that yield a scale of 0034 per pixel, and a field size of only . Unfortunately, the coatings of these optics had deteriorated by the time these observations were made and the measured throughput of the camera was lower than when initially installed.
The filter was selected as offering the best compromise between sensitivity, good image compensation, and sky brightness. To remove detector cosmetics and to improve the signal-to-noise ratio, a series of 180s integrations were made on UT1997 June 14.4 in a four position dither pattern separated by 31 (90 pixels), with small offsets between each set of four exposures. During initial setup, an additional set of four was also taken at a smaller offset from the guide star. The region containing lens components A and B received a total exposure of 48 minutes, but the region near object “SE” (see below) only received between 12 and 24 minutes. Measurements of exposures of the guide star taken immediately after those of SBS 1520+530 indicate that the AOB was delivering near diffraction-limited images, with FWHM = 013, but measurements of component A on individual 180s data frames indicate that the seeing was variable throughout the sequence of exposures.
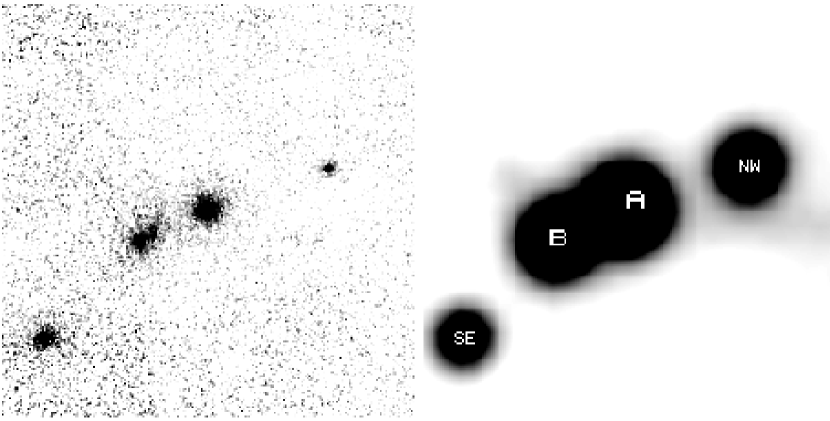
The raw data frames were median combined in subsets to form sky flats which were then subtracted from the raw data. Precise offsets were determined from the positions of point sources in the frames and these were also verified using the wavefront sensor coordinates for each observation. All of the data was then combined with appropriate (integer pixel) shifts to form the final image. This image, correctly oriented (see section 3.1), is shown in Figure 1a where the objects are labelled with the same convention as used by CVSE. The lensing galaxy is clearly visible NW of component B.
3 RESULTS
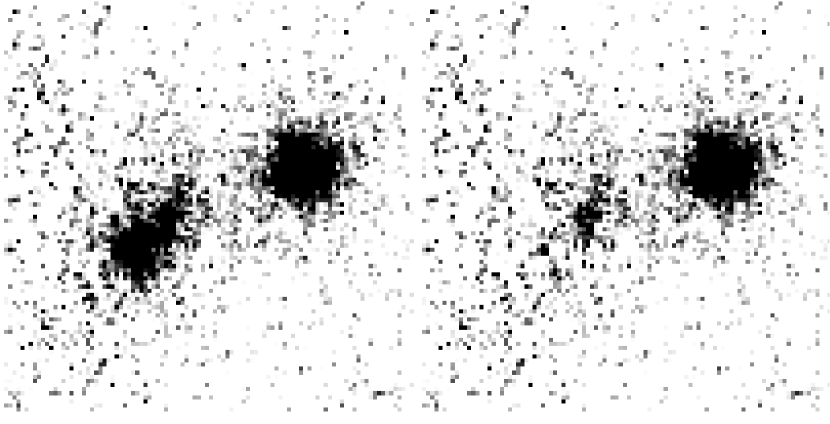
Positions and magnitudes of all the objects shown in Figure 1a were measured on the original, unrotated, image and measurements of the galaxy were made on images with the point sources subtracted. A variety of techniques within the IRAF package were used in order to estimate measuring errors. The image of component A was used to establish the point-spread-function (PSF) which was then scaled and subtracted from the other point sources with the DAOPHOT ALLSTAR routine. As mentioned above, the FWHM of point sources varied during the observations and since some parts of the image shown in Figure 1a were taken at different times, it is not unexpected that the PSFs would be variable. In addition, the image quality is expected to degrade with increasing distance from the guide star due to anisoplanatic effects in the wavefront correction. Nevertheless, the PSF constructed from object A appears to be adequate, since the residuals after subtraction (with ALLSTAR) are only slightly larger than those of the sky background in neighboring areas. Although the NW object appears to be sharper than objects A,B and SE, the FWHM of point sources on the final averaged image are all consistent with FWHM = 015. Figure 2 shows a portion of the image near the lens before and after subtraction of a scaled image of component A at the location of B.
3.1 Astrometry
Positions of all the objects relative to A are given in Table 1. The estimated errors in each coordinate are 0.05 pixels or 2mas for the point sources and 1 pixel or 30mas for the galaxy. The latter position was measured after PSF subtraction of the quasar images. Given the small field, proper orientation of the coordinate system is not trivial, especially since the MONICA camera is only on temporary loan to CFHT and hence its mounting orientation is not fixed. Comparison of positions of stars in M5 obtained during the same run with archival HST data indicates that the pixel scale is 003416000003 pixel-1 and that north is 10076 002 from the vertical columns of the detector. A left – right inversion of the rotated image is also required to correctly orient the field. We have also computed the scale directly from the images of SBS 1520+530, transferring positions from a deep filter image obtained at Michigan-Dartmouth-MIT Observatory to the MONICA image. We find the same scale and rotation, though with uncertainties larger by a factor of 3. Portions of the and images are shown on the same scale in Figure 1.
Based on our new calibration, radial coordinates relative to the line joining A – B with A as origin are given in columns 4 and 5 of Table 1, and offsets relative to A in equatorial coordinates are listed in columns 6 and 7. For objects in common, the latter are in good agreement with those listed by CVSE.
3.2 Photometry
The relative magnitudes in H of A, B, NW and SE were determined with DAOPHOT using a PSF (determined from image A) which extended to a radius of 25 pixels or 085. These are listed in the last column of Table 3. The average error reported by DAOPHOT was 0.05mag for the point sources. Since these magnitudes were measured in an internally consistent way, their accuracy relative to each other is quite good. However, observations of only one standard star were taken during the run, three nights later, due to poor weather after these lens observations were obtained. The observation of FS30 (Casali and Hawarden 1992) yields a zeropoint of = 17.40.1 mag for component A. Lensing is achromatic, so the magnitude differences between objects should be identical, within errors, (or variability on scales short compared to the time delay), to those observed in by CVSE if they are lensed components. This is true for objects B and NW, but SE is much redder.
While our data have not been photometrically calibrated, we find that the B+G component is 0.60 mag fainter than the A component and that the NW object is 1.25 mag fainter. This is roughly consistent with the CVSE photometry. Fitting separately for the brightness of the lensing galaxy by fixing its position relative to the quasar images (see Schechter and Moore 1993) we find that B is 0.66 mag fainter than A and that the galaxy is mag fainter. Based on the CVSE photometry for A, the galaxy then has = 21.6.
The relative H magnitude of the galaxy was measured by aperture photometry to the same radial distance, 25 pixels, as the point sources. Using the above calibration, the galaxy has = 19.2. CVSE noted the presence of two absorption line systems in the spectra of SBS 1520+530, at z = 0.716 and z = 0.815. Assuming that the lensing galaxy is responsible for one or other of these, we adopt z = 0.765 as a plausible lens redshift for the purpose of interpreting our observations. Adopting H0 = 50 km s-1 Mpc-1 and we find a restframe absolute magnitude M = 22.4 on the Oke system. For a typical gE galaxy, this is equivalent to MB = 20.4 or nearly a magnitude fainter than an L∗ galaxy. The observed color () is much bluer than expected for an elliptical galaxy, being appropriate for an Scd galaxy at the assumed redshift. We stress, however, that the galaxy color is quite uncertain without higher spatial resolution observations in the visible wavelength region and, furthermore, that its redshift has not yet been measured.
4 MODELS
The non-collinearity of the lensing galaxy and the two images is a clear signature of the non-axisymmetric character of the lensing potential. A minimum of 5 parameters is needed to describe such a potential: a strength, which governs the splitting, the two source coordinates, which are not observable quantities, and an amplitude and orientation for a shear which breaks the symmetry. A simple and plausible model incorporating these features is the singular isothermal quadrupole potential (e.g Kochanek 1991)
where is the projected potential (cf. Narayan and Bartelmann 1996), is the lens strength (an angle), and are polar coordinates on the sky measured from the center of the potential (where is an angle), is the dimensionless shear and gives the orientation of the shear. The linear dependence of the leading term on would give a galaxy with a constant circular velocity. The linear quadrupole term gives isopotentials which are self-similar and approximately elliptical, as might be expected from an elliptical isothermal mass distribution with an ellipticity in the limit of small shear.
The positions of the two quasar images relative to the lensing galaxy (which we take as the origin of our coordinate system) give us two constraints each, leaving us with one constraint less than needed for a 5 parameter model. The obvious choice for a fifth constraint is the observed flux ratio of the two quasar images. There are several cases for which observed magnifications fail to agree with otherwise excellent models, e.g. MG0414+0534 (Witt et al. 1995) and B1422+231 (Mao and Schneider 1997), for which microlensing and millilensing have been invoked to explain the discrepancies. But as Mao and Schneider note, magnifications are more likely to be reliable when they are relatively small, as in double systems, than when they are larger, as in quadruples.
Our model yields a strength and a shear with measured E from N. This corresponds to an E3-4 galaxy with major axis at PA . The value of is determined largely by the magnification constraint. The orientation and ellipticity of the observed galaxy is difficult to measure with precision given its relative faintness and the presence of component B. On the B-subtracted image (Fig. 2), the brighter contours appear to be oriented almost N–S, but the fainter contours give a PA = . The derived amplitude and direction of the shear are thus consistent with our observations, but a better image is required in order to determine whether it is solely responsible. In a recent survey of the parameters of gravitational lens galaxies, Keeton, Kochanek & Falco (1997) found excellent agreement between the observed and model position angles in 14 out of 17 cases. It appears likely that the galaxy lensing SBS 1520+530 is another such case.
We also investigated the possibility that the shear might arise from a tide due to a neighboring galaxy or galaxies. Adopting Kochanek’s (1991) external shear model we find the position angle unchanged, but with and . From our deep MDM data, the nearest object which might be another galaxy at the same redshift as the lens is an object 188 seconds from the lensing galaxy at P.A. 50∘ (see Fig. 1b). Since its position angle is very different from that derived it is unlikely to be a significant component of the computed shear.
The one dimensional velocity dispersion for our isothermal model is given by
where the angular diameter distances are to the source and the lens. Taking we find a velocity dispersion of 255 km s-1, appropriate to an elliptical galaxy 0.5 mag brighter than L* (Fukugita & Turner 1991). However, as noted above, the measured brightness of the lensing galaxy is 1 mag fainter than this, implying the presence of some additional convergence. One is tempted to conclude either that the lensing galaxy is underluminous by a factor of four, or that there is additional mass present (e.g., diffuse cluster matter projected onto the lensing galaxy). Keeton et al. (1997) study a large sample of lenses and also find mass-to-light ratios which are somewhat larger than expected from stellar dynamics, though with considerable scatter.
For an isothermal sphere the expected time delay in the absence of shear is given by
where is the angular diameter distance from the lens to the source and where the positions of the images A and B are in radians measured from the lensing galaxy. This gives an expected time delay of , of the order of several months. Corrections of order are needed when the shear is taken into account.
5 SUMMARY
High spatial resolution near-IR observations reveal the presence of a galaxy between the quasar pair SBS 1520+530, thereby confirming it as a gravitational lens system. The galaxy is substantially offset from the line joining the two lensed images, implying the presence of shear which our data indicate may arise from the orientation of the lensing galaxy. The galaxy appears to be fainter than predicted by a straightforward lens model.
The presence of the bright star close to SBS 1520+530 means that it is an excellent candidate for future monitoring with adaptive optic systems. High spatial resolution images and spectra of the lensing galaxy are required to provide additional constraints on the lens model.
References
- (1)
- (2) Arsenault, R., Salmon, D.A., Kerr, J., Rigaut, F., Crampton, D., & Grundmann, W. 1994, SPIE, 2201, 883
- (3)
- (4) Casali, M. & Hawarden, T. 1992, JCMT-UKIRT Newsletter, 4, 33
- (5)
- (6) Chavushyan, V.H., Vlasyuk, V.V., Stepanian, J.A., & Erastova, L.K. 1997, A&A, 318, L67 (CVSE)
- (7)
- (8) Fioc, M. & Rocca-Volmerange, B. 1997, A&A, 326, 950
- (9)
- (10) Fukugita, M. & Turner, E.L. 1991, MNRAS, 253, 99
- (11)
- (12) Keeton, C.R. & Kochanek, C.S. 1996, in C.S. Kochanek and J.N. Hewitt, eds. IAU Symposium No. 173: Astrophysical Applications of Gravitational Lensing, 419
- (13)
- (14) Keeton, C.R., Kochanek, C.S. & Falco, E.E. 1997, ApJ submitted, astro-ph/9708161
- (15)
- (16) Kochanek, C.S. 1991, Ap.J. 373, 354.
- (17)
- (18) Mao, S. & Schneider, P. 1997, astro-ph/9707187
- (19)
- (20) Narayan, R. & Bartelmann, M. 1998, in A. Dekel and J.P. Ostriker, eds. Formation of structure in the universe. Proc. 1995 Jerusalem Winter School. astro-ph/9606001
- (21)
- (22) Refsdal, S. & Surdej, J. 1994, Rep. Prog. Phys, 57, 117
- (23)
- (24) Rigaut, F. et al. 1998, PASP, in press, astro-ph/9712196
- (25)
- (26) Schechter, P.L. et al. 1997, ApJ, 475, L85
- (27)
- (28) Schechter, P.L. & Moore, C. 1993, AJ, 105, 1
- (29)
- (30) Schneider, P. 1996, in E. Martinez-Gonzalez and J.L. Sans, eds. The universe at high z, large scale structure and the cosmic microwave background: Proceedings of an Advanced Summer School, held at Laredo, Cantabria, Spain, 148.
- (31)
- (32) Veran, J.-P., Rigaut, F., Maitre, H., & Rouan, D. 1997, JOSA, series A, 14, 11
- (33)
- (34) Witt, H.J., Mao, S. & Schechter, P.L. 1995, ApJ, 443, 18
- (35)
| Object | x | y | r | theta1 | RA | DEC | |
|---|---|---|---|---|---|---|---|
| pix | pix | mag | |||||
| B | +10.95 | +44.61 | 1.569 | 0 | 1.427 | 0.652 | 0.69 |
| GAL | +4.85 | +34.62 | 1.194 | 5.82 | 1.131 | 0.384 | 1.75 |
| NW | 11.24 | 77.23 | 2.666 | 5.51 | 2.520 | 0.870 | 1.31 |
| SE | +58.79 | +112.52 | 4.337 | 13.80 | 3.401 | 2.691 | 0.38 |