The Relationship Between Gas, Stars, and Star Formation in Irregular Galaxies: A Test of Simple Models
Abstract
Irregular galaxies are a unique test of models for the physical laws regulating star formation because of their lack of spiral density waves and rotational shear. Here we explore various instability models for the onset of star formation in irregular galaxies. If the gas is unstable, clouds and eventually stars can form, and so these models should predict where star formation occurs. Critical gas densities were calculated for gravitational instabilities in two models, one with a thin, pure-gas disk (), and another with a thick disk composed of gas and a star-like fluid (). We also calculated the stability properties of three dimensional systems including dark matter, considered the thermal state of the gas, and used a modified threshold column density written in terms of the local rate of shear instead of the epicyclic frequency. The model predictions were compared to the azimuthally-averaged present day star formation activity traced by the H surface brightness, and to the 1 Gyr-integrated star formation activity represented by the stellar surface brightness.
We find that the ratio of the observed gas density to the critical gas density, , is lower by a factor of in most of the Im galaxies than it is in spiral galaxies, at both the intermediate radii where is highest, and at the outer radii where star formation ends. We also find that, although star formation in irregulars usually occurs at intermediate radii where is highest, this activity often ends before drops significantly in the outer regions, and it remains high in the inner regions where is often low. There are also no correlations between the peak, average, or edge values of and the integrated star formation rates in irregulars. These results suggest that does not trace star formation with the same detail in irregular galaxies as it appears to trace it in giant spiral galaxies. The low value of also implies that either the gas in irregulars is more stable than it is in spirals, or is not a good threshold for star-forming instabilities.
Dark matter in the disks of irregulars makes the gas more unstable, but stars do the same for the disks of spirals, leaving the ratio of the two -values about the same. Moreover, the instability parameter with dark matter still does not follow the star formation activity in irregulars. The thermal model suggests that irregulars have difficulty in sustaining a cool, dense gas phase, and it too fails to predict where star formation occurs. An alternative model in which cloud formation involves a competition between self-gravity and shear, rather than an instability in the usual sense, is more successful in defining the threshold for star formation, but it does not predict where star formation ends either. The failure of these models suggests that processes other than spontaneous instabilities are important for star formation in irregular galaxies.
The role of in spiral galaxies is also questioned. The observed sensitivity of the star formation rate to may be strongly dependent on instabilities specific to spiral arms and not general instabilities of the type for which was originally derived. In that case, large-scale star formation may end in the outer disks of spirals because the stellar density waves end there, at the outer Lindblad resonance.
The only azimuthally-averaged quantity that correlates with the current star formation activity in irregulars is the stellar surface density. A causal connection is possible if stellar energy input to the interstellar medium acts as a feedback process to star formation. If this process played a key role in initiating star formation in irregulars from the beginning, then it could explain why irregular galaxies began their evolution slowly compared to larger disk systems with spiral arms.
received 25 June 1997; accepted 28 August 1997; To appear in ApJ, 493, Feb 1, 1998
1 Introduction
Why do disk galaxies often have gas extending far beyond the optical Holmberg radius? Stars form from gas, but few stars form in the outer gas disks surrounding galaxies. Intuitively this makes sense: as the density of gas drops with increasing distance from a galaxy’s center, there should come a point where clouds do not form to make stars. One way to account for this is with a threshold density that is either constant (Madore, van den Bergh, & Rogstad 1974; Mouschovias 1981; Seiden 1983; Gallagher & Hunter 1984; Hunter & Gallagher 1986; Guiderdoni 1987; Skillman 1987; Buat, Deharveng, & Donas 1989) or dependent on local conditions (Quirk 1972; Kennicutt 1989; Elmegreen & Parravano 1994). A threshold density that depends on local conditions is in keeping with observations that show historically constant star formation activity as a function of radius in irregulars (Hunter & Gallagher 1985; Hunter, Gallagher, & Rautenkranz 1982) and spirals (Hodge & Kennicutt 1983). However, the physical origin of such a threshold is not well understood.
In a thin, differentially-rotating disk composed of pure gas (Safronov 1960) or pure stars (Toomre 1964), there is a critical column density above which the disk is unstable to ring-like perturbations in the radial direction. Such ring instabilities are not actually observed in galaxies, even for column densities (galaxies form rings by other processes; see Byrd et al. 1994), but there is an empirical dependence for star formation that involves this threshold anyway. Kennicutt (1989) calculated the critical gas density in the thin rotating disk model (Quirk 1972) for a sample of normal Sc spiral galaxies. He found that the ratio of observed gas density to critical gas density typically exceeds 1 at mid-radius in the optical disk, and then falls with increasing distance from the center of the galaxy; star formation was not detected beyond the point where dropped below 0.70.2. He concluded that in Sc galaxies the place where 0.7 is too stable to form stars; interior to this, the gas density exceeds the local threshold for star formation. The first indication of this effect was in Zasov & Simakov (1988); the general concept that galaxy edges result from below-threshold dates back to Fall & Efstathiou (1980).
The utility of as a criterion for star formation is remarkable considering all of the important physical processes that affect the value of . One complication is that realistically thick disks are predicted to have higher column density thresholds by a factor of compared to thin disks because the component of the self- gravitational force parallel to the plane is diluted for the off-plane mass (Romeo 1992). Another problem is that the threshold for radial instabilities in the gas should be higher still when an azimuthal magnetic field is included, by a factor of for Alfven speed and turbulent gas speed (Elmegreen 1992).
Other considerations lower the threshold. Energy dissipation that gives an effective ratio of specific heats for equation of state (= pressure, = density) leads to an effective turbulent speed . Because for epicyclic frequency , this decreases by when there is no magnetic field and increases it by only when there is a magnetic field (Elmegreen 1992). Viscosity removes the column density threshold for radial collapse entirely: viscous gas is always unstable, but the growth approaches the long viscous time when the column density is below the usual threshold (Elmegreen 1995a; Gammie 1996). The presence of stars also lowers the threshold in a combined star+gas instability (Jog & Solomon 1984).
A more important consideration is that cloud formation is three-dimensional, so star formation should require both radial and azimuthal instabilities, or the formation of spiral arms with parallel instabilities in them (“beads on a string”). Stability against the initial growth of spiral or azimuthal perturbations (the “swing amplifier”) requires a value of the column density that is lower by a factor of 2 or more compared to (Toomre 1981; Athanassoula 1984). There is no sharp threshold for azimuthal growth either, and it is always transient for a polytropic, non-magnetic disk because perturbations eventually shear away. An azimuthal magnetic field can change this latter situation because the growing condensations lose angular momentum as the field lines twist up in response to the Coriolis force, and this angular momentum loss causes them to continue to grow, especially if the gas radiates and loses energy (Elmegreen 1987, 1991). Still, there is no sharp density threshold for this process, unlike radial instabilities in a thin disk, because purely azimuthal instabilities generally have no sharp threshold, and because the gravitational instability is always accompanied by the Parker (1966) instability, in which the field lines buckle perpendicular to the plane at a rate that is independent of density (Elmegreen 1982, 1991).
Two recent studies point to a possible origin of the observed density threshold for star formation when there are spiral arms. One considers the azimuthal or swing-amplifier instability discussed above, including magnetic forces, the Parker instability, and a time-dependent equation for heating and cooling (Elmegreen 1991). The result shows that, whereas the primary instability leading to transient spiral arms has no sharp density threshold, a secondary instability inside these arms, leading to discrete, three-dimensional clouds, does have a sharp threshold. The reason for this is that the secondary instability contains a strong component in the radial direction, and so is a remnant of the pure-ring instability discussed above. It follows that regions with subcritical column densities can have transient gas spiral arms but no significant collapse to stars. This may explain how outer galaxy disks can have normal-looking HI spiral arms but no significant star formation (e.g., Boulanger & Viallefond 1992).
A second study considers the analogous collapse of magnetic gas that has been compressed by a steady spiral density wave (Elmegreen 1994a). The collapse occurs along the arm, in the direction parallel to the spiral arm. This leads to the commonly observed “beads on a string” phenomenon of star formation in grand-design spiral arms. Again there is a column density threshold similar to that for the pure-ring collapse, but now the result follows more from timing than from an absolute stability condition. This is because the parallel perturbations always begin to grow regardless of column density (a long thin filament like a dustlane is always gravitationally unstable to perturbations along its length), but the growth is significant, leading to giant self-gravitating clouds and star formation, only if it is fast enough to occur while the material is compressed. That is, if the flow-through time in the arm is short compared to the collapse time, the gas will not collapse. The condition for sufficiently rapid unstable growth is that the average column density in the arms and interarms has to exceed a threshold that is about the same as that for the radial instability without a magnetic field, which is just the empirical value observed for star formation.
Other star formation processes not involving spiral arms have been proposed to give a threshold too. For example, sequentially triggered (star-induced) star formation works primarily where 1, because then the swept-up shell or ring has time to collapse and form stars before it shears away (Elmegreen 1994b). The same is true for turbulence-initiated star formation, which works best when the turbulent medium is close to the threshold for gravitational collapse (Elmegreen 1993a). In addition, cloud formation by the gradual condensation of gas along magnetic field lines in the presence of shear gives a threshold similar to in regions with flat rotation curves, but different by a factor of in regions with low shear (Elmegreen 1993b). Irregular galaxies may be dominated by such spiral-free mechanisms (Hunter & Plummer 1996). Some contain giant HI holes or shells with peripheral star formation (for the LMC, see Dopita, Mathewson, & Ford 1985; for HoII, see Puche et al. 1992), there is usually more turbulence relative to rotation in these galaxies (Tully et al. 1978; Carignan et al. 1990; Young & Lo 1996), and the rate of shear is generally low.
These considerations support what seems to have become a standard model dating back to Goldreich & Lynden-Bell (1965), that a wide variety of processes all dependent on conspire to initiate most star formation in galaxies. These processes may not actually determine the star formation rate, because that also depends on cloud destruction and turbulence stirring, but they ensure that there is some kind of feedback in which the star formation rate controls itself, possibly by regulating the velocity dispersion that contributes to . Then in a region where any particular cloud formation mechanism is absent, as in an irregular or flocculent galaxy that has no prominent spiral waves, other mechanisms become relatively more important and take over, preserving the same overall star formation rate. This model has been applied to giant spiral galaxies (Kennicutt 1989; Caldwell et al. 1992), elliptical galaxies (Vader & Vigroux 1991), low surface brightness galaxies (van der Hulst et al. 1993), and regions of intense star formation (Shlosman & Begelman 1989; Elmegreen 1994c).
Here we investigate and other thresholds for star formation in a sample of irregular galaxies, looking for trends that can serve as clues to the star formation processes in these systems. We have examined galaxies for which HI data exist in the literature with adequate spatial resolution such that the optical galaxy is significantly larger than the HI beamwidth. The observed gas density relative to the critical gas density is compared to the current (10 Myr) star formation activity determined from H images and to the stellar surface density, representing star formation integrated over 1 Gyr (Gallagher, Hunter, & Tutukov 1984). Broad-band B or V surface photometry is used to determine the stellar surface density.
This investigation began in a previous paper, where Hunter & Plummer (1996) examined the radially averaged gas densities in one irregular galaxy, Sextans A. They found that the ratio of the observed gas density to the critical gas density predicted by the thin rotating gas disk model is everywhere lower than it is in the Sc galaxies examined by Kennicutt (1989), by roughly a factor of two111Figure 4 of Hunter & Plummer (1996) shows to a radius R of 1.4 kpc for the east side of the galaxy and 1.7 kpc for the west side. However, becomes imaginary beyond R1.2 kpc because the rotation curve turns over and drops steeply there. Thus, should not have been plotted for R1.2 kpc. Here we interpolate over the region of the steep drop in the rotation curve of Sextans A to make real.. This seems to suggest that the gas in Sextans A is more stable than it is in spiral galaxies, making it harder for Sextans A to form clouds and stars. It should be more stable still because Sextans A probably has a thick disk, as do other irregular galaxies (Hodge & Hitchcock 1966; van den Bergh 1988; Puche et al. 1992), and this increases , as discussed above. Yet stars are forming at a normal rate in Sextan A, as if is not applicable. Other subcritical regions with normal star formation include the inner disks of the spiral galaxies M33 (Kennicutt 1989; Wilson, Scoville, & Rice 1991) and NGC 2403 (Thornley & Wilson 1995).
Even though the absolute value of is low in Sextans A, the radial trends in this quantity still follow the star formation activity. For example, the present-day star formation traced by H emission is generally higher at radii where is higher (Hunter & Plummer 1996). Van Zee et al. (1996, 1997) also found this trend for a sample of irregular galaxies. Taylor et al. (1994) showed, in addition, that HII regions in HII galaxies fall within the critical HI column density contour predicted by the theory. Also, van der Hulst et al. (1993) found that is highest where H is strongest in low surface brightness spirals, even though in the centers of these galaxies values of are lower than for bright Sc galaxies. We consider similar trends in the irregular galaxy sample studied here.
2 Galaxy Samples
The galaxies are listed in Table 1 along with a few basic parameters. The references for the HI data are given in Table 2. We have two galaxy samples. The first consists of relatively nearby, normal Im-type galaxies. DDO 154 is notable for its extended HI relative to the optical galaxy; the HI reaches to five times the Holmberg radius at a column density of cm-2 (Carignan & Beaulieu 1989). DDO 155 (GR8) is a tiny galaxy with an integrated B luminosity that is not much greater than that of a large star cluster. Carignan, Beaulieu, & Freeman (1990) found that half of the gas in DDO 155 is located in clouds just outside the optical image and that the rotation axis is parallel to the optical major axis. DDO 50 (Holmberg II) is an irregular galaxy in the M81 group; Puche et al. (1992) found that the HI distribution is full of holes, some as large as 1.5 kpc in diameter, that have been carved in the disk presumably by concentrations of massive stars. IC1613 is a Local Group irregular containing numerous OB associations (Hodge 1978). To these galaxies we add Sextans A from a previous study (Hunter & Plummer 1996).
The second galaxy sample consists of more distant galaxies classified as Im and Sm in the surveys for very low surface brightness objects conducted by Schombert et al. (1988, 1992). This sample is an extension of the nearby Im class that was considered previously to larger galaxies that also have no prominant spiral arms. The resolution of the HI relative to the optical size is generally lower than for the nearby Im galaxies. Most of the distant galaxies have central surface brightnesses that are comparable to or a little fainter than those of the nearby Im sample, while the disk scale lengths are always larger for the distant galaxies (de Blok et al. 1995; McGaugh, Schombert, & Bothun 1995; Carignan & Beaulieu 1989; Carignan, Beauleiu, & Freeman 1990; Broeils 1992). The luminosities of the distant galaxies range from 1.2 magnitude fainter to 1.3 magnitudes brighter than that of the LMC. Mass models for four of the distant galaxies and two of the nearby Im galaxies indicate that many of the distant galaxies have masses that are greater than those of typical irregular galaxies (de Blok & McGaugh 1997). For example, the stellar and dark matter masses and central mass density of F565-V2, and the stellar mass and central density of F583-1, are comparable to those of irregular galaxies, but in the cases of F563-1 and F563-V2, they are significantly higher. Thus, at least one of the distant galaxies has properties that are similar to those of irregulars, but others are more massive and larger. Nevertheless, all of the distant galaxies have weak or no spiral arms, and they provide a good comparison to the normal spirals examined by Kennicutt (1989).
There is some confusion in the literature about what constitutes a “dwarf” galaxy (see, for example, the review by Binggeli 1994). The term was used long before any quantitative definition was applied (Reeves 1997). Dwarfs have been defined in terms of surface brightness (Hunter & Gallagher 1986), intrinsic diameter (Pildis, Schombert, & Eder 1997), and absolute brightness, with MB or MV thresholds ranging from 15 to 17 mag (Hodge 1971, Tammann 1980, Schombert et al.1995). Clearly, not all irregular galaxies are dwarfs (Reeves 1952), and not all dwarfs are irregulars (e.g., Schombert et al. 1995). For example, according to the MB cuffoffs, the Large Magellanic Cloud, which typifies the Im class, is not a dwarf galaxy. In this paper we are examining “irregular” galaxies, not specifically “dwarf” galaxies. It happens that most, but not all, of the galaxies in our nearby Im sample would be considered dwarfs, while most, but not all, of the galaxies in the distant sample would not (although two of those that would not make the MB cutoff appear in the Pildis et al. [1997] catalog of gas-rich dwarfs based on a size criterion—F563-V1 and F563-V2). The point is that we are examining the star formation process in irregular galaxies, which generally do not have strong spiral density waves.
3 The Data
3.1 H Images
H images of DDO 168 and IC1613 have already been presented by Hunter, Hawley, & Gallagher (1993). Others were imaged with a TI CCD on the Perkins 1.8 m telescope at Lowell Observatory using redshifted H filters with FWHMs of 30 Å. A 95 Å-wide filter centered at 6440 Å was used to determine the stellar continuum which was subtracted from the H image to leave only nebular emission. The nebular flux calibration used HII regions whose H fluxes through a particular aperture size were known from spectrophotometry and spectrophotometric standard stars.
Broad-band V or the red continuum images were used to determine by eye the isophotal center of the galaxy. For IC1613 we did not image the entire galaxy. However, comparisons with the HII region surveys of Hodge, Lee, & Gurwell (1990) and Price, Mason, & Gullixson (1990) suggest that we did not miss very much H flux. We have used the lists of HII regions in these references to add to the photometry those HII regions that were not included in our image. To determine the center of the galaxy on our H image, we compared the H to a continuum image shown by Sandage (1971), a contour plot shown by Hodge et al. (1990), and the kinematic center determined by Lake & Skillman (1989).
Elliptical photometry was performed on the H images using position angles and ellipticities given by the HI references. The values are given in Table 2. From this we calculated the average H surface brightness in each elliptical annulus. The LHα are corrected for extinction using the Milky Way foreground value given in Table 1 plus internal extinction. When a measure of the internal extinction was not available, we assumed an E(BV) of 0.05. We used the Schild (1977) reddening function.
The total galactic star formation rate was determined from the integrated LHα and the formula given by Hunter & Gallagher (1986). This assumes a Salpeter (1955) initial stellar mass function from 0.1 to 100 M. Contributions to the star formation rate from stars below M⊙, where the IMF seems to level off (Kroupa 1995), are overestimated with the Salpeter initial mass function, but the absolute values of the star formation rates are not important; we discuss only radial trends and comparisons to other galaxies where the same IMF was used. To remove galaxy size variations, the star formation rate is normalized to the area of the galaxy within the surface brightness contour 25 B-magnitudes arcsec-2. The results are given in Table 3. We also list the radius , which is the largest radius at which H emission is detected.
3.2 Broad-band Images
We used broad-band surface photometry that was available in the literature for several galaxies. The references are in Table 2. For DDO 50 and DDO 105, we obtained V-band images with the Perkins 1.8 m telescope and a TI CCD on loan from the US Naval Observatory. For color information, UB or BV, we used azimuthally-averaged data for Sextans A, DDO 154, and DDO 155 using the references given in the table. For the rest we used integrated color measurements from de Vaucouleurs et al. (1991, RC3) which were assumed to apply to the galaxy at all radii. Because color gradients in irregular galaxies are small, this assumption is a reasonable approximation.
3.3 Gas Densities
Observed HI densities, deprojected to the plane of the galaxy, were taken from the references given in Table 2. We corrected for the presence of He which we took to be 1.34 times the HI content. Including molecular gas is far more difficult; few irregular galaxies have been adequately mapped, so the spatial distribution of H2 is not generally known. Instead, we took a globally averaged M/MHI ratio and simply multiplied the HI everywhere by this in order to statistically include H2. For the M/MHI ratio we used an average from the SMC, where molecular gas is 0.07% of the HI gas content (Rubio et al. 1991), and the LMC, where the ratio is 30% (Cohen et al. 1988). This correction for the presence of H2 is clearly unsatisfactory, but at present there is no better information on these galaxies. Thus, we took to be 1.52.
4 Comparison with the Rotating Disk Model
4.1 Single-fluid Thin Disk Model
First we consider the model of a single-fluid, thin disk. To calculate the critical gas density of this model we used the formalism of Kennicutt (1989) in which , where is the epicyclic frequency and is the velocity dispersion of the gas. The free parameter is assumed to have a value of one initially, but Kennicutt determined it from the ratio at the radius of the last detectable HII region. He measured a value of 0.70.2 for Sc spiral galaxies. We will also assume to be one initially here and determine at the radius where H emission is no longer detected for our sample of galaxies for comparison to Kennicutt’s result. The values of , listed in Table 2, were taken from the HI references for IC1613, DDO 155, DDO 50, and Sextans A; it was assumed to be 9 km s-1 for the other galaxies. For DDO 155, could only be computed for the inner part of the galaxy because the outer part (R500 pc) is supported by random motions rather than rotational (Carignan et al. 1990).
Values of and maximum are given in Table 3 for each galaxy. We have also computed an area-weighted average for each galaxy within the radius . These are listed in Table 3.
4.1.1 Nearby Im Galaxy Sample
The ratios of the observed gas densities, , to the critical gas densities, , for the single-fluid model are plotted versus radius as solid lines in Figure 1 for the nearby Im galaxy sample. Also plotted for comparison are the H surface brightnesses which are proportional to the star formation rates (Hunter & Gallagher 1986). The horizontal dotted line in each panel is the median value of determined for our sample of Im galaxies. This figure can be compared directly to Kennicutt’s Figure 11 for Sc spirals.
One can see that with the exception of DDO 50, the ratio is low throughout these galaxies compared to normal Sc spirals. Like Sextans A, is generally less than 0.7 in most irregulars. By contrast, is often greater than 1 in the interior regions of Sc spirals, even reaching in some cases; it drops to 0.7 and lower only beyond the radius where star formation is detected.
In 6 of the 7 nearby irregulars, is low in the centers of the galaxies, higher throughout most of the optical disks, and then lower again in the outer regions. The exception is DDO 168. The degree to which the center is depressed, and the amount and distance over which the rise and fall occur, vary from galaxy to galaxy. In DDO 154, for example, the central depression is very small and it is followed by a general and gradual fall off. Carignan & Beaulieu (1989) interpreted the HI distribution in this galaxy as consistent with a low level star formation rate, although the rate relative to the galaxy’s optical size is in fact at the high end of the range for normal irregulars (Hunter 1997). Part of the apparent smoothness of in DDO 154 could be from resolution affects since there are only 4 HI beamwidths within .
At the other extreme, in DDO 50 rises by a factor of 2.4 at a radius of 2 kpc and then drops off rapidly after that. Central depressions in the radial distribution of were also seen in a high percentage of the irregular galaxy sample examined by van Zee et al. (1997). Roughly half of Kennicutt’s Sc spiral galaxies follow this general pattern; the other half have high in their centers and the ratio declines with radius. Curiously, the surface brightness in H is highest in the centers of the irregulars where there is a dip in the ratio. In Sextans A the H emission in the center of the galaxy is indeed primarily diffuse emission, but in other systems true HII regions are found in the center. However, in some cases perhaps the high levels of ionization in the centers of these galaxies deplete the atomic gas there, in which case the central dip in is not related to the state of the gas before the star formation began.
The median value of , which is at , is 0.34 for the nearby irregular galaxies. This is significantly lower than 0.70.2 found by Kennicutt for Sc spiral galaxies. If we adopt as representing the demarcation between stable and unstable gas in irregulars, then six of the seven nearby galaxies have star formation taking place where is close to or greater than . The exception is DDO 155 where is much lower than this until the outer part of the galaxy, beyond the point where star formation is currently taking place. This general correlation between star formation and higher in most of the galaxies would seem to say that the thin rotating disk model is successfully predicting a condition for star formation. However, if we look further we see that this is not the case. In five of the galaxies, including Sextans A, the distribution implies that star formation should be taking place further out in radius than it actually is; that is, exceeds 0.3 even where there is no star formation. Also, star formation is occurring at gas densities only marginally higher, and sometimes lower, than beyond the optical edge. Thus, there is no one-to-one correspondence between the presence of star formation and distinctly higher .
The one exception to the generally low value of is DDO 50. In the central 2 kpc of this galaxy, is comparable to the peak values in the other irregular galaxies, but beyond 2 kpc, jumps to a maximum of 1.5, which is 3 times higher than the average peaks in the other galaxies. Only out at 7 kpc, or 2.2 R25, does decline to the lower value that it had in the center. The star formation activity itself, as traced by H emission, drops rapidly where the high value of begins its gradual decline, but ends well before has dropped to a value 0.3. Nevertheless, the current star formation rate in DDO 50 is not extraordinary, nor is the surface brightness, which would indicate a low past star formation rate over a long period of time. In terms of global parameters DDO 50 is a normal irregular. There is one feature of DDO 50, however, that is more extreme than in other irregulars. The HI study of DDO 50 by Puche et al. (1992) revealed numerous large holes in the neutral gas which were interpreted as resulting from recent energy input by concentrations of massive stars. These holes have diameters up to 1.5 kpc. This should not affect the overall trend of , however, and the difference in relative gas density does not appear to have translated into obvious global differences.
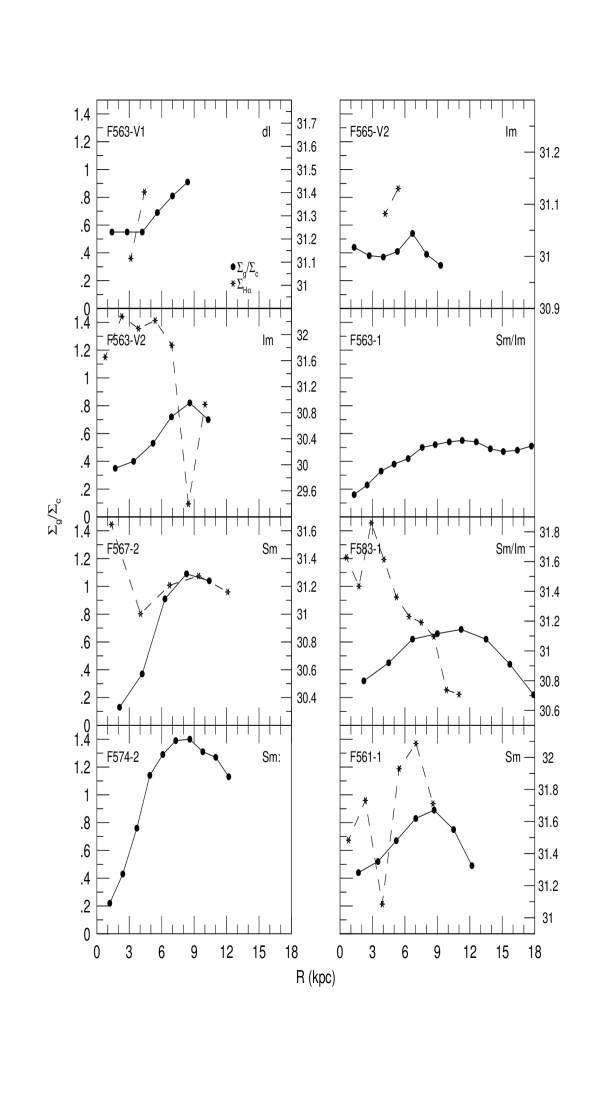
4.1.2 Distant Galaxy Sample
The relative gas densities and H radial surface brightnesses of the distant galaxy sample are shown in Figure 2. We do not know the detailed molecular content of these galaxies, but a spectroscopic study of a sample of low surface brightness galaxies has shown the oxygen abundances in those systems to be as low as what is usually seen in irregulars (Rönnback & Bergvall 1995, McGaugh 1994). In addition, as is often the case for irregulars, CO J1-0 observations failed to detect emission from a sample of low surface brightness galaxies (Schombert et al. 1990). Therefore, we have made the same assumption for converting to as for the nearby Im sample.
We see some similarities and some differences when the distant galaxy sample is compared with the nearby Im sample. First, like the nearby Im sample, the gas densities in these distant galaxies are generally low relative to the critical gas densities in the central parts of the galaxies. Furthermore, rises as one goes out from the center in all but one system. However, the central dip in is generally more extreme than it is in the nearby Im galaxy sample. This is also the radial trend seen for low surface brightness galaxies with “incipient spiral structure” examined by van der Hulst et al. (1993). In addition, the H surface brightness is high in the center of three of the galaxies, where the ratio is low, and it drops with radius. As for the nearby sample, star formation is not found in all regions of high , nor only where is highest.
However, the most striking difference is that, unlike most of the nearby Im sample, in 5 of the 8 distant systems reaches values 0.8, and two reach values 1.1. Peak values of 0.8–1.8 were found by van der Hulst et al. (1993) for low surface brightness spirals (divide in their Figure 5 by their and multiply by 1.52 to convert HI to total gas using the same assumptions that we used here). Although often begins to drop again further out, it does not drop as rapidly with radius as the star formation activity. As a consequence, is higher in these systems: the median is 0.7, which is the same as that found for Sc spirals. Although Kennicutt’s Figure 11 is hard to disentangle, it appears that roughly half of his Sc galaxies have low in the center, rising to values of order 1–1.7 and then falling off with radius beyond that. Thus, these galaxies in our sample, along with low surface brightness spirals, are behaving more like normal Sc galaxies than like normal Im galaxies.
The natural assumption would be that the distant galaxies are behaving more like spiral galaxies because they are bigger, both in size and mass. However, there are three galaxies in the distant galaxy sample that have that are similar to the low values seen in the nearby Im galaxy sample. Interestingly, one of these three galaxies (F565-V2) is also the galaxy with mass model analysis that shows that it has stellar and dark matter masses that are in the range of those determined for Im galaxies (de Blok & McGaugh 1997). However, to confound our search for correlations, one of the other galaxies with low (F563-1) is also the galaxy of the four with mass models with the highest stellar and dark matter masses, masses that are significantly higher than those of normal irregulars. The third galaxy with low (F583-1) has a stellar mass like that of Im systems but a higher dark matter mass. If one looks at the rotation speed instead of galactic mass, there is still no correlation to explain why these galaxies would have lower .
Thus, the distant galaxy sample has several members that have gas densities relative to the critical gas densities that are like those found in many irregular galaxies; is low in the center and never rises above the value of found by Kennicutt (1989) for spirals. The other members of this sample, like a sample of low surface brightness spirals, attain higher values of and are similar to some of the high surface brightness Sc spirals observed by Kennicutt (1989). What distinguishes the galaxies in this sample that behave like the irregulars from those that behave like spirals is not clear. The defining factor does not seem to be total mass, disk scale length, rotation speed, or central density.
4.1.3 Global Trends
In Figure 3 we examine as a function of the current level of star formation activity integrated over the galactic disk. We might expect that galaxies with higher average would also have higher average star formation rates. However, this does not seem to be the case. is depressed relative to that of Sc spirals, but within the sample itself we see no correlation with the level of current star formation activity. Van Zee et al. (1997) reached a similar conclusion for their sample.
Star formation comes and goes within specific regions of a galaxy, and sometimes the current star formation activity may not represent what has happened over a more extended period of time. Therefore, in Figure 4 we plot the parameter against the optical broad- band surface brightness, which should depend on the star formation activity integrated over timescales of 1 Gyr. Again, we do not see any correlation. In Figure 4 we also plot the average against the absolute magnitude of the galaxy. Although the most luminous few galaxies have the highest average , the rest of the sample has approximately the same while covering 7 magnitudes in MB. Thus, MB is not a significant predictor of , a conclusion that is opposite to that of van Zee et al. (1997) for their sample of irregulars.
4.2 Thick, Two-fluid Rotating Disk
One limitation to the thin, single-fluid disk model is that it does not include stars, an obvious component of real galaxies. A second limitation is that the model is indeed for a thin disk. Irregular galaxies are known to be thicker than spiral galaxies. Hodge & Hitchcock (1966) measured axial ratios of a large sample of irregular galaxies and concluded that the ratio of minor to major axes was 0.2–0.4 rather than the 0.2 value usually taken to represent spirals. Van den Bergh (1988) suggested that irregulars are triaxial with ratios of 1:0.9:0.4. Puche et al. (1992) also concluded from an HI study that the scale height of the neutral gas in DDO 50 is several times greater than that in spirals. Thus, irregular galaxies do deviate from the assumption of a thin disk.
We consider now two-fluid instabilities in a thick disk, and this is applied to the nearby Im galaxy sample, for which a thick disk should be more appropriate. The short-dashed lines on the left in Figure 5 give for this model, taken equal to the inverse of in Elmegreen (1995b). The solid line is from before. We assume gaseous and stellar scale heights of 200 pc and 400 pc, and use the stellar surface density from the B-band brightness along with from model galaxies with monotonic star formation rates (Larson & Tinsley 1978). The results are very similar to the conventional because the stellar surface densities are very low in these galaxies; indeed, they are nearly pure gas systems in terms of mass (compare and in Figure 6 and see the mass models for DDO 154 in Carignan & Beaulieu 1989). In this case, the small addition to self-gravity from the stars almost exactly compensates for the small loss of self-gravity from the large thickness. This is very different from the situation for giant spiral galaxies, whose disks are relatively thin and dominated by stars. In giant spirals, is typically larger than by a factor of , making the difference between spirals and irregulars even larger.
4.3 Summary of the Rotating Disk Models
We find that the gas densities in irregular galaxies are low relative to the critical density necessary for the gas to become unstable within the context of the rotating disk models. This is true whether one considers only gas or gas plus stars. Even the maximum in most irregulars is lower than the ratio at the star formation limit in Sc galaxies. In addition, the median ratio of at the radius of the last detectable H emission in these galaxies is lower than that found for spiral galaxies by about a factor of two. in the star forming regions are not much higher than near the edges, although star formation is still found where is highest. The exception to the latter result is in the centers of the galaxies, where is usually depressed but the H surface brightness is often high. More puzzling is that in many cases star formation ends in the outer regions before or drop significantly compared to their values in the interior regions where star formation is taking place.
Physically we are seeing rise with in the region where the rotation curves are rising because then and are constant. Where the rotation curves flatten out, varies as the radius times the gas surface density because so . Values of are lower than the cutoff ratio for star formation in spirals found by Kennicutt (1989) because the gas surface density in irregulars is lower at small radii. However, in the outer parts of the irregulars, remains high as the star formation rate drops because the gas column density does not drop as quickly as the star formation. This is not the case in spiral galaxies, and so this situation provides a unique test of the various models.
Our sample of distant, low surface brightness galaxies provided a conflicting comparison. Most of these galaxies are larger systems than those in our Im sample, and they had values of that in some cases reached as high as those in some normal, high surface brightness Sc galaxies. However, several other systems in this sample had that were similar to those in the Im sample. What distinguished these galaxies from the rest of the sample is not clear but does not appear to be the total dark matter mass, rotation speed, or disk scale length.
We explored the relationship between an area-weighted average gas density relative to the critical density and the integrated star formation rate per unit area in our sample of galaxies. The expectation was that a galaxy having more gas at higher densities relative to the critical density would be able to form stars at a higher rate. However, we found no such correlation. This is exemplified by DDO 50 in which the gas density is significantly higher relative to the predicted critical gas density from the other irregulars, but the current star formation rate and optical surface brightness in DDO 50 are not unusually high.
Although the gravitational instability model qualitatively fits the radial trends of star formation in irregular galaxies in some ways, the model fails in many details. Kennicutt (1989) found the same for Sc galaxies. For irregulars, the model fails to predict where star formation ends and which galaxies have higher overall star formation rates. For spirals, the model sometimes fails at small radii. For example, in M33 and NGC 2403 the observed gas density lies below for much of the inner star-forming disk (Kennicutt 1989, Thornley & Wilson 1995).
The sample of galaxies discussed here included only those that have measurable rotation velocities. There are some galaxies like Leo A in which rotation is almost non-existent and the gas motion is primarily random (Young & Lo 1996). This was also true of the outer part of DDO 155 (Carignan et al. 1990). In these systems the model of a rotating disk is not applicable at all. Here it would make more sense to discuss stability in terms of the virial density, or to use the criterion for the existence of a cool thermal phase. We address these models next.
5 Virial and Thermal Models
Another measure of gaseous self-gravity in a galaxy comes from the ratio of the gas volume density to the total virial density from matter in all forms, including stars and dark matter. This virial density comes from the rotation curve and is taken here equal to for a spherical distribution of matter (mostly in a dark halo); is the local rotation speed and is the radius in the galaxy. Elmegreen et al. (1996) discussed the merits of considering as a contributor to the Jeans length for star formation in irregular galaxies. It may be more useful than either or for irregulars because these galaxies are thick, often in solid body rotation, and their dynamics is dominated by dark matter (Carignan & Beaulieu 1989). Phenomenologically, one expects to be relatively large in regions of rapid star formation because then self-gravity can overcome any background galactic tidal or shear forces. For a thin disk, this ratio becomes similar to . Note that the absolute value of in a star-forming region has not been calibrated from observations, so only the relative distribution of this ratio is considered here.
The results of applying the models to the nearby Im galaxy sample are shown on the right in Figure 5, along with the star formation rate in M yr-1. The trends of with radius are similar to the trends of and , so has the same ambiguous connection to a star formation threshold.
These ambiguities lead us to consider another criterion for the onset of star formation, which is the critical combination of parameters that allows the interstellar medium to contain cool diffuse clouds (Elmegreen & Parravano 1994). This model postulates that too low a thermal gas pressure, or too high a gaseous heat source, will permit only the warm (several K) phase of HI to exist. Then the condensation of this gas to cool HI clouds and ultimately cold H2 clouds becomes unlikely unless violent processes increase the pressure locally (like sequentially triggered star formation or end-of-bar gas flows). Criteria for this pure-warm state were evaluated in Elmegreen & Parravano (1994) and a simple approximation to the result was given in Elmegreen (1997). It leads to a critical (lower limit) to the gas column density for the existence of cool gas:
| (1) |
Here is the ratio of the average intensity in the midplane of the irregular to the average intensity in the midplane near the Sun; is the sum of the column densities of the gas and stars inside the gas layer (this quantity appears in the expression for the total midplane gas pressure), and is the ratio of the thermal pressure to the total gas pressure. To get the stellar surface density inside the gas layer, we used the total stellar surface density, , determined from the surface brightness as described above, and multiplied this by the ratio of the gas to the stellar velocity dispersions (see derivation in Elmegreen 1989). The velocity dispersion of the stars was taken to be twice that for the gas, so the total surface density in the gas layer was in fact . We also assume , which is approximately the value for the solar neighborhood; is unknown for irregular galaxies.
The left-hand side of Figure 6 plots versus radius for the nearby sample. depends on , the average stellar radiation field as a function of position in the midplane of each galaxy. To get this quantity, we first determined the radiation field inside a model of the Milky Way disk, including extinction, as discussed in Elmegreen & Parravano (1994). This gave the ratio of the average intensity in the midplane at the solar radius to the intensity viewed perpendicular to the plane from outside the Milky Way. With this ratio we calibrated the midplane average intensity using the effective surface brightness at the Sun’s radius. The V surface brightness of the solar neighborhood was taken to be 22.98 magnitudes arcsec-2 as viewed from outside in the direction of the pole (Allen 1963). Then we calculated the average-midplane and perpendicular intensities in an irregular galaxy. We assumed the local volume emissivity was proportional to the observed surface brightness at each radius, , and integrated over all angles at each radius in the midplane to get the relative average intensity and the perpendicular intensity, as observed from infinity outside the disk. The midplane intensity was calibrated to absolute units by determining the ratio of the average midplane intensity to the perpendicular intensity. With the observed perpendicular intensity (i.e., the observed surface brightness, corrected for inclination) of the galaxy and the perpendicular intensity of the Sun’s neighborhood, we get the ratio of the average midplane intensity in the irregular to that near the Sun. The integration over all angles includes azimuthal and polar angles. For each point on the line of sight, we used the midplane density obtained from the surface density divided by twice the scale height, and modified by a Gaussian in z. This density appears in the local absorption coefficient. We used the stellar density on the line of sight for this integration from the volume emissivity modified by a Gaussian in z too, using the stellar scale height.
For the Milky Way we used a gas scale height of 0.1 kpc and a stellar scale height of 0.2 kpc. The disk scale length is 4 kpc with a maximum disk extent of 24 kpc; the Sun is at a radius of 8.5 kpc. The absorption was taken to be 1.5 optical depths per kpc for a unit gas density. For the irregulars, we assumed gas and stellar scale heights that were twice those for the Milky Way and absorption per unit gas that was 0.3 times that for the Milky Way to account for the lower metal and dust content of irregulars. The gas density was determined from the observed column density divided by twice the scale height of the gas.
In most of the galaxies, the ratio / is 1, suggesting that the gas prefers to be in the warm phase over much of the disk. This is a consequence of the low total surface density, since the pressure scales with the total surface density times the gas surface density. Since the stellar surface density is small compared to that of the gas, the total surface density is essentially the gas surface density. Thus, the pressure is approximately for in units of Mpc-2, where is Boltzman’s constant. The total pressure in the solar neighborhood is 3 and the equivalent to give this is 30 Mpc-2. Thus, . Since in the irregulars, shown in Figure 6, is usually much less than 30 Mpc-2, the average midplane pressures are very low in the irregular galaxies, as low as 1% of the solar neighborhood pressure in some cases. This means that it is hard to sustain a cool phase in the HI gas, even in the presence of relatively low radiation fields. Note that these pressures are independent of any assumptions about magnetic field strengths or supernova rates, as long as the gas layer is in hydrostatic equilibrium.
Without a significant amount of dark matter in the disks of irregular galaxies, the small value of the ratio implies that most of the HI is warm, as mentioned above. This result is consistent with the findings of Young & Lo (1996). In Leo A (DDO69) they found two HI components, one with a high velocity dispersion (9 km s-1) which they identified as a warm gas component, and one with a low velocity dispersion (3.5 km s-1) which they identified as a cold gas component. The cold gas component was associated with current star formation while most of the HI gas was found in the warmer gas component.
There is generally no correspondence between the azimuthally-averaged star formation rate and as a function of radius. In DDO 50, DDO 154, and Sextans A, rises above a value of 1 where the star formation is dropping. In DDO 168 the star formation drops off even though remains around 1. Thus the star formation mechanism is not very dependent on the mean thermal properties of the HI. The presence of significant dark matter in the disk can affect this conclusion, so we discuss the potential role of dark matter in Section 7.
6 A Cloud-Growth Criterion Based on Shear
The critical column density used by Kennicutt (1989) was based on the stability of thin disks for which there is constant competition between self-gravity, pressure, and Coriolis forces (which come from angular momentum conservation). These three forces introduce the three physical variables in the parameter (), namely, , , and , respectively. Other physical processes of cloud formation can depend on slightly different combinations of the physical variables.
Consider a situation where clouds are constantly trying to form because of self-gravity and energy dissipation, and the growth occurs with streaming motions along interstellar magnetic field lines. Then the Coriolis force can be somewhat less important than in the above analysis because magnetic fields easily transfer angular momentum away from the cloud (Elmegreen 1987, 1991). What is more important in this case is the time available for the cloud to grow in the presence of shear.
Shearing perturbations grow at the rate , and this growth is most effective between the times and for Oort constant , which is the local shear rate. Thus the total amplitude of the growth from some initial perturbation is
| (2) |
For the instability to be significant, a perturbation must grow by a sufficiently large factor, say . Thus
| (3) |
or
| (4) |
for critical column density
| (5) |
based on the Oort constant instead of .
This change from to makes very little difference in the critical column density for a flat rotation curve. If we write the rotation curve as , then
| (6) |
For a flat rotation curve such as is usually seen in spiral galaxies, , and the two thresholds are the same to within 12%. For a slowly rising rotation curve or any region of low shear, becomes small and can be much less than . For example, in M33 the rotation curve is slowly rising, giving (Newton 1980). Then , which is in excellent agreement with observed by Wilson et al. (1991) even though this is the region where fails to predict the observed high star formation rate. This derivation of and the motivation for it originally appeared in Elmegreen (1993b).
This process seems particularly well suited to irregular galaxies because of their slowly rising rotation curves. Figure 7 (left) shows values of the growth parameter derived according to equation 5. In all cases, is much closer to 1 than was. There is still not a perfect agreement between the growth parameter and the star formation rate, however. In particular remains high even after star formation ends. But, the overall level of in the regions of star formation is better than for any other criterion given in this paper. This suggests that cloud formation in irregular and other galaxies may involve more of a competition between self-gravity and shear than between self-gravity and Coriolis forces.
7 The Role of Dark Matter
Many irregular galaxies have a higher dark matter fraction than spiral galaxies overall, by a factor of 10 or more, and some may have larger dark matter central densities too (Kormendy 1988, Carignan & Freeman 1988). If the dark matter fraction is relatively high in the disks of irregular galaxies, then dark matter could affect star formation and our estimate of .
There are several observations of dynamical masses for the galaxies studied here. In DDO154, Carignan & Freeman (1988) and Carignan & Beaulieu (1989) found that dark matter is 90% of the total mass at the last measured point of the HI rotation curve, which is about four times the size of the optical disk. They also found for the stellar disk and obtained a central dark matter density of M⊙ pc-3. In IC1613, Lake & Skillman (1989) found and M⊙ pc-3 in the inner regions. In DDO 155, Carignan, Beaulieu, & Freeman (1990) estimated and M⊙ pc-3 within 500 pc. In DDO 168, Broeils (1992) found and M⊙ pc-3 in the luminous disk and M⊙ pc-3 at where . He also estimated in DDO 105 that and M⊙ pc-3 in the luminous disk and and M⊙ pc-3 at .
Various other results have been obtained for late-type galaxies not included here. Van Zee et al (1996) found that % of the total mass is dark in UGCA 20. For NGC 247 (Sd), NGC 300 (Sd), and NGC 3109 (Sm), Carignan & Freeman (1985) find, respectively: 0.0033, 0.0042, and 0.0024 M⊙ pc-3 in the centers and 0.0026, 0.0029, and 0.0014 M⊙ pc-3 at the Holmberg radii. Also for these three galaxies, they obtain 0.85, 0.70, and 1.52. However, not all irregular galaxies are dominated by dark matter. Young & Lo (1996) found that the dynamical mass equals the luminous mass in LeoA if it is in equilibrium. In addition, for the distant low surface brightness galaxies, de Blok et al. (1996) speculate and de Blok & McGaugh (1997) show that those systems are also dark matter dominated and that the dark matter is more diffusely distributed than in high surface brightness galaxies.
For a typical dark matter central density of M⊙ pc-3, the column density of dark matter within pc of the midplane is M⊙ pc-3, which is several times larger than the stellar column densities in many of our galaxies, and comparable to the gas column densities. Here we consider how such a high dark matter fraction in the optical regions of irregular galaxies can affect disk stability and star formation.
Dark matter is likely to be more important for star formation in small galaxies than in large galaxies for several reasons. First, small galaxies have low virial speeds, so the dark matter velocity dispersion is much smaller than in large galaxies, perhaps within a factor of 2 of what is expected for the stars in a small galaxy. Then dark matter effectively acts like stars in the two-fluid instability, giving extra self-gravity to small perturbations in the gas. Second, the relatively large scale heights of small galaxies implies that relatively more halo dark matter resides in the disk, again contributing to disk self-gravity.
Third, thick disks with dark matter should have much higher pressures than thin disk or disks of the same large thickness with only gas and stars. The total gas pressure scales directly with the surface density of matter in all forms within the gas layer. This higher pressure may allow the cool HI phase to exist as a precursor to star formation. The very low pressure derived in section 5 is suspicious anyway: considering only the known stars and gas, the self-gravity of the disk gives a pressure that is only several per cent of the disk pressure in giant spirals. The HII region pressures are probably much larger than this. A pressure of kB for an irregular galaxy (Sect. 5) gives an equilibrium HII region density of only 0.024 cm-3, considering that for K. Such an equilibrium HII region would have an emission measure of only 0.5 cm6 pc even if it were 1000 pc thick, and then it would be essentially invisible. In spiral galaxies, the typical HII regions that are studied in surveys have a density of cm-3 (as determined from data in Kennicutt 1988), which places them in rough pressure equilibrium with the ambient gas (i.e., the HII regions that stand out in galaxies are the relatively old ones that have expanded to large sizes, and not the young regions that are still at high pressure). We might expect the same for HII regions in irregular galaxies, but this would require a much higher midplane pressure than the self-gravity of the gas and stars can give alone. Thus there is probably more mass in the disks of Im and Sm galaxies than is directly attributed to HI and stars.
The effect of dark matter on star formation may be assessed by evaluating and for models with higher total disk column densities. As an example, we assume that the total disk contains 4 times more mass than the sum of the visible gas and stars, and that all of this extra mass has the velocity dispersion of the stars, which is chosen to give the stellar scale height used above, 400 pc. Figure 7 (right) shows calculated in this manner for the nearby irregulars, along with and the star formation rate from before. with dark matter is not shown because it increases by exactly a factor of 2 over that in Figure 6, making generally , since is inversely proportional to the square root of the total disk column density (from the pressure). The change in is more complicated; in many cases the gas still dominates the instability because of its low velocity dispersion.
Dark matter in the disks of these galaxies clearly makes them more unstable to star formation. It may not be a coincidence that the galaxy with evidence for no dark matter, Leo A, also has a very low star formation rate compared to other irregulars. But, there is still a problem with the detailed distribution of relative to the star formation rate. For example, there are outer disks where star formation ends but remains high, and there are regions where star formation is prominent but is relatively low. Moreover, the inclusion of dark matter or stars in the stability criterion for giant spiral galaxies, which is usually based on for a pure gas disk, increases the value of found at the disk edge by a factor of , so irregulars would still be more stable than spiral galaxies by this factor if both contain the expected amounts of total disk mass.
8 The Relationship of Star Formation to Gas and Stars
Since critical densities that depend on local conditions have failed to predict where star formation occurs and ends, we consider instead simply the observed gas and stellar densities, which we plot in Figure 6 along with the star formation rate. Ryder & Dopita (1994) suggested that star formation is closely related to the mean HI surface density in the disks of spiral galaxies. However, we see no correlation between the star formation activity and as a function of radius in irregulars.
Perhaps instead of a varying critical density, we are dealing with a constant threshold column density that does not depend on , but is universal (see references in section 1). Then the star formation rate simply occurs where the gas density is greater than this threshold. We can see a hint of this from Figure 6 where the star formation rate is plotted along with . In all of these galaxies, the place where the star formation rate has dropped to about 0.3 Myr-1 also has equal to approximately 3 Mpc-2. Could this apply to spiral galaxies as well? We can use Kennicutt’s value of for Sc galaxies at the radius beyond which star formation is not detected. Then . If we take c7 km s-1 and km s-1 R-1, then in gm cm-2 which is 112 Mpc. For where star formation in spiral galaxies ends, this value of is only slightly higher than what we find for the irregulars, and in fact it is higher by about the same factor that is lower in the irregulars. This implies that a star formation model with a simple threshold gas column density may have some merit.
The best correlation between the azimuthally-averaged current star formation activity and any other galaxy property discussed here is with the total stellar density , measured from the surface brightness. This is shown on the right in Figure 6, where the star formation rate (dashed line) and (dotted line) generally lie close to each other throughout the whole galaxy. But, is this correlation a cause or an effect? If the star formation rate is roughly constant with radius over timescales of a Gyr for whatever physical reason, we would expect to see such a correlation. However, the correlation could also imply a physical connection—a feedback mechanism between the older stars and the star formation process. Perhaps star formation needs turbulence to make clouds, and the stars increase the turbulence through gravitational stirring, stellar winds, and radiation pressure.
The relationship between star formation activity and is similar to what is seen in spiral galaxies. Ryder & Dopita (1994) observed that star formation closely follows the old stellar mass surface density in spirals although they saw less of a correlation in V-band than in I-band. Also in spirals, the molecular gas, as traced by CO, follows the blue starlight (Young & Scoville 1982).
If star-induced star formation plays a larger role in facilitating cloud formation in irregulars than in other galaxies, then the lack of stars when the irregular first formed would result in a system that was slower to begin forming stars. Observationally, star formation rates in early-type spirals have been gradually dropping over the Hubble time (Schmidt 1959; Sandage 1986; Larson 1992; Kennicutt, Tamblyn, & Congdon 1994), while those in late-type spirals and irregulars have remained roughly constant (see, for example, Kennicutt et al. 1994; Tosi et al. 1991; Greggio et al. 1993; Marconi et al. 1995; Tolstoy 1996). For those irregulars that were isolated, the lack of external stimulations would allow a sustained low level of star formation, as Bothun et al. (1993) have suggested, as long as the star-induced star formation process was not so efficient that the feedback from stars was able to run away (Larson 1996).
An alternative explanation for the correlation between star formation rate and old star density is that star formation always gives an exponential disk, regardless of the current star formation rate or the value of an instability criterion. This could result from viscous evolution, for example, with a star formation rate proportional to the viscosity (Lin & Pringle 1987; Yoshii & Sommer-Larsen 1989; Saio & Yoshii 1990). Then the correlation between and star formation rate for spiral galaxies would be coincidental and not necessarily the same for irregulars.
For example, may be controlled by spiral-wave induced disk accretion in giant galaxies, a process that would not work well in irregulars because of their relatively large scale heights. Spiral waves prefer thin galaxies where the velocity dispersion is low relative to the rotation speed. These waves, along with viscosity, produce torques that drive gas accretion, always keeping at the threshold of spiral-forming instabilities. If because of spiral-driven accretion, then this ratio could be anything in irregular galaxies and it would have little direct connection to star formation. For an exponential gas disk with a flat rotation curve and nearly constant velocity dispersion, for disk scale length . This function is small at small radii, rises to a peak at , and then decreases in the outer part of the galaxy, as observed for . The observation that is greater than 0.7 or some other constant inside would follow entirely from the fact that generally. In this interpretation, is more related to the formation of spiral arms than to star formation activity. The results presented here for irregular galaxies support this interpretation because they show no strong correlations between and star formation activity once spiral arms are absent.
9 Summary
Irregular galaxies are an interesting and unique test of models for the physical laws regulating the formation of gas clouds that can form stars in galaxies. Irregulars lack the spiral density waves and tidal shears that contribute to gravitationally induced instabilities. Irregulars, unlike spirals, also have azimuthally-averaged gas surface densities that do not drop off as fast as star formation.
We have calculated several model critical gas densities for instabilities that would lead naturally to cloud and star formation in irregular galaxies. These models considered thin pure-gas disks, thick gas+star disks, three dimensional systems including dark matter, the thermal properties of the gas, and shear-regulated cloud formation. The resulting critical densities for cloud formation were compared with the observed gas densities in a sample of irregular galaxies. The ratio of observed to critical gas density as a function of radius was also compared with the azimuthally-averaged current star formation rate as traced by H emission and with the broad-band stellar surface brightness, a tracer of star formation integrated over a timescale of 1 Gyr.
We found that the ratios of observed to critical gas densities are lower in irregulars than in spiral galaxies by a factor of in all cases but the shear-regulated model. This suggests that the gas in irregulars is closer to stability, even though star formation is occurring. However, no model was able to predict with any accuracy where the star formation actually occurs, and especially where it ends. These two items suggest that other processes are important for cloud and star formation. An obvious mechanism is sequentially triggered star formation driven by the mechanical energy input from concentrations of massive stars. Applications of this mechanism to small galaxies have been discussed extensively (e.g., Gerola, Seiden & Schulman 1980; Athanassoula 1994). Another process is random gas compression from turbulence. Both of these processes have a sensitivity to the critical density like the gravitational instability model, but do not involve large-scale instabilities directly. They could in fact dominate the star formation process when spiral arms are not present.
Kennicutt (1989) and Thornley & Wilson (1995) have pointed out that the gravitational instability model for the thin, pure-gas disk also fails for several late-type spirals. In particular the gas in the inner parts of M33 and NGC 2403 is below and yet star formation is taking place there. Thornley & Wilson also suggest that other processes, such as stochastic star formation, may be responsible for initiating cloud formation in these regions. However, both of these galaxies also have weak spiral density waves, so it may be the spiral density waves that are playing the key role here.
We also considered the possibility that dark matter contributes a higher fraction of the total disk mass in irregulars than in spirals, perhaps by a factor of two. This enhances disk instability in the two-fluid model and allows the formation of cool HI, a necessary precursor to star formation. A high dark matter fraction in the disk also seems reasonable for irregulars because the ratio of dark matter to total matter is larger in most of these galaxies than in giant spirals. However, if we include dark matter in irregulars, then we should also include stars and other disk mass in the instability threshold for giant spirals. When this is done, there is still a factor of two discrepancy between for spirals and irregulars.
The possibility that star formation requires a threshold gas column density rather than a value that scales with the epicyclic frequency, as in the usual analysis, was also considered. A threshold of M⊙ does indeed seem to predict where star formation stops in the outer disks of both irregular galaxies and giant spirals, and it may also apply to low surface brightness disks that have gas column densities this low or lower throughout. The physical reason behind a constant density threshold is not known, but such a criterion was also proposed in the model of stochastic self-propagating star formation by Seiden & Schulman (1990).
The best correlation we found was between the current star formation activity and the stellar surface density. This could indicate a feedback mechanism in which energy input by stars to the interstellar medium facilitates cloud formation for future generations of stars. If this feedback plays a key role in the formation of clouds, then this could also explain why irregular galaxies were slow to begin forming stars after they first coalesced out of the primordial gas.
Another possibility is that the stellar surface density correlation results from a star formation process that always gives an exponential disk. Then may be because of processes related to spiral arm generation rather than star formation. In this case, the correlation between and star formation in giant galaxies is not causal, and a different in non-spiral galaxies, such as irregulars, is possible. A good test of this explanation may come from flocculent galaxies or the low surface brightness samples of large galaxies, which have only weak spiral arms. So far, flocculent galaxies and a majority of the large, low surface brightness systems seem to have , the same as giant spirals. This comes from Kennicutt’s (1989) study, which included several flocculents, van der Hulst et al.’s (1993) study of low surface brightness spirals, and our study of large, low surface brightness galaxies without obvious spiral arms. However, if the low that we have found for irregulars is the result of star formation not strongly related to , and if the real feedback process giving constant for giant galaxies is related to spiral arm generation, and only indirectly related to star formation, then flocculent and large low surface brightness galaxies could lack a detailed correlation between and star formation just like the irregulars.
The comparisons with models that we have made here have all dealt with azimuthally-averaged quantities. However, in irregular galaxies, neither the star formation nor the HI is uniformly distributed across the galaxy. Thus, azimuthal-averages of HI and H are only rough approximations to radial trends (see, for example, van Zee et al. 1997). This may be particulary important in galaxies with low shear, such as irregulars. We have suggested that sequentially triggered star formation driven by mechanical energy input from concentrations of massive stars is likely to be an important mechanism in cloud formation in these small galaxies. A consequence of the low levels of shear is that the holes formed by these massive stars or by any other mechanism will last a longer time and smoothing of the gas will take longer than in spirals. It is the gas density of clumps in the ISM relative to the critical gas density that is important, not the average gas density, in determining the instability of that gas to cloud formation. This implies that if the surface filling factor of dense gas is about 0.5 in irregulars, then the effective value of from the instability analysis should be increased by 1/0.5 to account for instabilities in only the dense gas. This makes where the gas is more like the value for giant spiral galaxies, but it also illustrates how the condensations cannot come only from instabilities in an initially uniform medium, because then would be too low again. We will explore this idea in more detail in a future paper.
| Galaxy | TypeaaGalactic morphological classes are from RC3 and Schombert et al. (1992). | DbbBased on an H0 of 65 km s-1 Mpc-1 where VGSR are obtained from the HI references or RC3. The exceptions are DDO 155 and IC1613 where the distances are taken from de Vaucouleurs & Moss (1983) and McAlary, Madore, & Davis (1984). | E(BV)fccE(BV)f is foreground reddening from Burstein & Heiles (1978, 1984). Total reddening E(BV)T is foreground plus internal where the internal reddening is taken to be 0.05 for cases where an observational estimate does not exist. | E(BV)TccE(BV)f is foreground reddening from Burstein & Heiles (1978, 1984). Total reddening E(BV)T is foreground plus internal where the internal reddening is taken to be 0.05 for cases where an observational estimate does not exist. | MddTotal absolute B magnitude corrected for extinction. Magnitudes come from RC3 and de Blok et al. (1995, 1996). | eeAverage B surface brightness within the 25 magnitude arcsec-2 surface brightness level, corrected for extinction. Magnitudes come from RC3 and de Blok et al. (1995, 1996). | R25ffRadius of the galaxy measured to the 25 B-magnitude arcsec-2, in arcsec, corrected for reddening. Values are determined from surface photometry given by Carignan et al. (1990), Carignan & Beaulieu (1989), Broeils (1992), and images obtained at Lowell Observatory. For the distant sample values are taken from de Blok et al. (1995, 1996) and not corrected for reddening. |
|---|---|---|---|---|---|---|---|
| (Mpc) | (mag arcsec-2) | (″) | |||||
| IC1613 | IB(s)m | 0.73 | 0.005 | 0.06 | 14.6 | 24.3 | 284 |
| DDO 50 | Im | 3.2 | 0.02 | 0.07 | 16.7 | 23.8 | 188 |
| DDO 105 | IB(s)m: | 15.6 | 0 | 0.05 | 17.2 | 25.1 | 71 |
| DDO 154 | IBsm | 4.0 | 0.008 | 0.06 | 14.3 | 24.5 | 62 |
| DDO 155 | Im | 1.1 | 0.01 | 0.06 | 10.8 | 23.3 | 38 |
| DDO 168 | IBm | 3.5 | 0 | 0.05 | 15.2 | 23.0 | 144 |
| Sextans A | IB(s)m | 1.3 | 0.02 | 0.02 | 14.2 | 24.0 | 144 |
| F561-1 | Sm | 72 | 0.04 | 0.09 | 18.8 | 23.9 | 21 |
| F563-1 | Sm/Im | 52 | 0.02 | 0.07 | 18.3 | 24.5 | 23 |
| F563-V1 | dI | 58 | 0.03 | 0.08 | 17.2 | 24.5 | 13 |
| F563-V2 | Irr | 71 | 0.04 | 0.09 | 18.9 | 23 | |
| F565-V2 | Im | 55 | 0.02 | 0.07 | 16.4 | 25.2 | 10 |
| F567-2 | Sm | 86 | 0.03 | 0.08 | 18.4 | 24.3 | 9 |
| F574-2 | Sm: | 101 | 0.01 | 0.06 | 18.7 | 24.5 | 9 |
| F583-1 | Sm/Irr | 37 | 0.03 | 0.08 | 17.2 | 21 |
| Galaxy | paaaPosition angles and inclinations are taken from the HI references and are used in doing elliptical photometry of H images. The exception is DDO 50 where the HI position angle did not make sense for the optical image; instead we used a position angle determined from the broad-band optical image. | iaaPosition angles and inclinations are taken from the HI references and are used in doing elliptical photometry of H images. The exception is DDO 50 where the HI position angle did not make sense for the optical image; instead we used a position angle determined from the broad-band optical image. | bbVelocity dispersion of the gas. Values in parenthesis are assumed; values for DDO 155 and DDO 50 are galaxy-wide averages. | HI Reference | Reference |
|---|---|---|---|---|---|
| (°) | (°) | (km/s) | |||
| IC1613 | 58 | 38 | 7.5 | Lake & Skillman 1989ccValues in Table IV of Lake & Skillman (1989) are labeled as Jy/beam km s-1 but appear to actually be 10mJy/beam km s-1. | Ables 1971 |
| DDO 50 | 30 | 40 | 6.8 | Puche et al. 1992 | This paper |
| DDO 105 | 250 | 61 | (9) | Broeils 1992 | This paper |
| DDO 154 | 38 | 57 | (9) | Carignan & Beaulieu 1989 | Carignan & Beaulieu 1989 |
| DDO 155 | 47 | 47 | 9.5 | Carignan et al. 1990 | Carignan et al. 1990 |
| DDO 168 | 328 | 76 | (9) | Broeils 1992 | Broeils 1992 |
| Sextans A | 50 | 36 | 9.0 | Skillman et al. 1988 | Hunter & Plummer 1996 |
| F561-1 | 55 | 24 | (9) | de Blok et al. 1996 | |
| F563-1 | 19 | 25 | (9) | de Blok et al. 1996 | |
| F563-V1 | 40 | 60 | (9) | de Blok et al. 1996 | |
| F563-V2 | 32 | 39 | (9) | de Blok et al. 1996 | |
| F565-V2 | 155 | 60 | (9) | de Blok et al. 1996 | |
| F567-2 | 119 | 20 | (9) | de Blok et al. 1996 | |
| F574-2 | 53 | 30 | (9) | de Blok et al. 1996 | |
| F583-1 | 5 | 63 | (9) | de Blok et al. 1996 |
| Galaxy | log SFR/areaaaStar formation rate per unit area where the area is that within R25. The star formation rate is determined from LHα according to the formula in Hunter & Gallagher (1986). | bbThe radius, deprojected to the plane of the galaxy, at which the furthest H emission is detected in our H images. | ccThe shorter axis of the synthesized beam was used. | ddThe area-weighted average of for the region of the galaxy interior to . | ()max | ee is at (after Kennicutt 1989). For F567-2, the HI map did not go out as far as , so a value of could not be determined there. |
|---|---|---|---|---|---|---|
| (M/yr/kpc-2) | (kpc) | |||||
| IC1613 | 3.46 | 1.8 | 14.2 | 0.45 | 0.56 | 0.25 |
| DDO 50 | 2.88 | 4.3 | 69.8 | 1.14 | 1.51 | 1.14 |
| DDO 105 | 3.78 | 10.4 | 10.5 | 0.45 | 0.51 | 0.50 |
| DDO 154 | 3.53 | 2.2 | 3.3 | 0.36 | 0.39 | 0.34 |
| DDO 155 | 2.24 | 0.3 | 3.9 | 0.30 | 0.57 | 0.38 |
| DDO 168 | 3.20 | 2.6 | 11.0 | 0.33 | 0.87 | 0.23 |
| Sextans A | 2.76 | 1.2 | 4.2 | 0.26 | 0.31 | 0.30 |
| F561-1 | 3.09 | 8.6 | 1.9 | 0.74 | 0.89 | 0.89 |
| F563-1 | 0.56 | |||||
| F563-V1 | 3.51 | 4.4 | 1.2 | 0.60 | 0.91 | 0.57 |
| F563-V2 | 3.08 | 10.0 | 2.2 | 0.66 | 0.82 | 0.72 |
| F565-V2 | 3.38 | 5.4 | 1.5 | 0.45 | 0.54 | 0.41 |
| F567-2 | 2.86 | 12.1 | 2.2 | 1.09 | ||
| F574-2 | 1.40 | |||||
| F583-1 | 2.98 | 10.9 | 4.7 | 0.61 | 0.69 | 0.69 |
References
- (1)
- (2) Ables, H. 1971, PUSNO, 2d Ser., 20, Part 4
- (3) Allen, C. W. 1963, Astrophysical Quantities (London: Oxford Univ. Press), 269
- (4) Athanassoula, E. 1984, Phys.Reps., 114, 319
- (5) Athanassoula, E. 1994, in Dwarf Galaxies, edited by G. Meylan and P. Prugniel (Garching bei München,ESO), p 525
- (6) Binggeli, B. 1994, in Dwarf Galaxies, edited by G. Meylan and P. Prugniel (Garching bei München,ESO), p 13
- (7) Bothun, G. D., Schombert, J. M., Impey, C. D., Sprayberry, D., McGaugh, S. S. 1993, AJ, 106, 530
- (8) Boulanger, F. & Viallefond, F. 1992, A&A, 266, 37
- (9) Broeils, A. 1992, Ph.D. thesis, Rijksuniversiteit Groningen
- (10) Buat, V., Deharveng, J. M., & Donas, J. 1989, A&A, 223, 42
- (11) Burstein, D., & Heiles, C. 1978, ApJ, 225, 40
- (12) Burstein, D., & Heiles, C. 1984, ApJS, 54, 81
- (13) Byrd, G., Rautiainen, P., Salo, H., Buta, R., & Crocker, D. A. 1994, AJ, 108, 476
- (14) Caldwell, N., Kennicutt, R., Phillips, A.C. & Schommer, R.A. 1992, ApJ, 370, 526
- (15) Carignan, C., & Beaulieu, S. 1989, ApJ, 347, 760
- (16) Carignan, C., Beaulieu, S., & Freeman, K. C. 1990, AJ, 99, 178
- (17) Carignan, C., & Freeman, K. C. 1985, ApJ, 294, 494
- (18) Carignan, C., & Freeman, K. C. 1988, ApJ, 332, L33
- (19) Cohen, R., Dame, T., Garay, G., Montani, J., Rubio, M., & Thaddeus, P. 1988, ApJ, 331, L95
- (20) de Blok, W. J. G., & McGaugh, S. S. 1997, MNRAS, in press
- (21) de Blok, W. J. G., McGaugh, S. S., & van der Hulst, J. M. 1996, MNRAS, 283, 18
- (22) de Blok, W. J. G., van der Hulst, J. M., & Bothun, G. D. 1995, MNRAS, 274, 235
- (23) de Vaucouleurs, G., de Vaucouleurs, A., Corwin, H., Buta, R., Paturel, G., & Fouqué, P. 1991, Third Reference Catalogue of Bright Galaxies (New York:Springer) (RC3)
- (24) de Vaucouleurs, G., & Moss, C. 1983, ApJ, 271, 123
- (25) Dopita, M. A., Mathewson, D. S., & Ford, V. L. 1985, ApJ, 297, 599
- (26) Elmegreen, B. G. 1982, ApJ, 253, 634
- (27) Elmegreen, B. G. 1987, ApJ, 312, 626
- (28) Elmegreen, B. G. 1989, ApJ, 338, 178
- (29) Elmegreen, B. G. 1991, ApJ, 378, 139
- (30) Elmegreen, B. G. 1992, in Star Formation in Stellar Systems, edited by G. Tenorio-Tagle, M. Prieto, and F. Sánchez, (Cambridge Univ. Press,Cambridge), p 381
- (31) Elmegreen, B. G. 1993a, ApJ, 419, L29
- (32) Elmegreen, B. G. 1993b, in Star Forming Galaxies and their Interstellar Media, ed. J. Franco, F. Ferrini, and G. Tenorio-Tagle, Cambridge University Press, p. 337
- (33) Elmegreen, B. G. 1994a, ApJ, 433, 39
- (34) Elmegreen, B. G. 1994b, ApJ, 427, 384
- (35) Elmegreen, B. G. 1994c, ApJ, 425, L73
- (36) Elmegreen, B. G. 1995a, in The 7th Guo Shoujing Summer School on Astrophysics: Molecular Clouds and Star Formation, ed. C. Yuan and Hunhan You, (Singapore: World Press) p 149
- (37) Elmegreen, B. G. 1995b, MNRAS, 275, 944
- (38) Elmegreen, B. G. 1997, in Starburst Activity in Galaxies, editted by J. Franco, R. Terlevich, & A. Serrano, Revista Mexicana de Astron. and Astrofis. (Serie Conferencias), 6, 165
- (39) Elmegreen, B. G., & Parravano, A. 1994, ApJ, 435, L121
- (40) Elmegreen, B. G., Elmegreen, D. M., Salzer, J. J., & Mann, H. 1996, ApJ, 467, 579
- (41) Fall, S.M., & Efstathiou, G. 1980, MNRAS, 193, 189
- (42) Gammie, C. F. 1996, ApJ, 462, 725
- (43) Gallagher, J. S., & Hunter, D. A. 1984, ARA&A, 22, 37
- (44) Gallagher, J. S., Hunter, D. A., & Tutukov, A. V. 1984, ApJ, 284, 544
- (45) Gerola, H., Seiden, P. E., & Schulman, L. S. 1980, ApJ, 242, 517
- (46) Goldreich, P., & Lynden-Bell, D. 1965, MNRAS, 130, 97
- (47) Greggio, L., Marconi, G., Tosi, M., & Focardi, P. 1993, AJ, 105, 894
- (48) Guiderdoni, B. 1987, A&A, 172, 27
- (49) Hodge, P. W. 1971, ARA&A, 9, 35
- (50) Hodge, P. W. 1978, ApJS, 37, 145
- (51) Hodge, P. W., & Hitchcock, J. L. 1966, PASP, 78, 79
- (52) Hodge, P. W., & Kennicutt, R. C. 1983, ApJ, 267, 563
- (53) Hodge, P. W., Lee, M. G., & Gurwell, M. 1990, PASP, 102, 1245
- (54) Hunter, D. A. 1997, PASP, in press
- (55) Hunter, D. A., & Gallagher, J. S. 1985, ApJS, 58, 533
- (56) Hunter, D. A., & Gallagher, J. S. 1986, PASP, 98, 5
- (57) Hunter, D. A., Gallagher, J. S., & Rautenkranz, D. 1982, ApJS, 49, 53
- (58) Hunter, D. A., Hawley, W. N., & Gallagher, J. S. 1993, AJ, 106, 1797
- (59) Hunter, D. A., & Plummer, J. D. 1996, ApJ, 462, 732
- (60) Jog, C., & Solomon, P.M. 1984, ApJ, 276, 114
- (61) Kennicutt, R. C. 1988, ApJ, 334, 144
- (62) Kennicutt, R. C. 1989, ApJ, 344, 685
- (63) Kennicutt, R. C., Tamblyn, P., & Congdon, C. W. 1994, ApJ, 435, 22
- (64) Kormendy, J. 1988, in Origin, Structure and Evolution of Galaxies, ed. Fang Li Zhi (Singapore: World Scientific), p. 252
- (65) Kroupa, P. 1995, MNRAS, 277, 1491
- (66) Lake, G., & Skillman, E. D. 1989, AJ, 98, 1274
- (67) Larson, R. B. 1992, in III Canary Islands Winter School of Astrophysics: Star Formation in Stellar Systems, edited by G. Tenorio-Tagle, M. Prieto, and F. Sánchez (Cambridge:Cambridge University Press), p 125
- (68) Larson, R. B. 1996, in The Interplay Between Massive Star Formation, the ISM, and Galaxy Evolution, edited by D. Kunth, B. Guiderdoni, M. Heydari-Malayeri, and T. X. Thuan (Gif-sur-Yvette, France:Editions Frontieres), p 3
- (69) Larson, R. B., & Tinsley, B. M. 1978, ApJ, 219, 46
- (70) Lin, D.N.C., & Pringle, J.E. 1987, MNRAS, 225, 607
- (71) Madore, B. F., van den Bergh, S., & Rogstad, D. H. 1974, ApJ, 191, 317
- (72) Marconi, G., Tosi, M., Greggio, L., & Focardi, P. 1995, AJ, 109, 173
- (73) McAlary, C. W., Madore, B. F., & Davis, L. E. 1984, ApJ, 276, 487
- (74) McGaugh, S. S. 1994, ApJ, 426, 135
- (75) McGaugh, S. S., Schombert, J. M., & Bothun, G. D. AJ, 109, 2019
- (76) Mouschovias, T. Ch. 1981, in Fundamental Problems in Theory of Stellar Evolution, ed. D. Q. Lamb & D. N. Schramm (Dordrecht:Reidel), p 27
- (77) Newton, K. 1980, MNRAS, 190, 689
- (78) Parker, E. N. 1966, ApJ, 145, 811
- (79) Pildis, R. A., Schombert, J. M., & Eder, J. A. 1997, ApJ, 481, 157
- (80) Price, J. S., Mason, S. F., & Gullixson, C. A. 1990, AJ, 100, 420
- (81) Puche, D., Westpfahl, Brinks, E., & Roy, J-R. 1992, AJ, 103, 1841
- (82) Quirk, W. J. 1972, ApJ, 176, L9
- (83) Reaves, G. 1952, PhD thesis, University of California
- (84) Reaves, G. 1997, private communication
- (85) Romeo, A. B. 1992, MNRAS, 256, 307
- (86) Rönnback, J., & Bergvall, N. 1995, A&A, 302, 353
- (87) Rubio, M., Garay, G., Montani, J., & Thaddeus, P. 1991, ApJ, 368, 173
- (88) Ryder, S. D., & Dopita, M. A. 1994, ApJ, 430, 142
- (89) Safronov, V. S. 1960, Ann.d’Ap., 23, 979
- (90) Saio, H., & Yoshii, Y. 1990, ApJ, 363, 40
- (91) Salpeter, E. 1955, ApJ, 121, 161
- (92) Sandage, A. 1971, ApJ, 166, 13
- (93) Sandage, A. 1986, A&A, 161, 89
- (94) Schild, R. 1977, AJ, 82, 337
- (95) Schmidt, M. 1959, ApJ, 129, 243
- (96) Schombert, J. M., & Bothun, G. D. 1988, AJ, 95, 1389
- (97) Schombert, J. M., Bothun, G. D., Impey, C. D., & Mundy, L. G. 1990, AJ, 100, 1523
- (98) Schombert, J. M., Bothun, G. D., Schneider, S. E., & McGaugh, S. S. 1992, AJ, 103, 1107
- (99) Schombert, J. M., Pildis, R. A., Eder, J. A. & Oemler, A. 1995, AJ, 110, 2067
- (100) Seiden, P. E. 1983, ApJ, 266, 555
- (101) Seiden, P. E. , & Schulman, L. S. 1990, Adv. Phys., 39, 1
- (102) Shlosman, I., & Begelman, M.C. 1989, ApJ, 341, 685
- (103) Skillman, E. D. 1987, in Star Formation in Galaxies, ed. C. Persson (Washington:GPO), p 263
- (104) Tammann, G. A. 1980, in Dwarf Galaxies, edited by M. Tarenghi and K. Kjar, (ESO/ESA Workshop), p 3
- (105) Taylor, C. L., Brinks, E., Pogge, R. W., & Skillman, E. D. 1994, AJ, 107, 971
- (106) Thornley, M. D., & Wilson, C. D. 1995, ApJ, 447, 616
- (107) Tolstoy, E. 1996, PhD thesis, Rijksuniversiteit Groningen
- (108) Toomre, A. 1964, ApJ, 139, 1217
- (109) Toomre, A. 1981, in The Structure and Evolution of Normal Galaxies, ed. S. M. Fall and D. Lynden-Bell (Cambridge: Cambridge Univ.), p 111
- (110) Tosi, M., Greggio, L., Marconi, G., & Focardi, P. 1991, AJ, 102, 951
- (111) Tully, R., Bottinelli, L., Fisher, J., Gouguenheim, L., Sancisi, R., & van Woerden, H. 1978, A&A, 63, 37
- (112) Vader, J.P. & Vigroux, L. 1991, A&A, 246, 32
- (113) van den Bergh, S. 1988, PASP, 100, 344
- (114) van der Hulst, J. M., Skillman, E. D., Smith, T. R., Bothun, G. D., McGaugh, S. S., & de Blok, W. J. G. 1993, AJ, 106, 548
- (115) van Zee, L., Haynes, M. P., Salzer, J. J., & Broeils, A. H. 1996, AJ, 112, 129
- (116) van Zee, L., Haynes, M. P., Salzer, J. J., & Broeils, A. H. 1997, AJ, 113, 1618
- (117) Wilson, C.D., Scoville, N. & Rice, W. 1991, AJ, 101, 129
- (118) Yoshii, Y., & Sommer-Larsen, J. 1989, MNRAS, 236, 779
- (119) Young, L. M., & Lo, K. Y. 1996, ApJ, 462, 203
- (120) Young, J. S., & Scoville, N. 1982, ApJ, 258, 467
- (121) Zasov, A.V., & Simakov, S.G. 1988, Astrophys, 29, 190
- (122)