Observability of Rays from Dark Matter
Neutralino
Annihilations in the Milky Way Halo
Recent advances in N-body simulations of cold dark matter halos point to a substantial density enhancement near the center. This means that, e.g., the ray signals from neutralino dark matter annihilations would be significantly enhanced compared to old estimates based on an isothermal sphere model with large core radius.
Another important development concerns new detectors, both space- and ground-based, which will cover the window between 50 and 300 GeV where presently no cosmic -ray data are available.
Thirdly, new calculations of the -ray line signal (a sharp spike of relative width) from neutralino annihilations have revealed a hitherto neglected contribution which, for heavy higgsino-like neutralinos, gives an annihilation rate an order of magnitude larger than previously predicted.
We make a detailed phenomenological study of the possible detection rates given these three pieces of new information. We show that the proposed upgrade of the Whipple telescope will make it sensitive to a region of parameter space, with substantial improvements possible with the planned new generation of Air Cherenkov Telescope Arrays. We also comment on the potential of the GLAST satellite detector.
An evaluation of the continuum -rays produced in neutralino annihilations into the main modes is also done. It is shown that a combination of high-rate models and very peaked halo models are already severely constrained by existing data.
1 Introduction
The dark matter problem is one of the most outstanding problems confronting cosmology and astrophysics today. The question of the nature of the dark matter in the Universe is a cross-disciplinary one which may need elements of particle physics for its solution. With new observations, the possible candidates get more and more constrained.
Let us first recall that from the particle physics point of view, the theoretically preferred (Einstein-De Sitter) Universe has the simple description
| (1) |
where as usual we have introduced the normalization of the energy density to the critical density
| (2) |
and is the contribution to the energy density from a cosmological constant (or equivalently from vacuum energy).
The Einstein–De Sitter model (1) has the attractive features that it is simple, avoids finetuning, and may be explained by a period of inflation in the earliest Universe. Since Big Bang nucleosynthesis (BBN) puts an upper limit to the baryonic contribution of [1]
| (3) |
with related to the Hubble constant by (observationally, lies between 0.4 and 0.8), non-baryonic dark matter dominates the energy density by a large factor in this type of model. Indeed, there is a number of different observations on scales from dwarf galaxies and upwards which point to a larger value of than that allowed by nucleosynthesis [2]. It therefore seems that non-baryonic dark matter has to be present in substantial amounts in the Universe today.
One of the prime candidates for the non-baryonic component is provided by the lightest supersymmetric particle, plausibly the lightest neutralino [2]. Supersymmetry seems to be a necessity in superstring theory (or M-theory) which unites all the fundamental forces of nature, including gravity. In most versions of the low-energy theory there is a conserved multiplicative quantum number, R-parity, which makes the lightest supersymmetric particle stable. Thus, pair-produced neutralinos in the early Universe which left thermal equilibrium as the Universe expanded should have a non-zero relic abundance today. If the scale of supersymmetry breaking is related to that of electroweak breaking, may come out in the right order of magnitude to explain the non-baryonic dark matter.
In addition, neutralinos are generically found to decouple at a temperature that is roughly , which means that they are non-relativistic already at decoupling and certainly behave as Cold Dark Matter (CDM) by the time of matter dominance and structure formation. Most analyses of large scale structure formation in the Universe indeed find that CDM models (perhaps with a small addition of, e.g., massive neutrinos) give the best description of observational data.
Although accelerators like the Tevatron at Fermilab and LEP at CERN have already started to probe regions of parameter space, so far without finding any supersymmetric signals, the constraints imposed are not yet very restrictive. Adding the requirement that neutralinos make up most of the dark matter, one finds that there are viable models in the mass interval 30 GeV 10 TeV. In the low mass range, the direct detection at accelerators or in terrestrial detectors sensitive to the weak interactions generated by particles of the Milky Way halo as they pass the Earth are probably the most promising methods of detection (see [3] for an extensive review).
At the high mass end (or, depending on halo paramaters, maybe even over the full mass range) indirect detection methods are competitive. The best indirect signals are given by neutrinos from the Sun or the central region of the Earth, and by almost monoenergetic rays lines originating from neutralino annihilations in the Milky Way halo.
Neutrinos can escape from the centre of the Sun or Earth, where neutralinos may have been gravitationally trapped and therefore their density enhanced. Gamma rays may result from loop-induced annihilations [4] or [5].
The rates of these processes are difficult to estimate because of uncertainties in the supersymmetric parameters, cross sections and halo density profile. However, in contrast to other proposed detection methods they have the virtue of giving very distinct, “smoking gun” signals: high-energy neutrinos from the centre of the Earth or Sun, or monoenergetic photons with or from the halo. The neutrino signal has been thoroughly discussed in the literature [6]. In this article, we concentrate on ray lines, where three recent lines of development have prompted us to take a new look at this process (for early studies, see [7]).
Firstly, a number of numerical studies using N-body simulations [8, 9, 10, 11] have shown that in CDM cosmologies the hierarchical way that halos form means that they should have a density profile which is quite steep with a singular behaviour with estimates of ranging from 0.2 to 1.7. The physics underlying this behaviour is simple: in CDM models with scale-invariant gaussian initial fluctuations small clumps go nonlinear first, where the large average background density at the early epochs means that the smallest clumps are densest. Through the amplifying action of gravity, larger regions of overdensity form by the merging of smaller substructures. Through tidal interactions the overall halo distribution gets smeared out, but near the center some of the densest clumps leave a trace in form of their high average overdensity. Taking the interplay between the CDM and baryonic parts of the halo into account, a satisfactory description of the rotation curves of even dwarf spheroidal galaxies can be achieved [12].
Since the probability for two CDM particles such as neutralinos to meet and annihilate each other is proportional to the square of the neutralino density, this enhancement near the galactic center could be of utmost importance for the ray line signal.
The second development concerns the calculation of the processes and , which only recently were computed fully to one loop in the MSSM, the minimal supersymmetric extension of the Standard Model of particle physics [4, 5]. In these calculations it was shown that previously neglected contributions could increase the predicted rates by an order of magnitude, especially at the high-mass end of the allowed range.
In the high mass range, 250 GeV, existing Air Cherenkov Telescopes (ACT) could already be sensitive to the ray lines. However, the third interesting development is the planning and construction of a new generation of ACTs which will have larger area, lower threshold and better energy resolution. This will improve substantially the discovery potential of these telescopes for supersymmetric dark matter. Also, plans are being made for a satellite-borne detector (GLAST is one of the design concepts) which can compensate a factor smaller area than ACTs by a larger angular acceptance, better energy resolution, lower energy threshold and longer integration time.
The plan of this article is as follows. In Section 2, we give an introduction to the MSSM and the predictions of the line flux. In Section 3 we discuss various halo models and their implications for the ray flux in ACTs from neutralino annihilations. In Section 4 we give an overview of present and planned detectors for cosmic rays, and in Section 5 we discuss the detection potential of several existing or upcoming ACTs. In Section 6 we discuss the discovery potential of satellite detectors, and in Section 7 we comment also on the diffuse continuum rays that would be produced as secondary annihilation products if neutralinos make up a significant part of the dark matter. Finally, in Section 8 we discuss our results and give some concluding remarks.
2 Overview of MSSM Results for Lines
We have performed a detailed phenomenological analysis of the annihilation rate of non relativistic neutralinos into two photons and into a photon and a boson. The two processes, which have the experimentally significant feature of giving nearly monochromatic photons in the final state, with an energy and , respectively, have been studied in Refs. [4] and [5] where for the first time a full one loop calculation of the two cross sections was performed. Considering a broad selection of MSSM models in which the neutralino is the lightest supersymmetric particle and a good dark matter candidate, the aim of this Section is to examine in which cases the two annihilation processes are important. We will compare the relative values of the cross sections in view of extracting information on the nature of the neutralino from a possible detection of one or both the gamma ray lines from neutralino annihilations in the galactic halo.
In the minimal supersymmetric extension of the Standard Model four neutral spin-1/2 Majorana particles are introduced, the partners of the neutral gauge bosons , and the neutral CP-even higgsinos , . Diagonalizing the corresponding mass matrix, four mass eigenstates are obtained:
| (4) |
The lightest of these, or simply , is commonly referred as the neutralino. It is useful to introduce the gaugino fraction defined as
| (5) |
and classify the neutralino as higgsino-like when , mixed when and gaugino like if .
The general R-parity conserving version of the MSSM is defined by 63 free parameters [3]. Some simplifying assumptions are necessary to reduce the number of parameters and get to a format which is numerically tractable (for a complete discussion of this procedure see Ref. [13, 14, 3]). In the scheme we use there are seven free parameters: the higgsino mass parameter , the gaugino mass parameter111The usual Grand Unification Theory (GUT) relations for gaugino masses are assumed in all the results presented, their release is not expected to give major modifications , the ratio of the vacuum expectation values of the two Higgs fields and , the mass of the pseudoscalar Higgs , the sfermion mass parameter and other two soft supersymmetry breaking parameters and . Our analysis is based on 16 scans over this parameter space. Some of them are broad samplings in the parameters, others are dedicated to more specific portions of the parameter space that are interesting for the present purpose. Table 1 contains the maximal and minimal values for each parameter; in the given intervals, or in most cases in subintervals, and are scanned logarithmically, is mostly scanned linearly and in a few scans logarithmically, while all the other parameters are varied along a linear scale. Rejecting those models that violate all known experimental bounds, we are left with a sample of about 62,500 supersymmetric models which could describe Nature. For each of these, the neutralino relic density has been computed using the exact treatment of resonances [15] and including coannihilations between neutralinos and charginos [16]. We restrict to those models which can give the neutralino as the main constituent of galactic halos, selecting the models which have a relic density that is in the interval (the upper limit is given by the condition of not overclosing the universe, or equivalently giving a too low age of the Universe). About 22,000 models in our sample fulfill this condition and this is the selected sample that is shown in the graphs in this paper.
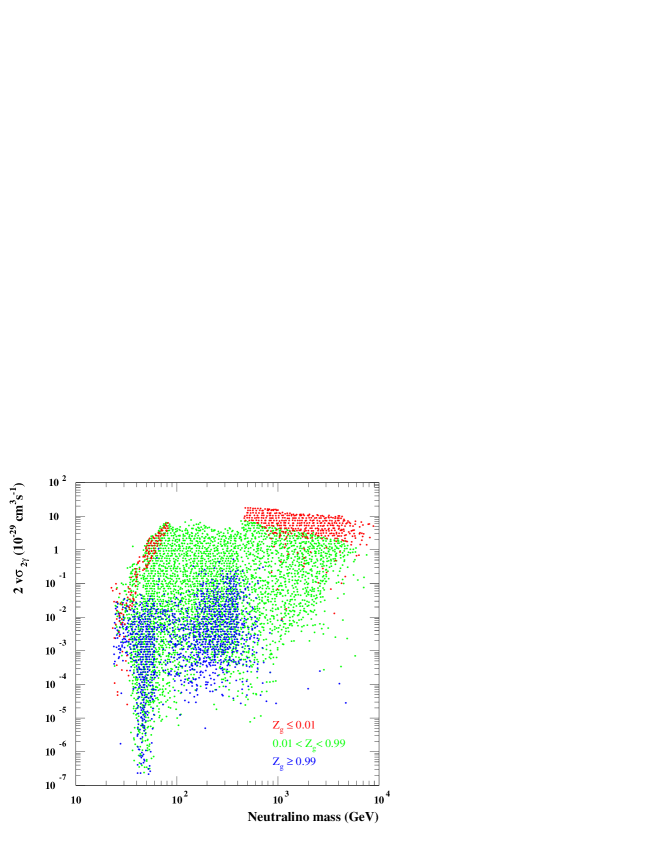
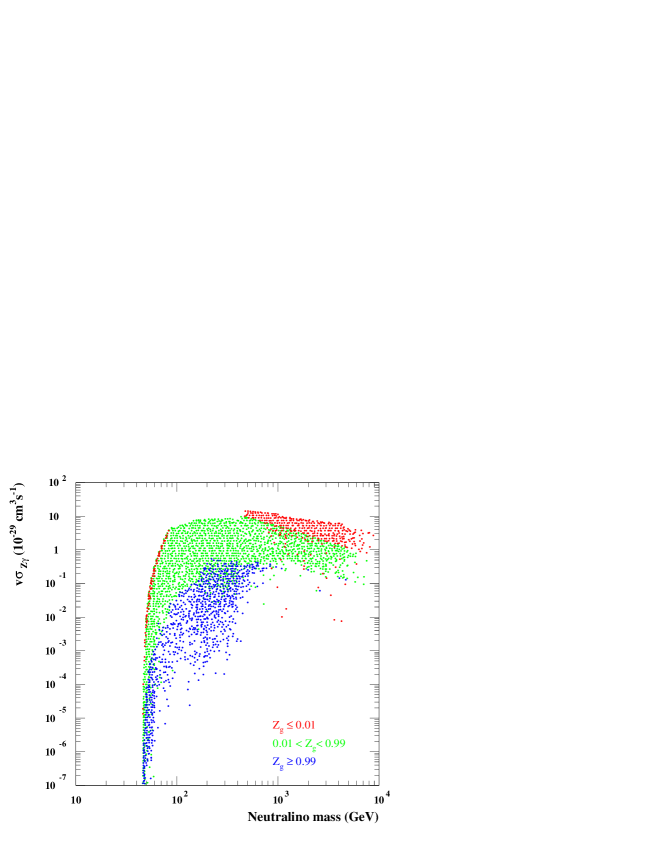
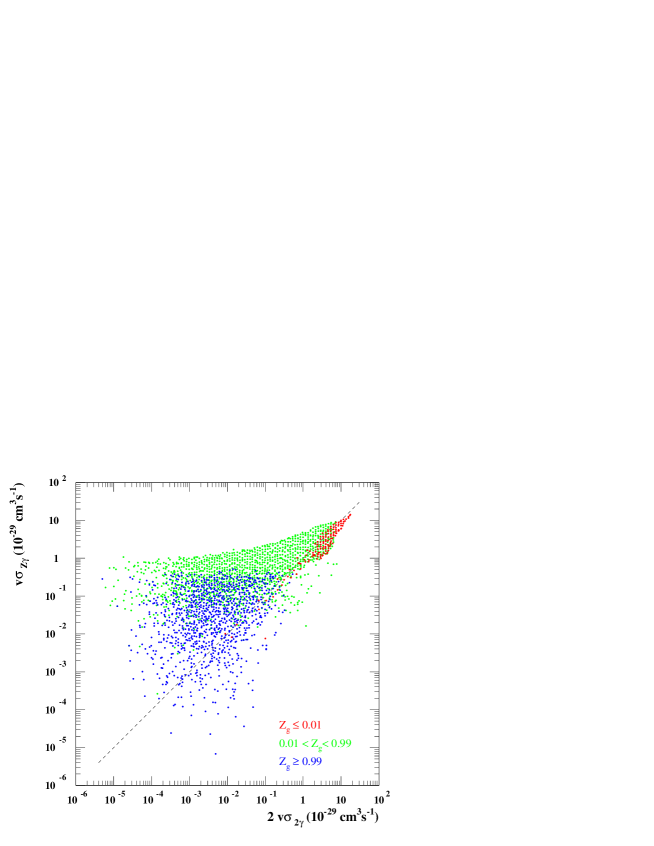
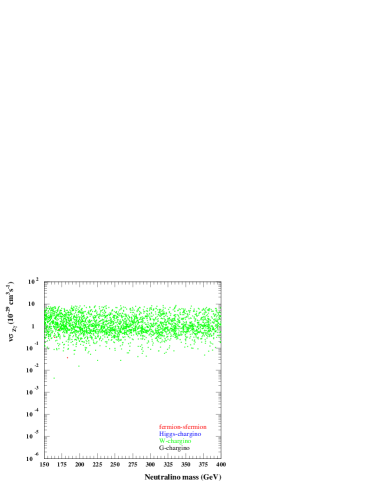
In Fig. 1 and Fig. 2 we show the predictions for the annihilation rate of neutralinos into two photons and into a photon and a boson as a function of the neutralino mass, while in Fig. 3 they are shown one versus the other. It is useful to compare and as the line flux is proportional to these quantities (the 2 comes from the fact that there are two photons in that final state). In these figures as in all those that follow, each marker represents a model in our sample, we have however arbitrarily fixed a maximal density of points which are printed (it might be worth reminding that the point density in these kind of figures is meaningless and just depends on the way the parameter space is sampled). The visual effect is the same as drawing shaded zones but in this way we avoid the problem of deciding whether or not to include isolated points or empty sub-regions.
A common feature of and is that the highest values are given by very pure higgsino-like neutralinos (we have included models with as small as ), with a mass around 500 GeV. As it was already shown in Refs. [4] and [5], the cross sections tend to a constant value of about in the limit and . The higgsino-like neutralino branch starts at very high masses, where the relic density is close to 1 (coannihilations of neutralinos with the lightest chargino are crucial to show that neutralinos with masses highier than 3 TeV can be cosmologically acceptable [16]), and continues with increasing cross sections down to about 500 GeV where approaches 0.025. This is mainly due to the large cross section for the annihilation into a W boson pair. In fact, when this process becomes kinematically forbidden (for neutralino masses below the mass of the W boson) higgsino-like neutralinos become again cosmologically interesting candidates and, together with mixed neutralinos, again give the highest cross sections in that mass region.
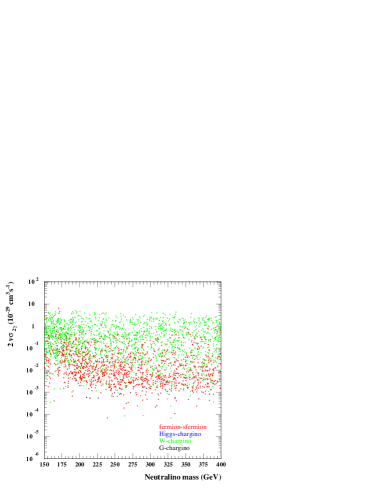
Whereas for higgsino-like neutralinos is in most cases greater than , it is generally the opposite for mixed neutralinos. For this class of neutralinos in the mass interval GeV the branching ratios into the final state is in most cases dominant over twice the branching ratio into . Another interesting feature is that over the whole mass scale the value of for mixed neutralinos is concentrated in a band not wider than two orders of magnitude, while the values of are more homogeneously distributed over 5 to 6 decades. This is visible also in Fig. 3 where the mixed neutralino band starts at about for both and and extends down to to a value of of for models that can give a as high as . We illustrate this point in Fig. 4 where we consider a scan of models with mixed neutralinos of masses in the range GeV. In these figures we have indicated which is the class of diagrams that gives the main contribution to the cross sections (all the diagrams involved in the computation are shown in Refs. [4] and [5]). In the case of almost always the W boson-chargino loop diagrams are dominant over the other diagrams. For instead, the contributions for the fermion-sfermion loop diagrams can be more frequently of the same order of magnitude as the W boson-chargino diagrams and severe cancellations can take place, with usually a small cross section when the fermion-sfermion diagrams are dominant. From Fig. 4 it is also evident that Higgs-chargino loop diagrams and Goldstone boson-chargino loop diagrams do not play a main role and this is true for all classes of neutralinos over the whole mass range.
Given the large size of our sample of scanned models, we expect the narrowness of the band for large neutralino masses to be a real effect which could increase the discovery potential of present and future ACTs. In the heavy mass range, it may be appropriate to sum the and contributions, since to resolve the two lines an energy resolution better than around 1 % would be needed.
Gaugino-like neutralinos give cross sections that rarely exceed, for both processes, a few times . In this case the cross sections are poorly correlated and the large spread in Fig. 3 is due mainly to gaugino-like neutralinos.
A final comment can be made about low mass neutralinos. Here goes to zero at the threshold as expected because this limit corresponds to having no photon in the final state and the annihilation of neutralino pairs into a Z boson is forbidden by C parity (for clarity we have excluded models with neutralino masses lower than 70 GeV from Fig. 3). In addition, has low values as well because the contribution from W boson-chargino loop diagrams becomes small (there is no contribution from the imaginary part and the real part is generally large only for heavy pure higgsino-like neutralinos).
3 Milky Way halo models
The photon flux from neutralino annihilation in the galactic halo critically depends on the neutralino distribution. Since the flux per unit volume is proportional to the neutralino density squared, any enhancement of the density would result in a sharp increase in the photon flux; such an enhancement is provided by dark matter radial halo profiles that are peaked towards the galactic center. In this section we will examine in detail this possibility and compute the full dependence of the flux on the galactic coordinates in some selected cases.
The mass distribution in the Milky Way and the relative importance of its three components, the bulge, the disk and the halo, are poorly constrained by available observational data. Although the dynamics of the satellites of the galaxy clearly indicates the presence of a non-luminous matter component, a discrimination among the different radial dark matter halo profiles proposed in the literature is not possible at the time being [17]. Our approach is to assume that dark matter profiles are of a universal functional form and to infer the Milky Way dark matter distribution from the results of N-body simulations of hierarchical clustering in cold dark matter cosmologies. The predicted profiles in these scenarios have been tested to a sample of dark matter dominated dwarf and low-surface brightness galaxies which provide the best opportunities to test the spatial distribution of dark matter. Actually this field of research is in rapid evolution and slightly discrepant results have recently been presented [8, 9, 10, 11]; we will concentrate on the Kravtsov et al. profile [10] and the Navarro et al profile [9], comparing the results with the canonical modified isothermal sphere profile which is widely used in dark matter calculations.
Among the general family of dark matter halo profiles
| (6) |
Kravtsov et al. [10] propose a coreless profile with a mild singularity towards the galactic center with ; taking into account these two extremes, we will refer to the Ka profile as to the one which is defined by , while the Kb profile is chosen as . In previous work [9], Navarro, Frenk and White had obtained a cuspy profile which has (hereafter NFW profile). Both results are not in agreement with the modified isothermal distribution, (hereafter Sp profile), extensively used in the analyses of observed rotation curves, which is non singular with a core of radius a.
There are models [18] which have a more singular behavior near the galactic center, and which would give enormously enhanced rate in that direction. However, there is observational evidence against such singularities from cluster gravitational lensing and the rotation curves of dwarf spiral galaxies [19]. On the other hand, the discrepancy between the 1/r central cusp of the NFW profile and the experimental data from the dwarf spheroidal DDO 154 has been explained in Ref. [12] assuming an additional component of dark baryons. Of course, also a moderately steeper profile like , which is found in some simulations [20] and which has some theoretical underpinning [21], may be acceptable. That would give higher estimates than the one we use for the neutralino-induced fluxes, but we choose to be more conservative.
We will consider only the case of spherical profiles; introducing a flattening parameter may enhance the value of the flux but the effect is not expected to be dramatic for this neutralino detection method and we prefer not to introduce another factor of uncertainty.
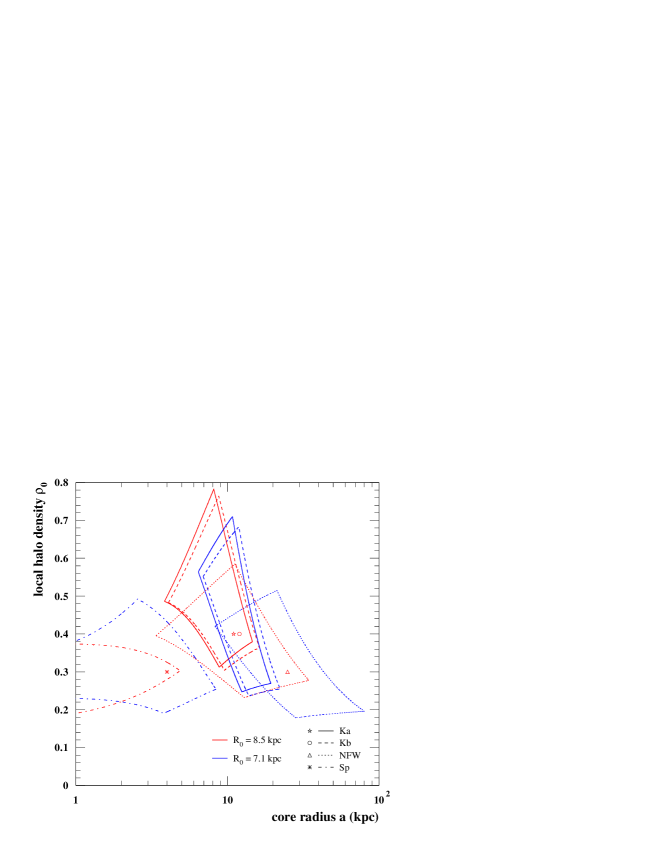
The normalization constant of the halo profile, which we choose as the value of the halo density at our galactocentric distance , the core radius and itself are the three parameters which will be relevant to give a prediction for the gamma line flux. N-body simulations indicate that there may be a correlation between normalization constant and core radius, but we are not in the position of extracting a firm numerical prediction for the Milky Way. After choosing the functional form of the halo profile, we determine the regions in the parameter space which are allowed by the assumptions that follow below.
We follow Dehnen and Binney [17] and assume that the total mass of the galaxy inside 100 kpc is . This estimate is obtained by combining the result of Kochanek [22] who used the observational constraints from the velocity distribution of the Milky Way’s satellites, the local escape velocity of stars and the Local Group timing model, and the result inferred in Ref. [23] from the dynamics of the Magellanic Clouds and Stream. Both estimates are to some extent model dependent and this is the reason for the large error bound chosen. We then suppose that, for each matter distribution model, on average ten per cent of the total mass inside 100 kpc is due to the contributions of the disk and the bulge (value obtained from Table 4 in [17]) and derive a value for the the mass of dark matter halo inside 100 kpc
| (7) |
A second constraint is given in terms of the contribution of the halo to the local rotation curves which can be determined in terms of the observed value of the local rotation velocity and from the measurements of the contribution of the disk (which is dominant over the contribution from the bulge):
| (8) |
The IAU standard values for and our galactocentric distance , based on a review by Kerr and Lynden-Bell [24] in 1986, are respectively and . The two quantities are not independent variables, their ratio is fixed by local stellar kinematic measurements of the Oort constant. In more recent estimates lower values have been obtained: Reid [25] has found , while in a very recent work Olling and Merrifield [26] has found and . Even the value of the contribution of the disk to the local rotation velocity has large uncertainties and is to some extent model dependent. The value we can infer from Kuijken and Gilmore [27], and Gould [28], who examine a data set of velocities of local stars as a function of their height over the galactic plane, is in the range . Maximum disk models can give a higher , while in thin disk models the value can be lower. We will accept the quoted value without considering disk models in detail. Combining the values of and we obtain the following ranges of values of for a given galactocentric distance :
| (9) |
| (10) |
In Fig. 5 we show, for each of the halo models considered, the regions in the plane (, ) which are compatible with the limits given in Eq. (7) and Eq. (9), (10). A common feature of all the profiles is that the allowed regions are shifted to lower values of the core radius increasing the galactocentric distance from 7.1 kpc to 8.5 kpc. Focusing for instance on the Ka profile with , the values of and which are compatible with our constraints fall in an area with a diamond-like shape, where the upper left bound and the lower right bound are given respectively by the maximum and minimum values in Eq. (9) , while the upper right and lower left are due to Eq. (7). A similar behavior is seen in all the other cases. For the Sp profile a core radius equal to zero is not excluded, but this is an extremely unrealistic case and we have decided to arbitrarily fix a lower value of .
The gamma ray flux from neutralino annihilation in the galactic halo is given by:
| (11) |
where is the angle between the direction of the galactic center and that of observation, and where for , for . Separating the dependence on the halo model from the part which is related to the the values of the cross section and the neutralino mass, we rewrite it as
| (12) | |||||
where we have defined the dimensionless function
| (13) |
Picking in Fig. 5, for the four halo models, a couple of values (, ) which gives rather conservative results and choosing , we show in Fig. 6 in each case the angular dependence of the function . The profiles have been considered valid up to the capture radius of the black hole at the galactic center which is about for a mass of Sgr A∗ . Modifications to Eq. (13) due presence of the black hole are in detail in the subsection below.
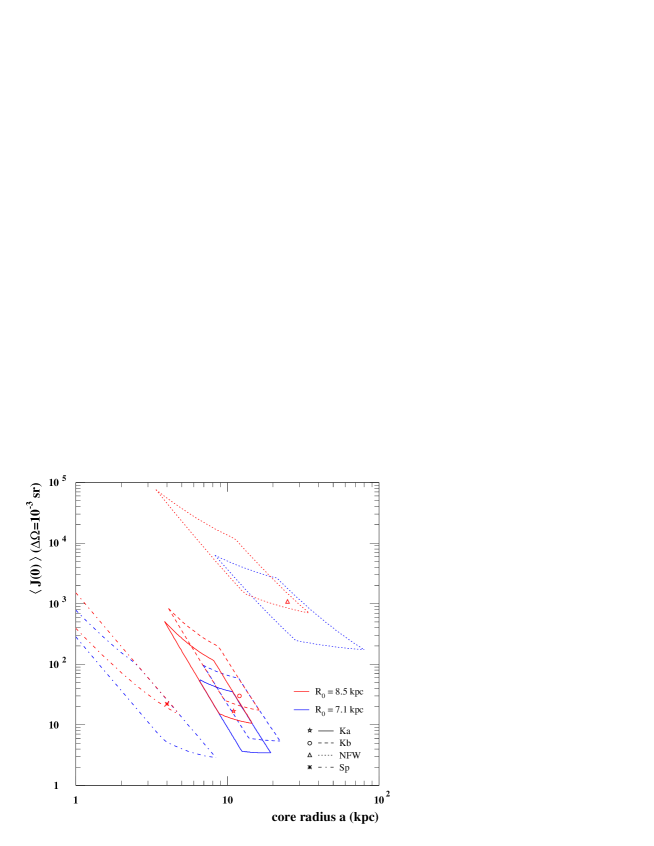
The maximum flux will be clearly in the direction of the galactic center. The relevant quantity for a measurement is, rather than , the integral of over the solid angle given by the angular acceptance of a detector which is pointing towards the galactic center. We consider therefore the function
| (14) |
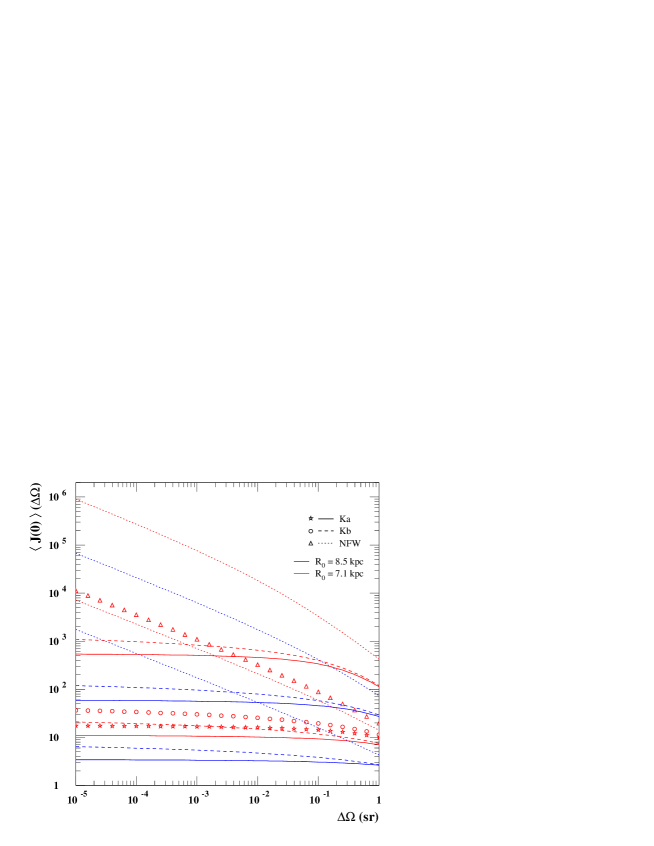
where is the angular acceptance of the detector. Fixing for an ACT detector a typical value of , in Fig. 7 we plot versus the core radius for the allowed regions in Fig. 5 and for both choices of the galactocentric distance. As can be seen the NFW profile can give very high values of compared to the other halo models. In Fig. 8 we plot instead as a function of for the conservative halo models shown in Fig. 6 together with the models corresponding to the maximum and minimum core radius allowed in Fig. 5 for each profile.
3.1 Effects of a central black hole
A small complication occurs when we try to compute the line-of-sight integral directly towards the galactic center. There are strong indications that a black hole of mass resides near the center of the Milky Way. The interplay between this black hole and the dark matter halo is difficult to model - certainly it is beyond the scope of this paper. One effect of the black hole, however, is to gravitationally lens rays that originate from behind the galactic center, in a cone of angular size on the order of that of the Einstein ring. This is given by (see, e.g., [29])
| (15) |
where is Newton’s constant, the mass of the black hole, , , are the lens-to-source, lens and source distances, respectively.
In general, for a point source, a double image is produced which usually cannot be resolved (the situation is similar to that of microlensing of MACHOs in the halo). The resulting magnification may, however, be detectable and is given by
| (16) |
where , with the undeflected angle to the source. Since gravitational lensing is a purely geometrical effect, it is of course also operative for rays. Returning to our line-of-sight integral Eq. (13), we can now for angles less than the Einstein angle (with around 1 arcsec for and kpc) split the integral into two parts, from to the distance of the galactic center and from to the end of the halo. The second part contains the amplification factor , thus for small angles we replace by where
| (17) | |||||
In Fig. 6 this expression has been used for the smallest angles displayed. As can be seen, it causes a mild enhancement for the most non-singular halo models and cannot compensate the turnoff of the rise of the profile due to the black hole itself.
4 Present and Planned ACT Detectors
The present high energy gamma-ray experiments, the Energetic Gamma-Ray Experiment Telescope (EGRET) and the Whipple 10m atmospheric Cherenkov Telescope (e.g. [30]), lack the sensitivity to detect the annihilation lines fluxes predicted for most of the allowed supersymmetric models and halo profiles. Our aim is to show that the order of magnitude improvement in the flux sensitivity and the substantial improvements in angular resolution in the next generation of both ground based and satellite gamma-ray experiments, will allow to explore large portions of the MSSM parameter space searching for the annihilation-line flux, if a halo model which provides an increase of the dark matter density towards the galactic center is considered.
In this section we focus on Atmospheric Cherenkov Telescopes (ACTs), such as an upgraded version of the Whipple detector currently under construction (GRANITE-III) as well as proposed arrays of ground-based atmospheric Cherenkov detectors VERITAS [31] and HESS [33]. We will consider in Section 6 the potentiality of the proposed Gamma-Ray Large Area Space Telescope (GLAST) experiment. Ground based and satellite experiments are to some extent complementary for our purpose. While satellite experiments offer a lower energy threshold, superior energy resolution, and the possibility of relatively long exposure times, the relatively small effective area m2 limits the sensitivity at high energies. On the other hand ACTs offer the potential for very large effective areas 0.3 km2, but at a higher energy threshold ( 250 GeV).
We summarise in Table 2 the approximate characteristics for existing and proposed ACT gamma-ray observatories.
| Whipple | GRANITE-III | VERITAS or HESS | |
| Effective Area (cm2) | 3.5 | 5 | 7 |
| Energy Resolution () | 30% | 20%a | 15%b |
| Angular Resolution () | 0.14 | 0.1c | 0.07d |
| Energy Threshold | 250 GeV | 150 GeV | 50 GeV |
| Field of View (sr) | 0.001 | 0.004 | 0.004 |
| a Estimated from Ref. [32]. | |||
| b Resolution at 100 GeV [33]. | |||
| c Estimated from CAT observations of the CRAB nebula [34]. | |||
| d Angular resolution at 300 GeV from simulations of a 4 telescope array [33]. | |||
| † Average quantities estimated for the energy ranges: 300 GeV for Whipple; | |||
| GeV for GRANITE-III; GeV for VERITAS or HESS | |||
For the observation of the galactic centre which is treated as a point source, we compute the minimum detectable flux using the prescription that, for an exposure of seconds made with an instrument of effective area and angular resolution (corresponding to a 68% acceptance of events) with corresponding angular acceptance , the conditions for detection are that the significance of the detection exceed 5 and that the number of detected photons exceeds 25 events:
| (18) |
| (19) |
Here, is the integral number of background events (per unit solid angle) falling under the annihilation line. If the dominant source of background has a differential spectrum , and if the energy resolution of the instrument is , then the background under a line at energy (i.e., in the interval containing 68% of the signal) is given by
| (20) |
where
| (21) |
gives the the background reduction relative to the integral background spectrum (e.g., for an energy resolution of 10%).
Atmospheric Cherenkov detectors employ large (10 m) optical reflectors to image flashes of Cherenkov light from electromagnetic showers formed as high energy -rays interact in the earth’s atmosphere. The Cherenkov light pool from a -ray (at normal incidence) covers an area of roughly 5 cm2 on the ground, and defines the sensitive area of the detector. By making use of the distinctive differences in the shower images, a -ray signal can be extracted from the large isotropic background of hadronic showers (e.g. [35]). The point of origin of each shower can also be uniquely reconstructed from the orientation and shape of the shower image to a precision of 0.14∘ for a single telescope (e.g. [36]), or roughly a factor of better when telescopes provide stereoscopic views of the same shower image. The total level of detected Cherenkov light is roughly proportional to the energy of the primary gamma-ray shower and provides an energy resolution typically of 20–40%. A further improvement in this energy resolution may be realized with stereoscopic measurements which determine the height of the maximum shower development. Typically observations are made in a differential mode where each observation on-source is followed by an observation of equal duration displaced in right ascension from the source direction, so that the control observations sample the same range of azimuth and elevation angles. The number of candidate gamma-ray events is taken to be the difference between the number of events passing the data-selection criteria on-source and in the control observations. Using this technique one can determine the two-dimensional distribution of gamma-ray events on the sky, and can reconstruct the energy spectrum of these events assuming that the control region does not contain a significant contribution from diffuse gamma-rays or from a number of point sources.
The energy threshold of atmospheric Cherenkov detectors is determined by the condition that the Cherenkov light signal must exceed the level of fluctuations in the night sky background light. Since both the signal and the background light level are proportional to the mirror area , the signal to noise ratio depends on and the energy threshold is inversely proportional to this quantity. Since the duration of the Cherenkov pulses is very small (on the order of a few nsec), an additional reduction in the energy threshold can be realized by decreasing the signal integration time. For the largest imaging telescope (the Whipple 10m reflector) the energy threshold is approximately 250 GeV. The use of arrays of telescopes operated in coincidence will result in a larger effective mirror area which when combined with the use of faster electronics and higher resolution cameras will result in a reduction in the energy threshold to perhaps 50 GeV for an array of 10m telescope.
Arrays of telescopes also offer the potential for increasing the effective area and improving the background rejection. widely spaced telescopes operated independently result in an increase in the effective area by . As the telescopes are moved closer together, the effective area is reduced but the hadronic rejection can be dramatically improved through better characterization of the shower development with stereoscopic imaging. For the VERITAS (HESS) arrays, 9 (16) 10 m telescopes will be used in a configuration where each gamma-ray event within the sensitive area will result in good shower images in four of the telescopes in the array. In such a mode of operation, we estimate a total effective area of cm2 and an additional hadronic rejection by a factor of through improvements in angular resolution and by another factor of through better characterization of the shape of the gamma-ray shower (e.g. Ref. [33]).
The sensitivity of atmospheric Cherenkov detectors is determined by a relatively large background of misidentified gamma-like hadronic showers and from cosmic ray electrons, which dominate at lower energies. The contribution of the diffuse gamma-ray background is included in the sensitivity calculation, but has a relatively steep spectrum and does not contribute significantly to the background for atmospheric Cherenkov telescopes. Even if the diffuse spectrum of the inner galaxy is significantly harder than the cosmic-ray spectrum [37], this conclusion is unchanged.
From data taken with the Whipple 10 m telescope, the measured event rates (after rejection of background) and the effective angular aperture and effective area (determined from Monte Carlo simulations) can be combined to derive the background rate for gamma-like hadronic showers:
| (22) |
The factor of is introduced to account for improved hadronic rejection in a future detector compared with the current Whipple detector. As the energy threshold is reduced, the relative efficiency of hadronic showers for producing Cherenkov light is reduced with respect to gamma-ray showers. While this effect would improve the sensitivity at low energies, the background rejection from the image analysis generally deteriorates. For simplicity we have neglected these effects.
The showers initiated by cosmic-ray electrons are indistinguishable from gamma-rays, and these events can only be rejected on the basis of their arrival directions. Cosmic-ray electrons have a steeper spectrum than that of cosmic ray nuclei and become the dominant background at lower energies. From Ref. [38] the integral spectrum for electrons is
| (23) |
(at , the electron flux is a factor of 5 below the hadronic background.)
Combining the hadron and electron background and taking into account the small contribution due to the diffuse gamma ray background, the total background under the annihilation line at , is
| (24) | |||||
This can be used together with Eqs. 18 and 19 to derive the flux sensitivity curves of the Whipple atmospheric Cherenkov detector as well as the other proposed detectors, as shown in Figs. 9 and 10.
The Whipple detector is located in the northern hemisphere, and the most likely sites for the VERITAS and HESS arrays are also in the northern hemisphere (although a southern hemisphere site for the HESS array is being considered). Since the galactic center is a southern source, it transits at large zenith angles for a northern hemisphere observatory (e.g., around 61∘ at the Whipple site). For such observations at large zenith angles, the point of maximum shower development is more distant than it would be for showers with normal incidence, and the Cherenkov light pool spreads out over a larger area. This has the advantage of increasing the effective area but the disadvantage of raising the energy threshold. For observations of the galactic center at the Whipple site, this results in an increase in the energy threshold and effective area by roughly a factor of 5 [39]. For this reason we do not consider here the CAT telescope which is located at a latitude of N [34] or the HEGRA array [40] which will eventually achieve an energy threshold of 500 GeV at the zenith but a threshold of 2.5 TeV for the galactic center, since in both cases their energy thresholds are too high to be sensitive to the majority of parameter space. The 3.8m CANGAROO telescope in the southern hemisphere [41] has an energy threshold of approximately 1 TeV and will also not probe much of the predicted parameter space. However, the CANGAROO collaboration is currently constructing a 10 m telescope which may eventually be part of an array of telescopes. This would prove to be one of the most important instruments for galactic center observations. Since the details of this proposal are not well established, we consider here a generic “southern array” which has roughly the characteristics of VERITAS. Since a source spends the majority of its time near transit, for such a southern array we do not include the effect of large zenith angle observations on increasing the effective area.
5 Prospectives for the Detection of the Monocromatic Line with an ACT
As we have already pointed out, the detection prospectives for the monocromatic ray line from neutralino annihilation in the galactic halo critically depend on the profile which describes the dark matter distribution. This is in particular evident for detectors like ACTs which have a small angular acceptance. If a large fraction of the total flux emitted is concentrated in a tiny region of the sky, the galactic center, whose coordinates are known with sufficient accuracy, an ACT can be the ideal instrument for detecting neutralino dark matter. This is true for singular halo profiles. We will show that with the NFW profile, which is not the most singular profile among those that are currently being studied, a signal might be seen already in the next generation of ACT detectors.
In Fig. 9 (a) and (b) we show the results of the and line fluxes for the supersymmetric models considered in Section 2 and for the NFW profile which gives the maximal value of in Fig. 8. We have chosen such a small solid angle, which corresponds to the minimal angular acceptance for the observation of a point source for an ACT, because for a singular halo profile the ratio signal to square root of the background increases going to smaller angular acceptances. In the figures we draw also the sensitivity curves for each of the ACT detectors considered in preavious section. As can be seen, a significant number of supersymmetric models could give a signal which exceeds the sensitivity of the Southern Array and the VERITAS or HESS detector. The detector in the southern emisphere, having a low threshold (around 50 GeV), explores a region of the MSSM parameter space which may be accessible to other detection methods, in particular to future accelerator experiments. VERITAS or HESS have a higher sensitivity for heavier neutralino masses, in an interval which will be hardly accessible to direct or other indirect detection methods.
As the energy resolution of the typical ACT is not better than around 10%, in the high mass rage the two monochcromatic and lines, respectively at the energy and , are not resolvable. In Fig. 10 we sum the contributions to the flux from the two annihilation processes. As we have pointed out in Section 2, a very interesting feature is that due to annihilation line, the values for the predicted flux are concentrated in a quite narrow band and this clearly enhances the possibility of a discovery.
6 The GLAST satellite detector
In the existing EGRET, and the planned GLAST satellite experiment, high energy gamma-rays interact to form an electron positron pair in a distributed converter/tracker layer. The measured direction of electron and positron in the pair (which improves with increasing energy) and the subsequent electromagnetic cascade in the calorimeter layer give the arrival direction and energy of each gamma-ray. An anticoincidence shield effectively rejects background cosmic-ray nuclei and electrons, and the sensitivity of these detectors is limited only by counting statistics and by the diffuse gamma-ray background.
For an energy resolution of 4%, an angular resolution of 0.1∘ (at GeV) it is clear that the limit given in Eqs. (18) and (19) applies for the point source sensitivity, and that such observations are counting-statistics limited. Given this fact it is advantageous to change the observing strategy and to relax the angular acceptance window in order that the number of collected gamma-rays is increased above the threshold for detection (around 10 events).
The estimate of the diffuse gamma ray background is then crucial to give a prediction for a signal in a satellite based experiment (for ground-based experiments the background from misidentified protons is generally higher). The diffuse emission of gamma rays in the galaxy is thought to be due mainly to cosmic-ray protons and electrons interacting with the interstellar medium, and has an overall enhancement towards the inner galaxy and the galactic disk. Given that the galaxy is essentially transparent to gamma rays up to energies of about 100 TeV, it is possible to derive the gamma ray spectrum in the energy region of our interest from interstellar mass models of the galaxy [42, 43, 44]. This is however beyond the scope of the paper, we will limit ourselves to an order of magnitude estimate which can be obtained extrapolating from existing data at lower energies.
The EGRET experiment has mapped the diffuse gamma ray emission up to about 10 GeV. We assume a power law fall-off in energy in the form:
| (25) |
where we have supposed that the normalization factor depends only on the interstellar matter distribution and is a function of the galactic coordinates only. has been fixed using the EGRET data at 1 GeV published in Ref. [37], in the simple functional form
| (26) | |||||
where the longitude is assumed to vary in the intervall and the latitude in . The parametrization is in resonable agreement with the data at least in the region towards the galactic centre, in which we will use it. The slope parameter may in principle depend on both energy and the galactic coordinates. We will, however, adopt in lack of data for the energies of interest to us.
6.1 Acceptance and energy resolution
The proposed GLAST satellite detector will have a much smaller area (around 1 ) than an ACT. However, the solid angle coverage will be of the order of one steradian and the energy resolution will be excellent, at the per cent level for gamma rays that enter on the side of the detector and thus pass many radiation lengths of the electromagnetic calorimeter.
As an example [45], the sensitivity of one version of the GLAST calorimeter, consisting of 25 towers (each 32 by 32 cm2) of 10 radition lengths of CsI, has been simulated using the GEANT program. The geometric acceptance of the instrument was calculated for all gamma rays which fulfil that a cylinder around the electromagnetic shower of more than 18 radiation lengths and a radius of at least two Moliere radii is fully contained within the instrument, giving an energy resolution of better than 1.5% for gamma rays with energies higher than 50 GeV. It was assumed that the diffuse gamma rays enter the instrument from any direction in the upper hemisphere. (as the lower hemisphere will be completely screened by the Earth). This results in a geometric acceptance of 2.1 m2sr.
Taking into account the screening by the Earth of the galactic center region half of the orbiting time, the useful geometric acceptance in a 1 sr cone towards the galactic center is 0.18 m2sr. This is the geometric acceptance both for a monoenergetic neutralino annihilation signal from a region around the center of the galaxy as well as the diffuse gamma ray background, since background photons arriving from other directions can be discriminated by the direction of incidence.
A similar analysis has to our knowledge not been performed for the alternative design SIFTER, but it appears that there the somewhat larger effective area for a given weight of the detector can give a similar improvement of the ray line discovery potential [46].
We display in Fig. 11 (a) and (b) the results of the and line flux from Section 2 using the GLAST parameters just discussed, and assuming a two-year exposure. Also shown is the curve giving the minimum number of events needed to observe an effect at the level, using Eq. ( 25) for the galactic diffuse -ray background flux. The NFW halo model corresponding to the maximal rate was assumed for the halo.
As can be seen, a fair fraction of our set of MSSM points can be probed under these circumstances. An advantage with a detector of large acceptance is that “clumps” of dark matter of relatively small angular size could still be detected. Since the annihilation flux is proportional to the square of the dark matter density, such enhancements would appear as bright spots on the ray sky, without optical counterpart. Another advantage with a satellite experiment is the excellent energy resolution possible, which may enable a separation of the two lines from and respectively. If both lines were to be observed, a comparison of line strengths would give interesting information on the supersymmetric model.
If the relative energy resolution is , the two lines are separable provided that
| (27) |
which for gives GeV.
7 Continuum Gamma Rays
Besides the gamma ray line coming from the and final states, there may also be produced a continuum spectrum mainly from decaying mesons created in the fragmentation of quarks [47, 48, 49]. The general drawback of the continuum spectrum is that in contrast to the lines it lacks distinctive features which can exclude other more mundane sources of production if a signal is believed to be found. On the other hand, the number of photons from this continuum source can be much higher than from the line processes.
In fact, should a ray line be found, by necessity there has to be a continuum signal also, although in some cases severely affected by the galactic diffuse background. We therefore investigate what can be expected for the higgsino-like high-mass sample, since previous treatments were mainly done for low-mass neutralinos.
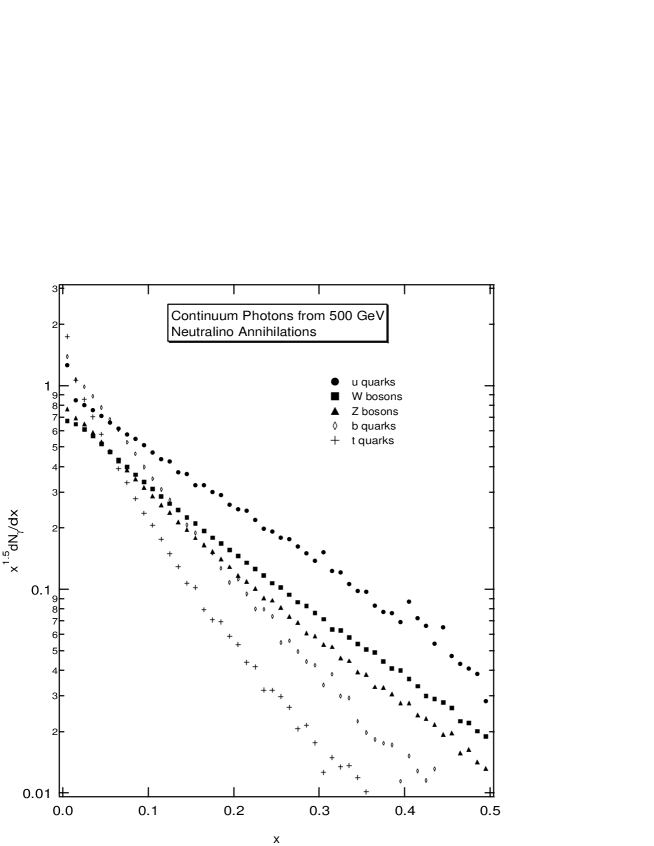
For our high-mass sample, the main annihilation mode is into a or pair. We have simulated the continuum photon spectrum from these and final states through the PYTHIA 6.113 Monte Carlo code [50]. Introducing the scaling variable , we find empirically that the quantity is well described by an exponential in the variable , as shown in Fig. 12 for GeV.
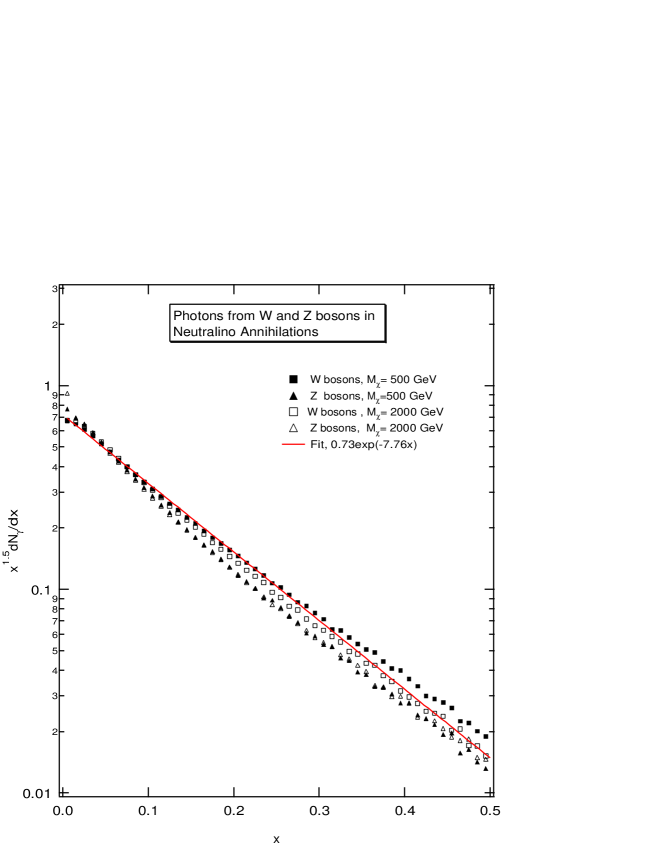
As can be seen, and quarks give a quite soft spectrum. Since quarks (as well as and quarks) have a very small branching ratio for these high mass neutralinos, the dominant source of photons above will be and . Both of these final states show a very simple scaling behavior when increasing the energy (i.e. the neutralino mass). This is clearly shown in Fig. 13, where photons from both and at of both 500 and 2000 GeV can be described to the level of accuracy required for our purpose by the distribution
| (28) |
The models in our sample with GeV with the highest rate of and production have a rate given approximately by
| (29) |
The observed differential flux at the Earth is then given by
| (30) | |||||
where is defined in Eq. (13).
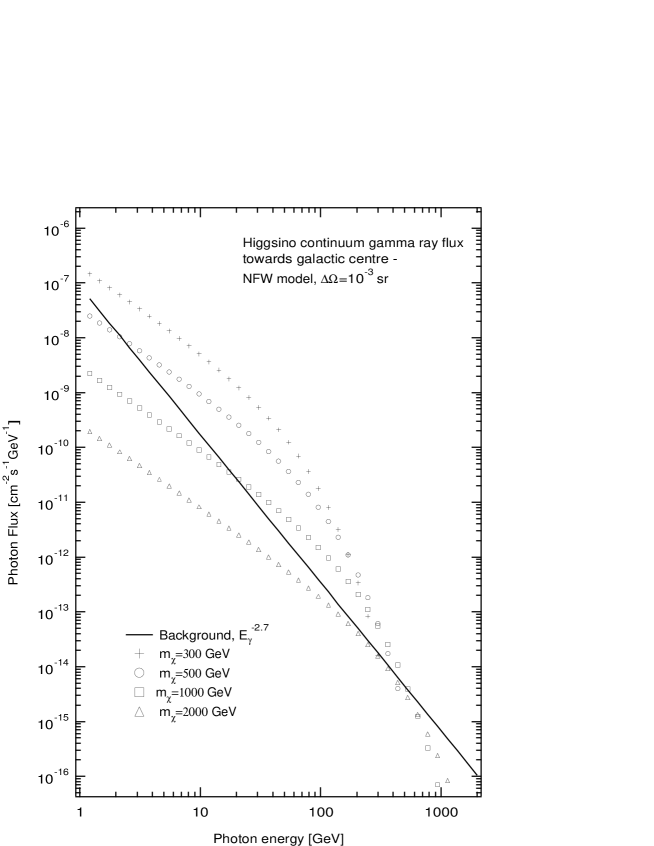
Using the NFW halo profile which gives the highest rate, and integrating over sr towards the galactic center, this gives the results shown in Fig. 14 for and GeV. The galactic background curve is the estimate Eq. ( 25), which for gives
| (31) |
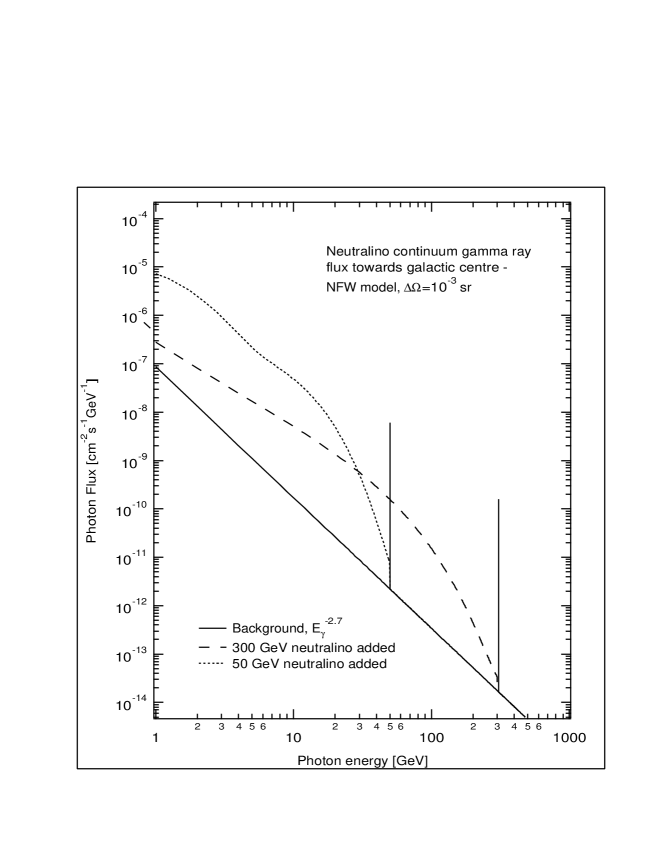
We see that below a mass of 1000 GeV, this additional component of the photon spectrum is larger than the estimated background over some energy range, and could thus be observable, see Fig. 15, where also the results for a 50 GeV neutralino (annihilating mainly to ) pairs are shown, using the parametrisation of [47] of the spectrum from quarks. As can be seen, at least the 50 GeV candidate would appear to be excluded already by EGRET data, were it not for the uncertainties related to the halo parameters. The combined features of a break in the spectrum and an angular distribution that does not follow that of the disk and bulge of the galaxy could make this type of signal distinguishable from the background, although it may be difficult to exclude other sources of rays giving similar features. In fact, present EGRET observations are not inconsistent with a continuum spectrum originating from dark matter annihilations, but other explanations are possible as well [51].
It is interesting to note in Fig. 15 that a 300 GeV higgsino would cause a flatter spectrum than the “canonical” in the 1 - 100 GeV range. It is intriguing that a flatter spectrum is indeed observed towards the galactic centre, something which has turned out difficult to reproduce in conventional models [52]. Before detection of a line signal it will, however, not be possible to rule out other sources of high energy rays. In any case, the hitherto unexplored energy band between 100 and 300 GeV will be of crucial importance to verify or rule out a supersymmetric component of the ray spectrum.
The higher-mass neutralinos (above 1 TeV) do not give as useful a continuum signal because of the rapid decrease with of the signal (see Eq. (30)), whereas the line remains a viable signature up to that region.
8 Discussion
To conclude, we have shown that the new high energy cosmic -ray detectors, both ground- and space-based will have an interesting opportunity to search for signals of dark matter paticle annihilations in the Milky Way halo. Indeed, existing data from EGRET may already rule out some of the low-mass MSSM models if the halo is of the most singular form studied here.
Even neutralinos as heavy as several hundred GeV could give continuum s with an observable flatter spectrum than the expected in the simplest models of diffuse galactic rays, in the direction towards the galactic center. The absence of a clear signature may, however, make an eventual claim of detection of a supersymmetric signal difficult to defend.
The only reliable -ray signals indicating directly the existence of slowly moving, heavy neutral particles in the Milky Way halo seem to be the -ray lines produced by and annihilations. These lines, of intrinsic relative width of the order of , have no plausible astrophysical background whatsoever and would constitute a “smoking gun” of supersymmetric dark matter.
As we have shown, the larger rates for the line processes found in the recent first full one-loop calculations in the MSSM, together with the central enhancement indicated in simulations of cold dark matter halos, make these processes accessible to the next generation of -ray detectors over a fair range of parameters. In particular, if the neutralino is the lightest supersymmetric particle and is heavier than around 1 TeV, detection of the line may well be the only way to discover supersymmetry in the foreseeable future, as all other methods (accelerator, direct detection and indirect neutrino detection) are discouragingly far from the required sensitivity.
Acknowledgments We are grateful to J. Edsö and P. Gondolo for collaboration on the numerical programs used. This work was supported with computing resources by the Swedish Council for High Performance Computing (HPDR) and Parallelldatorcentrum (PDC), Royal Institute of Technology, Stockholm. We thank J. Edsjö for very valuable help with supercomputer runs. L.B. wishes to thank the Swedish Natural Science Research Council (NFR) for support. We are grateful to P. Carlson and T. Francke for helpful discussions on the GLAST calorimeter, and G. Pendelton for information on SIFTER.
References
- [1] See, e.g., K.A. Olive, astro-ph/9712160, to appear in Proc. TAUP97, Nucl. Phys. Suppl., A. Bottino, A. di Credico and P. Monacelli (eds.), in press.
- [2] For a recent review, see, e.g., L. Bergström, astro-ph/9712179, to appear in Proc. TAUP97, Nucl. Phys. Suppl., A. Bottino, A. di Credico and P. Monacelli (eds.), in press.
- [3] G. Jungman, M. Kamionkowski and K. Griest, Phys. Rep. 267 (1996) 195.
- [4] L. Bergström and P. Ullio, Nucl. Phys. B504 (1997) 27; see also Z. Bern, P. Gondolo and M. Perelstein, Phys. Lett. B411 (1997) 86.
- [5] P. Ullio and L. Bergström, Phys. Rev. D, in press.
- [6] J. Silk, K.A. Olive and M. Srednicki, Phys. Rev. Lett. 55 (1985) 257; T.K. Gaisser, G. Steigman and S. Tilav, Phys.Rev. D34 (1986) 2206; S. Ritz and D. Seckel, Nucl.Phys. B304 (1988) 877; G.F. Giudice and E. Roulet, Nucl.Phys. B316 (1989) 429; G. Jungman and M. Kamionkowski, Phys.Rev. D51 (1995) 328; L. Bergström, J. Edsjö and P. Gondolo, Phys.Rev. D55 (1997) 1765.
- [7] L. Bergström and H. Snellman, Phys. Rev. D37 (1988) 3737; S. Rudaz, Phys.Rev. D39 (1989) 3549; G.F. Giudice and K. Griest, Phys.Rev. D40 (1989) 2549; A. Bouquet, P. Salati and J. Silk, Phys.Rev. D40 (1989) 3168; F. Stecker and A. Tylka, Astrophys. J. 336 (1989) L51; V. Berezinsky, A. Bottino and V. de Alfaro, Phys.Lett. B274 (1992) 122; M. Urban et al.,Phys.Lett. B293 (1992) 149; L. Bergström and J. Kaplan, Astropart.Phys. 2 (1994) 261; G. Jungman and M. Kamionkowski, Phys.Rev. D51 (1995) 3121.
- [8] R. Carlberg, Astrophys. J. 433 (1994) 468.
- [9] J.F. Navarro, C.S. Frenk and S.D.M. White, Astrophys. J. 462 (1996) 563.
- [10] A. V. Kravtsov et al., astro-ph/9708176 (1997).
- [11] B. Moore et al., astro-ph/9709051, Astrophys. J. Lett., submitted.
- [12] A. Burkert and J. Silk, astro-ph/9707343 (1997).
- [13] L. Bergström and P. Gondolo, Astropart. Phys. 5 (1996) 183.
- [14] J. Edsjö, Aspects of Neutrino Detection of Neutralino Dark Matter (Uppsala University thesis, Uppsala, 1997), hep-ph/9704384.
- [15] P. Gondolo and G. Gelmini, Nucl. Phys. B360 (1991) 145.
- [16] J. Edsjö and P. Gondolo, Phys. Rev. D56 (1997) 1879.
- [17] W. Dehnen and J. Binney, astro-ph/9612059 (1997).
- [18] V.S. Berezinsky, A.V. Gurevich and K.P. Zybin, Phys. Lett. B294 (1992) 221.
- [19] R.A. Flores and J.R. Primack, Astrophys. J. 427 (1994) L1.
- [20] T. Fukushige and J. Makino, Astrophys. J. 487 (1997) L9.
- [21] N.W. Evans and J.L. Collett, astro-ph/9702085.
- [22] C.S. Kochanek, Astrophys. J. 457 (1996) 228.
- [23] D.N.C. Lin, B.F. Jones and A.R. Klemola, Astrophys. J. 439 (1995) 652.
- [24] F.J. Kerr and D. Lynden-Bell, MNRAS 221 (1986) 1023.
- [25] M.J. Reid, ARA&A 31 (1993) 345.
- [26] R.P. Olling and M.R. Merrifield, aspro-ph/9711157, to appear in proceedings of the Workshop on Galactic Halos, Santa Cruz, August 1997 (ASP conference Series).
- [27] K. Kuijken and G. Gilmore Astrophys. J. 367 (1991) L9.
- [28] A. Gould, MNRAS 244 (1990) 25.
- [29] P. Schneider, J. Ehlers and E.E. Falco, Gravitational Lenses, Springer-Verlag, Berlin, 1992.
- [30] M.F. Cawley et al., Exper. Astr. 1 (1990) 173.
- [31] T.C. Weekes et al., in Proc. of the 25th ICRC, 5,(1997) 173.
- [32] P. Goret et al., astro-ph/9710260.
- [33] F.A. Aharonian, W. Hofmann, A.K. Konopelko and H.J. Völk, Astroparticle Physics 6 (1997) 343.
- [34] A.Barrau et al. 1997, astro-ph/9705249.
- [35] P.T. Reynolds, C.W. Akerlof and M.F. Cawley, ApJ 404 (1993) 206.
- [36] J.H. Buckley et al., A&A 329 (1998) 63.
- [37] S.D. Hunter et al., Ap. J. 481 (1997) 205.
- [38] M.S. Longair, High Energy Astrophysics, Cambridge U. Press, Cambridge (1992).
- [39] F. Krennrich, ApJ 481 (1997) 758.
- [40] N.Bulian et al. 1997, astro-ph/9712063.
- [41] T. Kifune et al., in Proc. of the 4th Compton Symposium, Williamsburg (1997), in press, astro-ph/9707001.
- [42] D.L. Bertsch et al., Ap. J. 416 (1993) 587.
- [43] I.V. Mosalenko and A.W. Strong, Ap. J. 493 (1998) in press.
- [44] P. Chardonnet et al, Ap. J. 454 (1995) 774.
- [45] L. Bergström, P. Carlson and T. Francke, unpublished.
- [46] G. Pendelton, private communication.
- [47] H.-U. Bengtsson, P. Salati and J. Silk, Nucl Phys. B346 (1990) 129.
- [48] V. Berezinsky, A. Bottino and G. Mignola, Phys. Lett. B325 (1994) 136.
- [49] P. Chardonnet et al., Astrophys. J. 454 (1995) 774.
- [50] T. Sjöstrand, Comp. Phys. Comm. 82 (1994) 74.
- [51] D. Dixon et al., as quoted in press release, http://tigre.ucr.edu/halo/halo.html.
- [52] M.Mori, Astrophys. J. 478 (1997) 214.


In addition, the maximal line strength found in our sample is displayed for these two masses, assuming a relative line width of .