Identification of molecular complexes in M 81
Abstract
We report about high spatial resolution observations made with the IRAM Plateau de Bure interferometer of the 12CO() emission from a kpc plane-of-sky field on a spiral arm of Messier 81. With a beam of 90 pc, we identify 6 giant molecular cloud complexes with virial masses of M⊙, including one associated with a giant HII region. The deduced )/ ratios are about 3 times larger on average than those measured near the solar neighborhood, suggesting that the complexes are not self-gravitationally bound except, possibly, for the complex associated with the giant HII region; they could be the average of several clouds of mass a few 105 M⊙ and diameter 100 pc. The linewidths are very narrow with respect to the measured sizes, so that the size-linewidth relation for M 81 clouds is very different from that in the Milky Way. The narrow linewidths imply smaller virial masses than for Galactic complexes of the same size, and this is consistent with the weaker CO emission from the GMCs in M 81. The low velocity dispersion suggests a lower mean volume density in the cloud and, possibly, a smaller scale height of the molecular gas than in Galactic clouds of the same size. Comparison of the interferometer and single-dish line profiles indicates that, at most, 30% of the single-dish emission in this field is from a widespread distribution of small clouds, and thus the population of molecular clouds is rather different from that in the Milky Way.
The H2 surface density in M 81 is low: although the region studied here is one of the richer molecular regions in the disk, the molecular surface density is much smaller than the interarm regions of M 51 for example. The HI gas dominates and can explain most of the extinction seen at optical wavelengths in this field. In some other fields, the HI gas cannot explain the observed extinction, but previous lower resolution observations detected little or no CO there. The present high resolution observations imply that the molecular medium in M 81 differs from that in the Milky Way.
Key Words.:
Interstellar medium: clouds - Galaxies: individual: M 811 Introduction
To understand the star formation activity at both large and small scales, one must know the distribution of the atomic and molecular gas on both scales. The importance of molecular clouds as star cradles and the easier study of rich molecular galaxies like M 51, made low CO emitting galaxies, like M 81, puzzling – as long as one relies on CO as a molecular gas mass indicator. However Sauty et al. (sauty (1997)) recently showed that a typical Sa to Sc spiral galaxy has three to four times less molecular gas than atomic hydrogen. This result is different from the study of Young & Knezek (young (1989)) who find a higher H2/HI ratio in earlier type galaxies compared to late types. The discrepancy may be due to the selection’s criteria as the galaxies in the sample of Young & Knezek are mostly FIR and optically bright objects and thus more probably CO-bright objects.
In M 81 the 12CO() emission has been mapped from the nucleus out to a radius of 75 and the inferred mass of molecular hydrogen is M⊙ (Brouillet et al. brouillet2 (1991); Sage and Westpfahl sage (1991)), assuming a standard )/ ratio. The HI mass within the same radius is 5 M⊙ (Hine hine (1984)) which leads to a molecular to atomic gas ratio of 0.2, a bit less than the mean value (0.3) derived by Sauty et al. for Sab galaxies, and much less than the average value (2) derived by Young & Knezek.
However even if M 81 does not appear anymore so atypical, the distribution of molecular gas with respect to the other tracers of star formation still raises questions.
Reichen et al. (reichen (1994)) from the distribution of UV 2000 Å emission find that massive star formation apparently does not occur preferentially at the locations of the highest gas surface density. Furthermore in our CO surveys (Brouillet et al. brouillet1 (1988), brouillet2 (1991)) we found a peculiar lack of emission near the most luminous HII regions, which would confirm that they are efficient in dissociating the molecular gas or in pushing it out (Kaufman et al. 1989a ). But there are still a few HII regions where the visual extinction is too high if only the atomic gas is taken into account and which must then have associated molecular gas. The dilution factor in the IRAM 30 m beam can explain the observed low which would mean that the CO is highly concentrated on these HII regions.
Other evidence that the CO measurements may underestimate the molecular gas mass is provided by the dust lanes. Kaufman et al. (1989b ) deduce, from measurements of the visual extinction and the HI column density, that the dust filaments in M 81 are composed mainly of molecular gas. Though CO emission appears to be associated with the dust regions on a large scale, we did not detect any strong emission with the 30 m towards two particular dust lane positions of high optical depth (Av 16) (Brouillet et al. brouillet2 (1991)). The mass of molecular gas is at least a factor of 3 to 5 times lower than that inferred by Kaufman et al. (1989b ). This inconsistency suggests that: (i) the gas-to-dust ratio is different from the Galactic value – but it seems unlikely that it is as low as required to explain the discrepancy; or (ii) the )/ ratio is different from the Galactic value; or (iii) the molecular clouds have a low excitation temperature .
Indeed Allen and Lequeux (allen (1993)) have detected extended molecular clouds associated with dark dust clouds in the inner disk of M 31. These molecular clouds have a very low excitation temperature and display much fainter CO emission than Galactic GMC’s. In such a case the CO line intensity cannot so straightforwardly be used as an indicator of the molecular mass.
High spatial resolution observations are needed to precisely locate the molecular clouds in M 81 with respect to the dust filaments and HII regions. Furthermore as the CO emission is weak, we need the most sensitive interferometer.
From our previous 30 m observations we identified the best field in order to detect molecular complexes in M 81. In the N 5 field (Brouillet et al. brouillet2 (1991)) CO emission follows the East-West dust lane and at the () position the CO profile is double peaked. The HII region 138 (Kaufman et al. kaufman (1987)) lies 30′′ farther to the West. This HII region is not representative of the HII regions with too much extinction; half of the observed HI in its direction is already sufficient to account for its extinction. We observed a position on the dust lane, covering the () 30 m position and most of HII region 138.
2 Observations
CO (=10) line observations at 115 GHz were carried out towards M 81 with the IRAM Plateau de Bure Interferometer in August and September 1995. We used the compact CD configuration which led to a synthesized beam of 51 48; this corresponds to 89 pc 84 pc at the adopted distance of 3.6 Mpc (Freedman et al. freedman (1994)). The primary beam is HPBW. The four antennas were equiped with SIS receivers and system temperatures ranged from 300 to 700 K. 1044+719 and 0954+658 were used as phase and amplitude calibrators. 3C273, 3C84, NRAO530 and 3C454.3 were used as bandpass and flux calibrators. The six units of the correlator were split as follows: two units covering 160 MHz each were used for the continuum, two 256 channels units and two 128 channels units provided a velocity coverage of 155 km s-1 and 258 km s-1 respectively, centered at km s-1 ( km s-1). The channel separation was 0.156 MHz and 0.625 MHz respectively thus giving an effective velocity resolution of 0.65 km s-1 and 2.6 km s-1 (since the channels are not independent).
The phase center of the observations was , . The coordinates were afterwards transformed into the B1950 system and the phase center in this system is then .
The total on-source integration time was about 34 hours. No continuum emission was detected at a 5 mJy level (3). The line maps were cleaned using the CLARK algorithm and then corrected for primary beam attenuation. We achieved a sensitivity of 0.5 K km s-1 (1) at the center of the line integrated-intensity map (map integrated in velocity over a 52 km s-1 range) and 2.5 K km s-1 (1) on the outside border. The flux has been converted from Jy/beam to K by multiplying by 3.8 K/Jy.
We also made CO (=10) observations with the IRAM 30 m radiotelescope in November 1996. Due to the minimum spacing of the Plateau de Bure antennas (35 m), structures more extended than 15′′ cannot be detected. The 30 m telescope can thus perfectly provide the short spacings data to complete the interferometer set. We used two SIS receivers in parallel; the system temperature was about 500 K. Two 1 MHz filterbanks and an autocorrelator gave velocity resolutions of 2.6 and 1.3 km s-1 respectively. The half power beamwidth was . Unfortunately due to bad weather we could not complete our single-dish map in order to add it to the interferometer data. However, we obtained a map of size 20′′ 20′′ with 8′′ spacing and a sensitivity of 380 mK (at the center) and 110 mK (on the edge) for 2.6 km s-1 resolution. The pointing error is estimated to be 5′′ at most.
3 Results
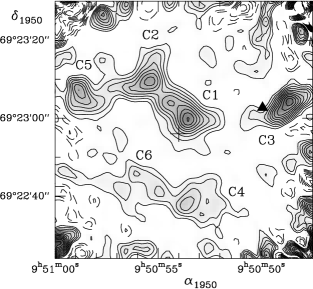
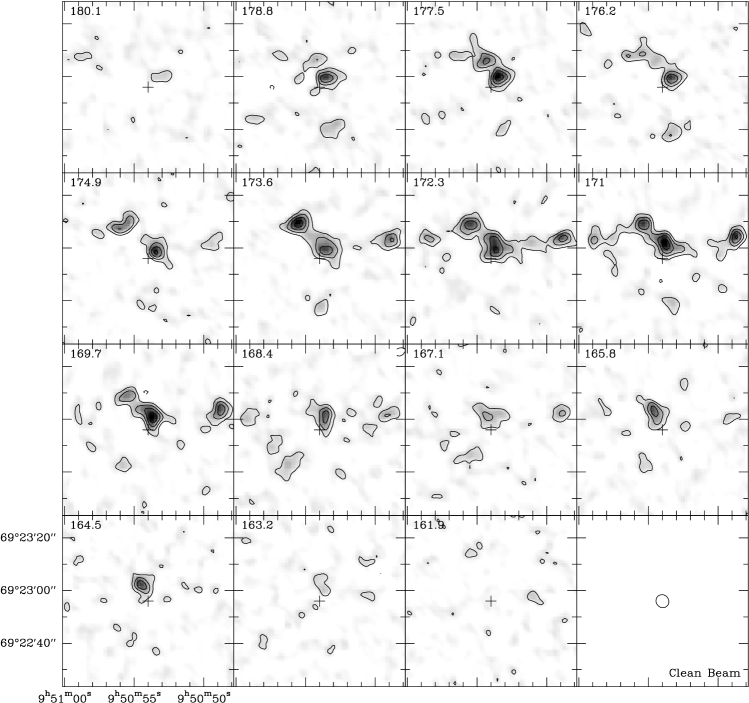
Figure 1 displays the line integrated intensity map and Figure 2 the channel maps. The field, which is located in the northern spiral arm, displays a complex molecular structure and there is no clear velocity structure.
From fig. 2 we identified 6 molecular complexes, noted C1 to C6 on fig. 1 and in Table 1. They were defined as structures appearing on at least 2–3 adjacent channels. These complexes range in integrated CO flux from 1.3 Jy km s-1 for C6 to 5.0 Jy km s-1 in the case of C1 and C3, and in effective radius from 78 pc for C4 to 105 pc for C1. Complex C1 is located near the phase center, but C3 and C5 lie well beyond the half power point of the primary beam.
In order to estimate the extended emission missed by the interferometer, we compared the 30 m spectra to the interferometric observations convolved to the same spatial resolution (see fig. 3). The two data sets agree very well in velocity and line intensity except for the (16′′,16′′) position. As this position is at the border of the interferometric map and because of the noise, we cannot conclude if a GMC within the 23′′ beam of the 30 m was too far from the phase center to be detected by the interferometer or if extended emission is missing from the interferometer map at this peculiar position. Over the entire observed field the difference of flux is in the noise of the spectra and the missing flux can be estimated to 0–30% because of the calibration uncertainties. Thus there is no strong structure more extended than 15′′ (300 pc) and no widespread distribution of small molecular clouds.

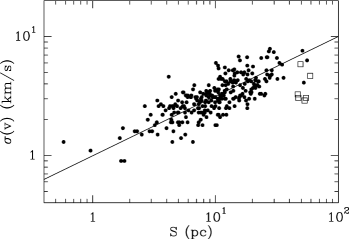
We note that the linewidths of the complexes are narrow compared to Galactic complexes of the same size. The M 81 linewidths plotted on the velocity dispersion versus size diagram of Solomon et al. (solomon (1987)) are well below those for the Galaxy (fig. 4). For the structures found by the interferometer, 100 pc, we should expect a width of 15–20 km s-1 typically, while we find 7–14 km s-1. The linewidths of the clouds in this paper (mostly 7 km s-1 for a beam) scale up to the linewidths observed for M 81 clouds by Brouillet et al. (brouillet2 (1991)) with the 30 m (400pc) and beams (of the order of 5 to 20 km s-1) via, approximately, the classical relation size1/2. This assumes the linewidths are due only to self-gravitation and turbulence of the molecular clouds (not to rotational gradients in the beam). In magnitude the linewidths in both cases lie below the Solomon et al. (solomon (1987)) relation (or extrapolated relation) for Milky Way clouds, e.g., with a beam, we should have expected at least 30 km s-1 for clouds similar to Galactic clouds, if the clouds filled the beam. But it is uncertain to extrapolate the Solomon et al. (solomon (1987)) relation to structures of 400 pc in size, the observed linewidths must include the velocity gradient across the beam, and if clouds do not fill all the beam, they will not show the complete V-gradient.
The M 81 linewidths are also narrow compared to those of the two molecular complexes identified by Viallefond et al. (viallefond (1992)) in M 33 and to the molecular complex mapped by Casoli et al. (casoli (1987)) in M 31. On a larger scale, Table 2 of García-Burillo et al. (santiago (1993)) lists the CO linewidth-size relation for external galaxies and, except for NGC 628, M 81 appears to have narrower lines. Although a weaker turbulence, perhaps resulting from a less active star formation throughout the M 81 disk, could explain the narrow lines, the star formation activity in M 81 (and NGC 628) is generally stronger than in M 31. Another possible explanation is the CO abundance: if the clouds are less optically thick, the lines can be narrower.
4 The / ratio
The value of the ratio is still a subject of debate, especially because the “standard” value ( H2cm-2/(K km s-1), Strong et al. strong (1988)) adopted for the Milky Way does not seem to be valid everywhere in the Galaxy. For example Digel et al. (digel (1995)) recently derived a lower value H2cm-2/(K km s-1) towards Orion. The determination of in other galaxies is thus of great interest.
The resolution of molecular observations is increasing due to millimeter interferometers which allow us to resolve molecular complexes in nearby galaxies. The values are not constant and Nakai & Kuno (nakai (1995)) find the following tendency: compared to our Galaxy, the values are smaller or comparable in galaxies earlier than Scd, and greater towards very late-type or irregular galaxies. They also find that depends on as is larger for small . Metallicity, in addition, is a fundamental parameter determining the ratio, and is decreasing exponentially with radius in the Galaxy (Sakamoto sakamoto (1996)). From a study of 5 local group galaxies Wilson (wilson (1995)) finds that significantly increases as the metallicity of the host galaxy decreases.
Our interferometric observations allow us to isolate molecular complexes in M 81. Though these structures are bigger than typical Galactic GMCs, we try to derive a value of for these molecular complexes from two different methods: the virial theorem and the visual extinction . The latter method requires an assumption about the relative distribution of stars and gas along line-of-sight.
4.1 Virial mass
In order to calculate the virial mass, we used where is in M⊙, is the effective diameter in pc and is in km s-1 (Solomon et al. solomon (1987)). This formula is obtained assuming that the cloud is a sphere with a power-law (=1) density distribution. If instead we represent the cloud as a sphere with uniform density, the virial mass is then: and the mass is just 10% higher.
To calculate the masses, we derived from the spectra the rms noise and the linewidths at half intensity . And from the line contour maps we measured the size of the complex at a 3 level as well as the integrated intensity averaged over the cloud’s area; an effective diameter is then derived from the area of the complex (area=). We make the hypothesis that the clouds are spherical so that there is no effect due to the inclination of the galaxy. The cloud diameters were deconvolved from the synthesized beam using a gaussian model. Anyway as they are about twice the FWHM of the synthesized beam, the deconvolution just leads to a 10% smaller virial mass and a 10% smaller value of .
Because the clouds in this paper have a rather large sky-plane radius ( pc), it is likely that they are somewhat flattened. The thickness of the molecular disk is 120 pc (FWHM) in the Milky Way (Combes combes (1991)) and probably smaller in M 81 because of the lower velocity dispersion. Nevertheless, the following example suggests that the virial mass of the cloud calculated by assuming these clouds are spherical is close to that obtained for a somewhat flattened cloud because the inclination correction tends to compensate for the oblateness correction. The virial mass for an oblate spheroid of uniform density and eccentricity is the mass for the uniform density sphere multiplied by the factor /arcsin (Binney & Tremaine binney (1987)). The inclination correction to reduce the effective diameter to face-on (inclination ) increases from a factor of 1 for a sphere to a factor of (cos )-1/2 for a highly flattened spheroid. The inclination is in M 81. As an example, if we suppose the clouds have a minor/major axis ratio in the range 0.2–0.6, with the minor axis perpendicular to the plane of M 81, then, to get the virial mass of a uniform, oblate, spheroidal cloud in M 81 from the virial mass of a uniform sphere, one multiplies by a total correction factor (for oblateness and inclination) of 0.97–1.01, respectively.
| Cloud | |||||||||||||||||
|---|---|---|---|---|---|---|---|---|---|---|---|---|---|---|---|---|---|
| mK | km s-1 | km s-1 | km s-1 | ′′ | K | K km s-1 | M⊙ | ∗∗ | |||||||||
| (1) | (2) | (3) | (4) | (5) | (6) | (7) | (8) | (9) | (10) | (11) | (12) | ||||||
| C1 | 09 50 53. | 6 | 69 22 59. | 5 | 40 | 173.9 | 172.4 | 11. | 0 | 6. | 0 | 0. | 8 | 4.6 | 2. | 4 | 7.0 |
| C2 | 09 50 55. | 3 | 69 23 09. | 0 | 65 | 173.1 | 174.4 | 7. | 7 | 4. | 55 | 1. | 0 | 5.3 | 0. | 9 | 3.9 |
| C3∗ | 09 50 48. | 9 | 69 23 02. | 0 | 110 | 170.9 | 171.4 | 7. | 2 | 5. | 4 | 1. | 3 | 5.7 | 0. | 9 | 2.7 |
| C4 | 09 50 53. | 4 | 69 22 38. | 7 | 70 | 175.7 | 175.0 | 7. | 2 | 4. | 5 | 0. | 4 | 2.5 | 0. | 8 | 7.3 |
| C5∗ | 09 50 58. | 4 | 69 23 04. | 6 | 110 | 173.1 | 173.7 | 13. | 8 | 4. | 6 | 0. | 5 | 6.2 | 2. | 9 | 10.6 |
| C6 | 09 50 55. | 6 | 69 22 44. | 2 | 55 | 168.2 | 168.8 | 6. | 9 | 5. | 25 | 0. | 3 | 1.6 | 0. | 8 | 9.0 |
| ∗ Clouds C3 and C5 lie beyond the half power point of the primary beam and the derived parameters are more uncertain |
| ∗∗ in H2 cm-2/(K km s-1) |
If we assume that the virial mass represents the molecular hydrogen and helium mass, we can derive the ratio and the results are listed in column 12 of Table 1. The total uncertainty on these values is about 50%.
The mean value of is H2cm-2/(K km s for the six clouds. The uncertainties are much bigger for complexes C3 and C5 which are located on the border of the primary beam, and for complex C6 which has fainter emission. Omitting these clouds with less well determined parameters, the mean value of is H2cm-2/(K km s-1). The mean value is about 3 times the standard Galactic value and about twice the value expected from the metallicity relation of Wilson (wilson (1995)). The metallicity of this field is close to the one measured in the solar neighborhood. Indeed Garnett & Shields (garnett (1993)) find 12+log(O/H)=8.94 towards HII region 138 and a mean value of 8.79 at the galactocentric distance of this field in M 81, whereas Shaver et al. (shaver (1983)) get 8.700.04 for the solar neighborhood. For such metallicities, as for M 31 and inner clouds in M 33, Wilson (wilson (1995)) find H2cm-2/(K km s.
Except for cloud C3, the value of is unusually large. If the molecular hydrogen + helium mass represents the virial mass, such a large ratio means that, though CO emission in this M 81 field is weak, there is a lot of H2. As the metallicity is normal, this could be due to a recent massive HI to H2 conversion due to collisions; clouds C1, C2 and C5 are along the dust lane a little downstream from the HI ridge and may form a cloud collision front (Elmegreen elmegreen (1988)). We may be seeing only the warm envelopes of cold molecular clumps, so the integrated CO intensity may not represent the entire molecular mass of the cloud. Alternatively, if the true value in M 81 is in fact comparable to the Galactic one, the virial mass is about 3 times bigger than the molecular mass and either the clouds are virialized because of a large mass of stars and/or cold atomic gas not taken into account in these calculations (see next paragraphs), or the clouds are not virialized. In particular, Taylor & Wilson (taylor (1997)) recently made interferometric observations with OVRO of another field on the spiral arms of M 81 with a higher angular resolution (3′′). They have identified three GMCs with diameters 100 pc and very narrow linewidths of 4.7–7.7 km s-1. Their field also has nearly solar metallicity, and their values for the integrated CO flux and imply that is H2cm-2/(K km s-1) in their clouds. The GMCs’ peak brightness temperatures are 3 K and with beam dilution it is consistent with the mean 1 K peak brightness temperature of the complexes of this paper. Thus it is possible that the molecular complexes identified in this paper contain several (2 or 3) gravitationally bound clouds of mass a few 105 M⊙ and size 100 pc not resolved in our data. In the case of cloud C3, which is associated to the giant HII region (see sect. 5), we find the standard value and, though the derived parameters are more uncertain, it could be a single gravitationally bound cloud.
In the virial mass we have neglected the mass of the stars. Indeed if we assume that the mass of the optical disk is about M⊙ within a radius of 20 kpc, with an exponential distribution for the surface density , =3 kpc, the surface density 6.5 kpc far from the center is M⊙ pc-2. This is comparable to a GMCs’ typical mean surface density (170 M⊙ pc-2, Solomon et al. solomon (1987)), but the stellar distribution has a scale height of about 10 times that of the GMC, so that the volume density is about 10 times smaller for the stars than for the GMCs and we can neglect the mass of the stars at such a distance from the center. However the molecular surface densities derived for the M 81 clouds are smaller (30–150 M⊙ pc-2) with the derived ratio and even smaller (7–30 M⊙ pc-2) with the standard value. Thus the mass of the stars may be less negligible compared to the molecular mass and may contribute to the binding of the clouds.
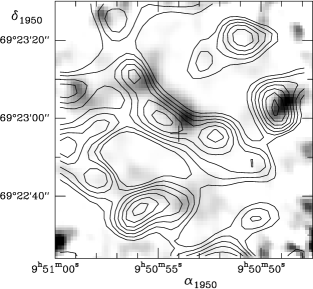
In these calculations we have also neglected the HI gas. However there is a good agreement between the CO and HI distribution (see fig. 5) and velocities (see Table 1, where the HI velocities were measured by Adler on the HI image with resolution from Adler and Westpfahl adler (1995)). It seems that there is a shift between the HI and CO maxima but the difference of resolution ( for the HI map of Hine (hine (1984)) and for the CO map) does not allow us to conclude about whether the shift is significant. In section 4.2 we conclude that for cloud C1 the HI is not associated with the molecular cloud as it is mainly in a cold dust lane at high ; this is also true for cloud C2 since the overlaid HI is along the same HI feature. In the case of cloud C3, it is clear that one should not include the entire HI column density in the cloud mass, because the resulting (HI) alone times the 1.36 correction factor for helium would equal (see sect. 5). For the other complexes, if we take into account the HI correction in the virial mass calculation and we assume that all the HI column density measured towards the CO complexes (Hine hine (1984)) also contributes to the virial mass , then we deduce a mean ratio of H2cm-2/(K km s, or omitting complexes C3, C5, and C6, which have more uncertain parameters, the mean is H2cm-2/(K km s.
Nevertheless, the most plausible explanation for the high values of X is that the complexes are not virialized but consist of a few unresolved self-gravitating clouds.
4.2 /
Kaufman et al. (1989b ) measured the extinction of several dust filaments in M 81 and compared them with the HI surface density. One of their positions located at corresponds to our complex C1. To analyze their data they used a dust-cloud model where the cloud is located at a height from the midplane and has a uniform distribution of dust. For C1 they found =200–400 pc and =4–8. The HI column density is calculated from the HI map of Hine (hine (1984)) averaged over the VLA 9′′ beam and atom cm-2 for C1. If we know the ratio, we can deduce and then derive the molecular amount necessary to account for the extinction.
The value of varies from one galaxy to another because of the metallicity (Nakai & Kuno nakai (1995)), but the value of should not vary with galaxies if the dust properties are the same on a large scale and in a moderately dense medium. So we can use the Galactic gas to extinction ratio (Bohlin et al. bohlin (1978)) corrected for metallicity (as in Kaufman et al. 1989a ). We thus have =0.58 mag atom-1 cm2 at =6 kpc.
With atom cm-2, then using the HI column density measured with resolution and assuming all the gas is in front, we have = – =5.2 1021atom cm-2 for =4 or 1.3 1022atom cm-2 for =8. From our data we measured a CO integrated intensity =4 K km s-1. For this extinction comparison, we give the integrated CO intensity centered on the dust position and averaged over the 9” FWHM of the HI beam, whereas Table 1 lists the integrated intensity averaged over the cloud. If we assume that the interferometer missed at most 30% of the CO flux, we get in the range 4.5 1020 to 15 1020 H2cm-2/(K km s-1). If we average the CO emission over just the width of the dust lane, then = 7 K km s-1, and assuming that the interferometer detected all the emission in this small region, we get = 3.5–8.8 1020 H2cm-2/(K km s-1). These various estimates are consistent with the values of derived above.
We assumed here that the molecular cloud is associated with the dust lane and thus at a height =200–400 pc, which is unlikely. The molecular scale height in our Galaxy is about 50 pc and the star formation is more violent than in M 81, so that the stellar winds are more present to push clouds up.
An extinction of =4 implies a gas column density of 7.6 1021 atom cm-2. If the HI were concentrated in the linear dust lane of width 2.5′′, the HI column density would be 8.1 1021 atom cm-2, enough to explain alone the extinction. But the HI column density is similar towards neighboring regions, so there is no evidence for the HI to be confined in the dust lane. For cold and dense HI clouds with =8 1021 atom cm-2, a typical =10 km s-1 and temperature =10 K, the HI is highly optically thick and we don’t measure the true HI column density. We can finally assume that there is both diffuse optically thin HI (at a typical temperature of 100 K) and the HI confined to the dust lane at a high and optically thick (at a typical temperature of 10 K). It can be the same for the CO emission as we detect the less optically thick emission and we don’t see the gas providing most of the extinction.
We can thus account for the observed extinction given the measured HI and CO emissions. However, we note that the dust position in cloud C1 is not one of the positions measured by Kaufman et al. (1989b ) with a large discrepancy between the extinction and .
5 Cloud C3 and HII Region 138
Cloud C3 and the Taylor & Wilson (taylor (1997)) cloud MC2 represent the first identifications in M 81 of CO emission associated with an individual giant HII region (see fig. 1). Previous CO observations of M 81 had too low a spatial resolution to connect the weak CO emission with the star-forming regions, so it has long been a puzzle as to how M 81 is forming massive OB associations in the presence of so little molecular gas. The answer for the interferometer field of fig. 1 is that most of the molecular mass, as indexed by the CO emission, is in the form of M⊙ complexes, suitable as birthplaces for large OB associations.
The giant HII region 138, with excitation parameter U = 250 pc cm-2 and diameters 17′′ x 13′′ (Kaufman et al. kaufman (1987)) appears inside cloud C3. In projection, the center of the cloud complex is displaced 7′′ = 120 pc from the center of the HII region. The location of the HII region is suggestive of a blister; possibly, the molecular gas on the eastern side of the HII region was photodissociated by the OB stars. Also, Kaufman et al. (kaufman (1987)) conjecture that a nonthermal radio source adjacent to the southeastern side of the HII region may be an SNR, which would have affected the molecular cloud. In the Milky Way, individual HII regions with free-free radio luminosity similar to that of HII region 138 are associated with molecular clouds of mass 4 105 to 4 106 M⊙ (Myers et al. myers (1986)). If cloud C3, associated with HII region 138, is a single virialized cloud, its mass (0.9 106 M⊙) lies within this range. HII region 172 (Kaufman et al. kaufman (1987)) near cloud MC2 in the Taylor & Wilson (taylor (1997)) field has a free-free radio luminosity similar to HII region 138 , but MC2 has a virial mass of only 3 105 M⊙, i.e., at the low end of the Milky Way range for clouds related to such luminous HII regions. Integrating the entire HI column density over the solid angle of the HII region gives an HI mass (HI) of 1.1 106 M⊙ for HII region 138 and 2.3 106 M⊙ for HII region 172 (Kaufman et al. 1989a ), not corrected for helium. In both cases, the molecular cloud is displaced towards the western side of the HII region, and the atomic mass in the region exceeds the molecular mass.
A layer of gas with column density 1.2 1021 atom cm-2 in front of the HII region would suffice to explain its observed extinction, = 0.70.3 mag. Averaged over the HII region, the CO integrated intensity is 1.9 K km s-1, which corresponds to a total column density through the disk of 5 1020 H2 cm-2 if we use the value of = 2.7 1020 H2cm-2/(K km s-1) found for cloud C3, and the HI column density through the disk is 2.4 1021 atom cm-2. Thus there is more than enough gas to account for the observed extinction, and the HII region is probably either at the midplane of the gas layer or slightly to the near side.
6 Conclusion
We have mapped and identified in M 81 six molecular complexes with virial masses 1–3 106 M⊙ and radii pc in an optimally-chosen field of deprojected size 1.1 2.1 kpc (the inclination of M 81 is 59). Comparing the virial masses with the CO fluxes of these clouds, we find a mean value of the / ratio 3 times stronger than the standard Galactic value and 2 times more than the value expected for such metallicities. The most plausible explanation is that the complexes are the average of several gravitationally bound clouds not resolved in our data. A possible exception is cloud C3 which is associated to the giant HII region and, though the derived parameters are more uncertain, it could be a single gravitationally bound cloud. Severe beam dilution in the single-dish surveys (e.g., with the NRAO 12 m telescope) appears to account, in part, for the weakness of the overall CO emission from M 81 in such surveys.
However we observed here an optimal field as it overlapped one of the stronger fields in the CO single-dish surveys. Its CO emission may not be typical of M 81 as a whole: the sum of the virial masses of the six complexes is 8.7 106 M⊙, which gives an upper limit to the H2 mass of 6.4 106 M⊙ if helium is omitted. (On the other hand, if the standard value of applies, the H2 mass is 2.3 106 M⊙, omitting helium.) The upper limit is 6% of the total molecular mass of M 81. The corresponding HI mass of this field is 1.65 107 M⊙, which leads to a molecular to atomic gas ratio of 0.14 if we use the standard value of and neglect a diffuse component, or up to 0.6 if we use the sum of the virial masses and take the upper limit on the diffuse component from the comparison of the 30 m and interferometer data. Furthermore this field contains a giant radio HII region coinciding with one of the molecular complexes and the other clouds are on the UV-bright arm, so that there is adequate heating of the gas. But the observed narrow linewidths have still to be explained.
The upper limit to the average molecular column density in this optimum field on the arm (obtained from the sum of the Virial masses) is approximately 6 M⊙ pc-2. This is much smaller than even the interarm surface density of molecular gas in the CO-rich galaxy M 51 (see Rand et al. rand (1992)).
The 3 GMCs in M81 detected by Taylor and Wilson (taylor (1997)) in another field of the spiral arms have CO integrated fluxes of 1.6–3.2 Jy km s-1, diameters of 100 pc, and linewidths of 5–8 km s-1. For comparison, our 6 complexes have CO integrated flux of 1.3–5.0 Jy km s-1, diameters of 160–200 pc, and linewidths of 7–14 km s-1. Thus our complexes have somewhat similar 12CO (1–0) fluxes but significantly larger areas. In both cases, the linewidths are narrow as compared to Galactic clouds of the same diameter. This has some interesting implications. Because of the low velocity dispersion, it is possible that the scale height of the molecular gas is smaller than in the Milky Way. However, if the complexes are not significantly flattened, then the mean volume density in the M81 clouds must be less than in Galactic clouds. This would mean that the clouds themselves are different from those in the Milky Way. Taylor and Wilson (taylor (1997)) speculate that their clouds might be complexes consisting of several subclouds, like the Orion complex. This is one way in which the mean volume density could be reduced.
From our interferometric and single-dish data, it seems that this field in M 81 has no fewer molecular complexes than other comparable galaxies but lacks a significant widespread distribution of small molecular clouds (in the limits of the calibration uncertainties, i.e. less than about 30% of the total flux). This lack of small molecular clouds could be due, in this particular field, to a collision front (see sect. 4.1) where the small clouds have agglomerated into big ones. Another possibility is that, as the molecular surface density in M 81 is low, the small diffuse clouds have less self-shielding against CO photodissociation than the GMCs.
In the regions of M 81 with little UV emission (e.g. the interarm regions and parts of the central 4 kpc HI hole), there is little heating of the gas, so most of the CO gas there may be too cold to have been detected in the surveys thus far. Allen et al. (allen2 (1997)) reach the same conclusion from their picture of HI as a product of star formation process, and they speculate that the gas in the main part of the disk of M 81 is largely in the form of molecular hydrogen with a low excitation temperature. It is still uncertain whether the 12CO (1–0) emission from M 81 as a whole can be used directly as a reliable tracer of the molecular gas.
We conclude from the observations presented here that the molecular medium
in M 81 differs from that in the Milky Way.
Acknowledgements.
We thank the IRAM staff in Grenoble and Granada for their help. We thank too David Adler for measuring the HI velocities. We acknowledge our referee Christine Wilson for her very helpful comments.References
- (1) Adler, D.S., Westpfahl, D.J. 1995, AJ, 111, 735
- (2) Allen, R.J., Lequeux, J. 1993, ApJ, 410, L15
- (3) Allen, R.J., Knapen, J.H., Bohlin, R., Stecher, T.P. 1997, ApJ, 487, 171
- (4) Binney, J., Tremaine, S. 1987 “Galactic Dynamics”, ed. Princeton University Press
- (5) Bohlin, R.C., Savage, B.D., Drake, J.F. 1978, ApJ, 224, 132
- (6) Brouillet, N., Baudry, A., Combes, F., 1988, A&A, 196, L17
- (7) Brouillet, N., Baudry, A., Combes, F., Kaufman, M., Bash, F. 1991, A&A, 242, 35
- (8) Casoli, F., Combes, F., Stark, A.A. 1987, A&A, 173, 43
- (9) Combes, F. 1991, ARAA, 29, 195
- (10) Digel, S.W., Hunter, S.D., Mukherjee, R. 1995, ApJ, 441, 270
- (11) Elmegreen, B.G. 1988, ApJ, 326, 616
- (12) Freedman, W.L., Hughes, S.M., Madore, B.F. et al. 1994, ApJ, 427, 628
- (13) García-Burillo, S., Combes, F., Gérin, M. 1993, A&A, 274, 148
- (14) Garnett, D.R., Shields, G.A. 1987, ApJ, 317, 82
- (15) Kaufman, M., Bash, F.N., Kennicutt, R.C., Jr., Hodge, P.W. 1987, ApJ, 319, 61
- (16) Kaufman, M., Bash, F.N., Hine, B., Rots, A.H., Elmegreen, D., Hodge, P.W. 1989a, ApJ, 345, 674
- (17) Kaufman, M., Elmegreen, D.M., Bash, F.N. 1989b, ApJ, 345, 697
- (18) Hine, B. 1984, MA thesis, University of Texas
- (19) Myers, P.C., Dame, T.M., Thaddeus, P., Cohen, R.S., Silverberg, R.F., Dwek, E., Hauser, M.G. 1986, ApJ, 301, 398
- (20) Nakai, N., Kuno, N. 1995, PASJ, 47, 761
- (21) Rand, R.J., Kulkarni, S.R., Rice, W. 1992, ApJ, 390, 66
- (22) Reichen, M., Kaufman, M., Blecha, A., Golay, M., Huguenin, D. 1994, A&AS, 106, 523
- (23) Sage, L., Westpfahl, D. 1991, A&A, 242, 371
- (24) Sakamoto S. 1996, ApJ, 462, 215
- (25) Sauty, S., Casoli, F., Gérin, M., Boselli, A., Fouqué, P., Braine, J., Gavazzi, G., Lequeux, J., Dickey, J. 1997, A&A, submitted
- (26) Shaver, P.A., McGee, R.X., Newton, L.M., Danks, A.C., Pottasch, S.R. 1983, MNRAS, 204, 53
- (27) Solomon, P.M., Rivolo, A.R., Barrett, J., Yahil, A. 1987, ApJ, 319, 730
- (28) Strong, A.W., Bloemen, J.B.G.M., Dame, T.M., Grenier, I.A., Hermsen, W., Lebrun, F., Nyman, L.-Å, Pollock, A.M.T., Thaddeus, P. 1988, A&A, 207, 1
- (29) Taylor, C.L., Wilson, C.D. 1997, ApJ, in press.
- (30) Young, J.S., Knezek, P.M. 1989, ApJ, 347, L55
- (31) Viallefond, F., Boulanger, F., Cox, P., Lequeux, J., Pérault, M., Vogel, S.N. 1992, A&A, 265, 437
- (32) Wilson, C.D. 1995, ApJ, 448, L97