The physical parameters of the evolving population of faint galaxies
Abstract
The excess numbers of blue galaxies at faint magnitudes is a subject of much controversy. Recent Hubble Space Telescope results has revealed a plethora of galaxies with peculiar morphologies tentatively identified as the evolving population. We report the results of optical spectroscopy and near-infrared photometry of a sample of faint HST galaxies from the Medium Deep Survey to ascertain the physical properties of the faint morphological populations. We find four principal results: Firstly that the population of objects classified as ‘peculiar’ are intrinsically luminous in the optical (). Secondly these systems tend to be strong sources of [OII] line luminosity. Thirdly the optical-infrared colours of the faint population (a) confirm the presence of a population of compact blue galaxies and (b) show the stellar populations of Irregular/Peculiar galaxies encompass a wide range in age. Finally a surface-brightness comparison with the local galaxy sample of Frei et al. shows that these objects are not of anomalously low surface brightness, rather we find that all morphological classes have evolved to a higher surface brightness at higher-redshifts ().
keywords:
surveys – cosmology: observations – galaxies: evolution – galaxies: structure – galaxies: peculiar1 INTRODUCTION
The use of the Hubble Space Telescope (HST) has revolutionised the study of high-redshift galaxy populations. It is well known that counts of galaxies in blue passbands increasingly exceed no-evolution predictions at faint magnitudes () (Ellis 1997). Extensive redshift surveys have been undertaken of these objects selected in (Broadhurst et al. 1988, Colless et al. 1990, Glazebrook et al. 1995A, Ellis et al. 1996), (Lilly 1995) and bands (Glazebrook et al. 1995B, Cowie et al. 1994, 1996) which have been used to construct the respective luminosity functions as they evolve with redshift. At short wavelengths, where the evolution implied by the counts is strongest, there appears to be an increase in the space-density of galaxies at luminosity (we use ), over (Ellis et al. 1996). At longer and wavelengths, the excess appears to occupy fainter portions of the luminosity function (Glazebrook et al. 1995B, Cowie et al. 1994, 1996).
More recently the availability of deep HST data has started to reveal the morphological character of these faint galaxy populations. Glazebrook et al. (1995C) and Driver et al.(1995) published the first morphologically split number-magnitude counts to based upon human classification of faint Medium Deep Survey data. They found two principal results: firstly the counts of elliptical and spiral galaxies matched closely the predictions of a no-evolution model provided a high local normalisation () was used. Secondly they found the counts of irregular/peculiar galaxies (i.e. those lying outside the standard Hubble sequence) rose much faster than the no-evolution prediction, and it was this steep rise which appeared to account for the previously known faint blue galaxy excess.
An obvious problem with this type of analysis is the subjectivity of human classification and possible systematic effects on the observed morphology due to cosmological dimming in surface brightness and the shift of the observed bandpass towards the blue. This was investigated by Abraham et al.(1996A) who used an objective scheme based upon central-concentration and asymmetry image parameters to classify galaxies. To calibrate the systematics they used a sample of CCD images of nearby galaxies and simulated their appearance to HST at redshifts . This confirmed the earlier results of the steep rise in the number-magnitude counts of morphologically peculiar system. This trend has now been shown to extend to (Abraham et al. 1996A) using the Hubble Deep Field data.
It now seems well established that the fraction of peculiar systems is enhanced at intermediate redshifts; however number-magnitude counts are rather a crude tool and insensitive to subtle evolutionary trends in the galaxy populations. The next obvious step is to correlate the morphological properties derived from HST with the traditional ground-measurable properties such as redshift, luminosity, line strength and colour to try and establish the physical properties of this peculiar population and compare it with the more regular population. This requires redshifts of the galaxies and to date most of the large-area HST morphological data has come from the Medium Deep Survey, or MDS, (Griffiths et al. 1994). Since these are semi-random parallel fields near other targets of interest the faint galaxies usually have no prior observations.
To remedy this we have carried out a ground-based observational campaign of optical spectroscopy and infrared photometry of selected MDS fields in order to further elucidate the nature of the faint irregular and normal galaxies. We report here on the results of our observations. The plan of this paper is as follows: in section 2 we detail our ground-based observations and the data reduction. Section 3, analyses the luminosities and line strengths of the faint galaxies, section 4 looks at the optical-infrared colours and section 5 covers the surface-brightness distributions. Finally we summarise our conclusions in section 6.
2 GROUND-BASED OBSERVATIONS
The observations on which this paper is based are divided into two parts: firstly optical spectroscopy at the 4.2m William Herschel Telescope (WHT) on La Palma and secondly infrared photometry obtained at the UK Infrared Telescope (UKIRT) on Mauna Kea, Hawaii.
2.1 Sample selection
For our observations we wished to select a flux-limited sample of MDS galaxies of depth comparable to the deepest existing redshift surveys, i.e. covering the redshift range (Glazebrook et al. 1995A, Lilly et al. 1995). Our objects were drawn from the deep MDS subset described initially in Glazebrook et al. 1995C and published in full in Abraham et al.(1996A). We excluded the objects classified as stars on the HST images. The galaxy counts are complete to and the morphological classification is reliable to . F814W is close to the Cousin’s -band and so by selecting all galaxies with we will obtain a sample with a mean redshift of (Lilly et al. 1995).
2.2 WHT spectroscopy
The spectroscopic observations were obtained using the LDSS2 multislit spectrograph during two runs: 4–6 November, 1994 and 25–27 May, 1995. A total of 4 clear nights were obtained. A full description of the LDSS2 spectrograph can be found in Allington-Smith et al.(1994).
An LDSS2 mask was made for each of the MDS fields observed. LDSS2 has a field for multislits, however since the HST MDS fields were only in size only 8–13 slits could be put on target galaxies per mask. A total of 5 masks were observed containing a total of 52 galaxies with an accumulated exposure time of 3-4 hours per mask. The observational procedure and data reduction were otherwise identical to that for the LDSS2 redshift survey described in Glazebrook et al. 1995A. ( and are broadly equivalent in terms of typical and mean redshift.)
The spectral identifications are given in Table 1. The object IDs are the same as given in Table 1 in the large catalog paper of Abraham et al.(1996A) which has been cross-referenced for magnitudes, colours, classifications and other HST image parameters. We note that several of these fields were omitted from the original Abraham et al. paper due to the galactic latitude cut to avoid crowded fields. The crowding was subsequently found not to affect the A/C analysis or the photometry. These A/C values have been redone and are included in Table 1, except in two cases where the images were too close to other bright objects for the A/C analysis.
The actual spectra are broadly similar to the range of types and shown in Figure 1 of Glazebrook et al. and are not reproduced here. The use of the quality parameter for redshift identification confidence is the same as in Glazebrook et al.. and should have a similar reliability.

A total of 31 spectra were identified, one of which was a star misclassified as an S0. The typical completeness of each mask was –70%, the overall completeness was . While this was somewhat lower than the earlier LDSS2 survey we believe that was due to insufficient on the fainter objects as most of the unidentified objects are concentrated in the range . If we just consider the brighter sample the completeness is 78% out out of a total sample of 27 objects. In the following discussion we identify (by symbol size) the bright sample in the Figures and indicate the effect of identification completeness on our inferences. We believe our sample is robust enough for the scope of the analyses we will present below (primarily continuum and line luminosities) since the number-redshift distribution at is already well established (Lilly et al.). The most important consideration is to ensure the identifications cover the entire distribution of morphological types revealed by HST. This distribution is shown in Figure 1 which demonstrates that the identifications does indeed covers the range of types. They also cover the whole of the asymmetry-concentration diagram presented in Abraham et al. (1996A) as an alternative but equivalent measurement of the morphology. Thus we conclude our spectroscopic sample is is a reasonable, albeit small, basis for looking at the physical parameters as a function of morphology. The number-redshift distribution is discussed below in Section 3.
2.3 UKIRT photometry
The infrared observations for this project were collected on two observing runs: December 4–6 1994 and May 4–6 1995. The data was taken using the infrared camera IRCAM3 which is a indium antimonide (InSb) array. A plate scale of was used giving a field of view of which is approximately the same as one HST chip in the group of three in the Wide Field Camera images.
In each field we observed 1–3 HST chips, choosing the chips and the exact centers in order to maximise the number of galaxy targets.
As the night sky varies considerably on the time-scale of 15–30 minutes in the -band we made individual exposures of 2 minutes (each consisting of 12 frames of 10 seconds exposure averaged together), making inter-field offsets and reconstructing the sky flat-field by median filtering in groups of 8. For the December run we offset the telescope between the HST chips modulo a pixel dither pattern to attempt to get the best possible flatfield. However this tended to upset the guiding as often the guide star would be offset past the field dichroic causing a shift of a few arcseconds in its optical image. Because of this during the May run we simply dithered at each HST chip position separately. The guiding was greatly improved and no significant difference was obtained in the quality of the flatfield.
We had four clear nights in total over the two runs and obtained a K-band limit (3 per pixel in a diameter aperture) of in 11 HST fields covering 21 HST chip positions. with total on-target exposure times ranging from 3000 s (in good conditions) to 10 000 s (in conditions of moderate extinction). At this limit we detected virtually all of our targets in this field. To obtain close to total -magnitudes we used a diameter aperture (matching our corrected HST apertures). In the sample 172 of the 218 observed galaxies had photometry mags (roughly equivalent to detections) and 202 of the 218 observed galaxies had photometry mags (roughly equivalent to detections), the rest being too faint in . We use the latter as our cutoff for our photometry — since we doing photometry at sky positions determined from our -band images object detection is not an issue and so we can go deeper into the noise. These -magnitudes are given in Table 2 along with coordinates and A/C values from Abraham et al.. Note the A/C values of Abraham et al. have only be tabulated for , where their analysis stops. Additionally a few extra objects with were also omitted from the A/C analysis because the authors quite conservative in rejecting objects too close to the field edge, too close to other objects or contaminated by weak cosmic ray events or diffraction spikes.
3 THE LUMINOSITY OF FAINT GALAXIES
It has often been argued that the faint blue galaxy population could be a result of underestimating the number of local low surface-brightness or low-luminosity galaxies (e.g. McGaugh et al. 1994). These are then uncovered by the deep imaging surveys which have a lower surface brightness limit. However since the excess population has a similar to the no-evolution prediction (Glazebrook et al. 1995A) it can be inferred statistically that this is probably not the case: since the peak in occurs for galaxies (where is the characteristic Schechter luminosity in the no-evolution prediction) then the typical luminosity of the excess population must be . This has been confirmed recently by luminosity function analyses of much larger samples (Ellis et al. 1996) which show an increase in space density over at (for ).
With the sample we present here we are able to look at the luminosities of individual galaxies directly, in order to see how it depends on morphology.
3.1 -band Absolute Magnitudes

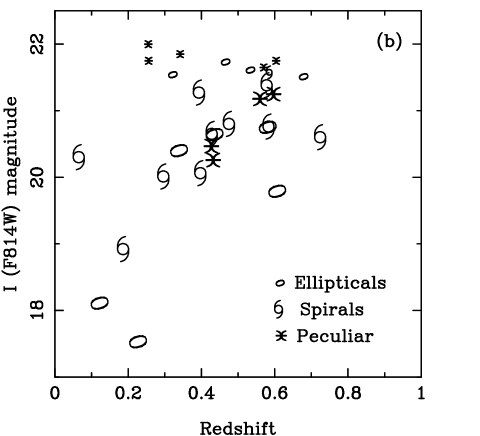
Since the observed -band at is close to the restframe -band, the K-correction is close to constant for all redshifts. This is shown in Figure 2(a) which shows the distribution of our sample overlayed with the (observed) to (rest) and (observed) to (rest) K-corrections using our spectral energy distribution (SED) templates of local Hubble types (those of Kennicutt 1992). The magnitude-redshift distributions of our morphological types is shown in Figure 2(b).
It can be seen that at the median redshift of our sample () the range of K-correction over the SEDs is only half that it is in the band. For the -band corresponds to rest frame through so there is no dependency on the uncertain near-UV continua of nearby galaxies and our correction gets better at the higher redshifts. Finally as we can assign physical morphological types from our HST images we can assign an appropriate K-correction from the corresponding spectral type. Even a gross error on the scale of several spectral types (e.g. elliptical/spiral or spiral/Irr) would correspond to an error in of only 0.2 mags. Thus we believe our K-corrections are much more robust than is usually the case and we can expect or values to be limited by the accuracy of the photometry of the original HST data.


These values are plotted in Figure 3(a). For a magnitude selected sample we expect the luminosities to lie near — this is indeed the case. It is immediately apparent that the luminosities of the peculiar systems are very similar to those of the elliptical and spiral galaxies. While some may be dwarfs (all of which are the fainter objects) many have luminosities as bright at . Thus we confirm directly what previously could only be inferred statistically. This implies that any model which tried to explain the excess population via local dwarfs must include some degree of luminosity evolution.
3.2 [OII] luminosity
Since we have spectra we can also look at the line emission of these objects. We consider the faint-end slice with hereafter to exclude the brightest, low-redshift objects. Our spectra were unfluxed but we can directly measure equivalent widths, this is shown in Figure 3(b). All of the objects had spectral windows including the [OII]-line location, the strength of this line is an indicator of star-formation. (Kennicutt 1992).
The previous deep redshift surveys (Broadhurst et al. 1988, Colless et al. 1990, Glazebrook et al. 1995A) established that the [OII] equivalent width distribution showed a high-end tail, not seen in local samples (Kennicutt 1992). It can be seen from Figure 3(b) most of the peculiar galaxies have much higher equivalent widths than the other galaxies, in a region comparable to local starburst galaxies such as NGC 4449 (Kennicutt 1992). One cautionary note is that most of these have where the incompleteness is high, obviously our redshift identification would be easier for strong [OII] emitters. Nevertheless it seems fair to conclude the high-EW tail (where we expect the completeness to be highest) is dominated by the morphologically peculiar systems.
Using the equivalent widths and the values we can estimate the [OII] luminosity which is plotted in Figure 3(c). The star-forming galaxies have . [OII] can only be used as a crude estimate of SFRs, however it is useful to try and estimate this quantity to ascertain the significance of the star-formation in these system.
If we convert use the conversion value from Kennicutt comes out as 20 (for ). Kennicutt assumes an extinction (1.0 mag at ) typical of local spirals and solar metallicity. If the metallicity was reduced to 20% solar the luminosity would be doubled, thus for blue and metal-poor systems the corresponding SFR could be reduced by a factor of up to 5 — however the HST data shows some of them are morphologically spiral. This is quite a large star-formation rate which is only found in giant Sc galaxies in the local Universe — it is enough to form a galaxy in 5 Gyr which is the time since so it seems clear that we are seeing a major epoch of star formation in these galaxies unless the bursts are very brief. In the spiral case at least this seems unlikely as the galaxy would still be visible when quiescent and nearly all of the spiral and irregular galaxies show this star-formation.
For the less luminous systems () we see that the star-forming galaxies have higher equivalent widths. This implies the amount of star-formation per unit -band light is higher. Finally we note that though most of the objects classified as ‘ellipticals’ are quiescent (implying most of the star-formation occurred at ), many of them show significant [OII] emission indicating star-formation activity. We return to this significant point in the next section.
4 THE COLOURS OF FAINT GALAXIES
A second method of probing the star-formation in faint galaxies is via the changes in the integrated colours from their stellar populations. The most sensitive indices come from the long baseline provided by optical-infrared colours; the optical light is easily boosted by a handful of young OB stars radiating in the rest frame UV– range while the light comes from older well-established stellar populations.
With a sample of 218 galaxies with HST images and -band magnitudes we have sufficient numbers to construct the colour distributions broken down according to morphological type and compare them with a non-evolving and full spectral-synthesis predictions.
The colour baseline in our data is provided by the (where is F814W from HST) colours — their histogram split by HST morphology is shown in Figure 4. This is, of course the distribution for an selected sample however it is a straight-forward matter to calculate the no-evolution prediction for this from a luminosity function prescription. As said before selecting in the approximates a local -selected sample.
Current observational datasets on faint galaxies are quite extensive — evolutionary modelers must attempt to fit number-magnitude, number-redshift, number-colour, colour-colour and colour-magnitude distributions in bands from through . Clearly it is too large a task to reproduce here. Instead we take an existing state-of-the-art model as our reference, and see how it does when the distribution is split up by morphology.
For our reference evolutionary model we use the prescription of Pozzetti, Bruzual and Zamorani (1996 — hereafter ‘PBZ’) who construct Pure Luminosity Evolution (PLE) models representing each Hubble type with increasingly longer star-formation times for later types. Additionally they introduce a population of ‘very Blue’ galaxies (vB) which are ‘eternally young’ by which they mean representing the class, at all epochs, by the SED of a galaxy undergoing a constant star-formation rate (SFR) at age 0.1 Gyr. This is intended to represent a real galaxy population which is ‘cycling’, i.e. galaxies bursting with star-formation, fading and being replaced by others. Such a arbitrary population has also be introduced by others — e.g. Gronwall & Koo (1995), though there are problems with this approach (see below).
With this extra population and using a high-normalisation luminosity function (see Glazebrook et al. 1995C for a discussion of normalisation) they match with various degrees of success the number-magnitude-colour-redshift distributions mentioned above. In particular the faint counts and colours ( and ) seem well reproduced to , though their predicted number-redshift distributions at see a tail not seen in the data of Glazebrook et al. 1995A. (However there is now evidence from Cowie et al.1996 that there may well be such a tail and that Glazebrook et al. incompleteness was biased to ).
For our modeling we use PBZ’s prescription of the luminosity function which is in turn based upon that of Efstathiou et al. (1988). Following Zucca et al. (1994) PBZ argue that the more recent determination of Loveday et al. (1992) is deficient in faint early-type galaxies. The main change we make in our modeling is to use the newer Bruzual & Charlot (1996) spectral synthesis code (‘BC95’) which is improved relative to the Bruzual & Charlot (1993) code (‘BC93’) used by PBZ. Following PBZ a Gaussian error function with mag is applied in the colour- plane before deriving the colour distribution. This is close to the mean error of our sample ( mags). (Even if this was allowed to be bigger to allow for the worst case errors (0.2–0.3 mags) the extra smoothing has no appreciable effect on the model curves below). We have checked through PBZ’s number-colour-magnitude-redshift results with the 1995 code and our software and find no significant change. When splitting by morphology we make the following correspondence between our physically classified types and the spectral types of Table 1 in PBZ: E/S0 E/S0, Spiral Sab, Sbc, Scd and Irregular/Peculiar Sdm, vB.

Firstly in Figure 4 we show the prediction from no-evolution with our simple SED templates (note we do not include any ‘very Blue population’ yet). As a quantitative measure of the significance of differences between the data and model distribution we use the Kolmogorov-Smirnov test, this is shown in Table 3. When the two differ with more than 99% confidence . (Note: to do this we need to ignore the non-detections, i.e. the leftmost bins in the histogram figures. However these only represent 7% of objects so we believe the following conclusions are robust.) Table 3 also give the ‘excess’ parameter () — i.e. the ratio of the number of galaxies observed to the number predicted. Panel (a) of Figure 4 reproduces the known 50–100% (dependent on ) excess of faint galaxies at , and it can be seen that most of the excess population is indeed blue. Breaking down by morphology and inspecting the figures and parameters it is clear that: (a) there is a significant excess of blue ‘ellipticals’, (b) the spiral distribution has a bluer median colour and (c) while many of the Irr/Pec galaxies are indeed very blue many of them have more normal, older colours indicating that they do not represent a simple ‘very blue’ population. We have also examined the effect on the colour distribution of using the late-age PBZ models as no-evolution SEDs and find the elliptical predictions become mag redder and the spiralIrr prediction becomes mag bluer. This reflects the accuracy with which the PBZ models match the data at late times. We have also carried out a study of the effects of metallicity using an early version of the ‘BC96’ code (Bruzual & Charlot in preparation). As expected this was small — varying the metallicity from solar to 20% of solar makes the colours only – mag bluer over .

To investigate this in more detail we plot in Figure 5 the PBZ evolving models (now including the ‘eternally young’ galaxies). Several points of interest are apparent:
-
1.
There is a broad agreement in the colour distribution and normalisation of all galaxies. There is still a –50% excess at even with this model including extra ‘very Blue’ galaxies. This is also seen in the number-magnitude counts (Figure 3(d) of PBZ) when plotted on an expanded scale. In our data the significance of this excess is marginal, especially in light of the uncertainties surrounding the absolute normalisation of the local luminosity function. However when we look at the breakdown by morphology a more complex picture emerges:
-
2.
Even with evolution put in there is still an excess of blue ‘ellipticals’. Note the evolution for ellipticals in the PBZ models is close to ‘passive evolution’ but not quite because ellipticals are slightly better represented by an exponentially decaying SFR with a short e-folding time rather than a single short burst (though after 5 Gyr there is little difference). Inspection of the images of the blue galaxies (defining them as ) does indeed show them to be compact objects, occasionally with a very weak disk. These objects make up 36% of the objects which are classified as ‘elliptical’ by the compactness criteria in the HST images and 10% of all galaxies — S0 galaxies should have similar colours to ellipticals and even contamination by Sa galaxies would only lead to colours mag bluer. We provisionally identify the blue compact galaxies as the same population as the ‘Blue Nucleated Galaxies’ of Schade et al. (1995, 1996A) who find a similar proportion (14%). All of the [OII] emitting ‘ellipticals’ in Figure 3 (and one extra with ) correspond to galaxies with and the (strongest ) is the bluest (, ). We hypothesise these do not correspond to local ellipticals since the latter are reasonably accounted for by the red end of the distribution. Note that PBZ use a faint end slope for their elliptical luminosity function of , if the slope is flattened to as used in Glazebrook et al. (1995C) the primary effect is to increase the normalisation of the model curves by % and bluen the median colours by 0.2 magnitude (due to the slightly lower mean redshift). This change does not affect these arguments.
-
3.
The spiral distribution agrees in mean colour and normalisation with the model predictions, shifting bluewards by magnitudes compared to the non-evolving SED prediction. However this shift is smaller ( mag) relative to the non-evolving PBZ prediction so it is not clear how significant this is. The blue tail of the distribution is now better matched, though the range of colours in the data is still slightly broader than the model prediction. The discrepancy is quite significant. This implies to us that real spirals have a more complex distribution of star-formation histories, or of metallicity or extinction, than in these simple single-history models.
-
4.
The Irregular/Peculiar class are the most interesting in that the show a surprisingly broad distribution of colours. In the models they are only represented by galaxies which are very blue. The model curves in Figure 5(d) show two blue peaks. The first peak at is due to the model Sdm galaxies and the second one at is due to the vB class. In contrast the data extends out to galaxies with . Visual inspection of all Irr/Pec galaxies with show that they do indeed belong in this class. Examination of their position in the Asymmetry-Concentration diagram of Abraham et al. (1996A) shows the red Irr/Pec galaxies are not very different from the blue Irr/Pec galaxies. There is also no large K-correction effects which may be making the colours redder — the inset to Figure 5(d) shows the model which is not too different from our measured redshifts of these galaxies at this magnitude in Section 2. This may not be so convincing since the solid histogram in Figure 5 shows we only succeeded in getting redshifts for the bluer galaxies. However the large ground-based Canada-France Redshift Survey (Lilly et al. 1995) was selected to and of galaxies the maximum redshift was only . Sdm galaxies can be as red as for but in this case they would have to be 1–2 magnitudes more luminous. The ‘eternally young’ population is so blue it has even out to . We argue that the most likely explanation is that a simple representation of this morphologically peculiar population as a population of ‘eternally young’ (or even Sdm type) star-forming galaxies is over-simplistic. The redder galaxies can be better matched with an older population — this is demonstrated in Figure 5 by showing the prediction for an arbitrary ‘eternally middle-aged’ population of age 5 Gyr post-starburst, which gives a much better match to the spread of colours. While of course this is an merely illustrative it is clear that the Irr/Pec population must be made of galaxies with a spread of age (at least 0–5 Gyr) unless they were very unusual in metallicity or dust. In the latter case to match the red end of the histogram an extinction of mags is required. However since the sample is selected in the -band applying this amount of extinction to the galaxy luminosities reduces the space density by a factor of . Thus many more galaxies are required to match the counts. Of course this could in principle by compensated for by making the underlying luminosity of the dusty galaxies much greater. Finally we note that between from 5 to 10 Gyr ( to ) a pure starburst would fade by mags in the bands so should be seen in the local luminosity function in the absence of other effects (a point explored in more detail by Bouwens & Silk, 1996).
5 THE SURFACE BRIGHTNESS OF FAINT GALAXIES


A counterpoint to the suggestions that the faint blue galaxy population may be low-luminosity has been the suggestion that they may constitute a low surface brightness population. This is a natural hypothesis because the deep CCD surveys which uncover the faint blue galaxies also go to fainter limiting surface brightnesses (McGaugh et al. 1994). However it is difficult to test due to isophotal effects. In a given survey while surface brightness may be subject to dimming with redshift (plus K-corrections) this will also cause the area of a galaxy above a fixed observed isophote to shrink. Thus only the inner parts of the galaxy are sampled which can lead to an increase in isophotal surface brightness.
One approach, as adopted by Schade et al. (1995, 1996A, 1996B) is to try and fit theoretical profile models to the galaxy images — once the central surface brightness and scale length is fitted a total magnitude for the model can be calculated. Of course this requires that the galaxy profile follows a simple form.
In our analysis of the MDS data we adopt an orthogonal approach based on the work of Abraham et al. (1996A) — we compute a simple parameter (the isophotal surface brightness) and compare against artificially-redshifted local galaxy templates using the same parameter to allow for the aforementioned selection effects. The sample we use is that of Frei et al. (1996), who chose galaxies which were bright, well-resolved and covered a wide range of morphological classes. The luminosities range from to , peaking around , thus approximating quite well the range of luminosities seen in faint magnitude-selected samples (Brinchmann et al., 1997).
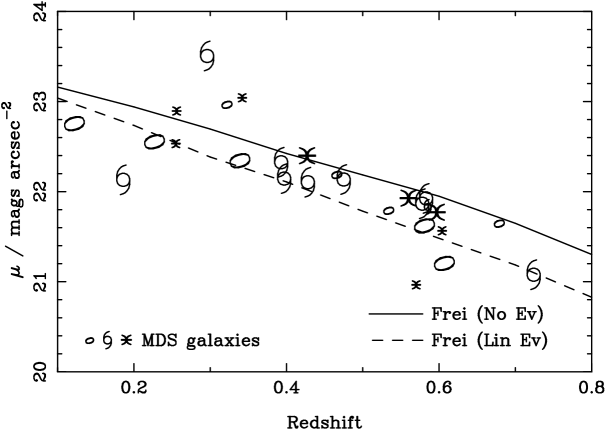
In the artificial redshifting procedure a spectral energy distribution is assigned to each part of the galaxy, it’s image in the F814W filter at the appropriate redshift is computed and the image is binned up and noise is added so it is simulated as observed with HST. Optionally we scale the galaxy flux to crudely allow for a simple linear brightness evolution (). Finally we measure the mean surface brightness above a fixed isophote of which is approximately twice the typical noise level in the MDS data. This allows us to make a differential comparison between the MDS galaxies and the local galaxies as they would be viewed by HST at the same redshift with a minimum of modeling uncertainty.
Figures 6(a) and 6(b) shows examples of this at and (with and without evolution). We plot the isophotal surface brightness versus absolute magnitude, for Frei and MDS galaxies (the MDS galaxies plotted are those within in redshift). Empirically we find that at any particular redshift over the Frei relation is well defined by a constant surface brightness plus scatter over the sample’s luminosity range — this was expected because the local Frei sample is simply selected from the NGC catalog and will follow a Freeman (1970) type law. Thus we can represent the Frei value by a median value for any particular redshift and evolutionary scenario. Note in the calculation of the median we exclude Frei galaxies which fall beyond the MDS limit. Thus the calibration sample exhibits the same bias to more luminous galaxies at higher redshifts as the MDS. In practice however we found this exclusion makes no difference to the final result as the galaxies have similar surface brightnesses (as can be seen in Figures 6(a) and (b)).
This leads us to Figure 6(c) which plots the median of the Frei sample against redshift (both with and without evolution) and compares with the MDS galaxies. It can be seen that the MDS galaxies are consistently brighter than their local counterparts for . Comparing with the arbitrarily evolved local counterparts (whose evolution amounts to 2 magnitudes at ) we estimate that typically the amount of evolution in the MDS galaxies is about half this — i.e. about 1 magnitude by . This can also be seen directly in the redshift slice shown in Figure 6(b). This conclusion still holds when considering the high-completeness sub-sample and we conclude we are seeing a genuine evolutionary effect providing the Frei sample is representative of local galaxies.
The amount of this brightening is the same as found by Schade et al. from their fitting method, like Schade et al. we also find the brightening appears to apply to objects of all morphologies.
6 CONCLUSIONS
We conclude:
-
1.
The faint-blue galaxy excess to is not due to nearby under-luminous galaxies being revealed by faint surveys, rather that many of the objects are observed to be close to . This is true for all morphological classes. Thus, for example, we can not simply explain the excess of peculiar systems by a uniform population of low-luminosity dwarf galaxies being revealed by deep surveys.
-
2.
A significant component of the blue excess () is composed of compact blue objects originally classified as ‘ellipticals’. These are provisionally identified with the ‘Blue Nucleated Galaxies’ of Schade et al. (1995, 1996).
-
3.
The red envelope of the population of compact objects at accounts for the number of elliptical galaxies we see today.
-
4.
We see tentative evidence for some mild colour evolution in the population of spiral galaxies though it is not clear how significant this is given the uncertainty in the models, and overall broader range of colours than exhibited by the models.
-
5.
The galaxies in the Irr/Peculiar morphological class can not simply be represented by a simple population of very young blue galaxies. Rather the broad distribution of blue and red colours indicate a range of ages (0–5 Gyr), if interpreted as stellar populations, or luminous dusty galaxies with extinctions of up to 3 mags in the -band. We conclude that models such as those of Pozzetti et al. or Gronwall & Koo (1995) are too simplistic. This adds to the other known problem with these types of model — the predicted overabundance of low-luminosity galaxies at (Bouwens & Silk, 1996). The properties and evolution of the very late-type galaxies is clearly not well understood yet.
-
6.
The line-luminosities in [OII] indicate significant amounts of star-formation is occurring at , primarily in the late-type Irr/Pec population but also in the spirals and blue ‘ellipticals’.
-
7.
The surface brightness relation shows no evidence that any of the faint morphological populations are of anomalously low surface brightness. Rather we confirm the result of Schade et al. (1995, 1996A, 1996B), from a completely different non-parametric method (comparison with the artificially-redshifted Frei et al. local sample), of evidence for about 1 magnitude evolution towards a higher surface brightness, in all morphological classes, for .
-
8.
There is a lack of success in measuring the redshifts for the redder peculiar systems, so it is difficult to constrain them in any way. It is entirely possible they may be anomalous in luminosity, redshift or surface brightness. However it is clear that the peculiar population is not homogeneous and this must be accounted for in any realistic evolutionary model. A spectroscopic campaign targeted at these red objects would of immense value in understanding the population of peculiar objects revealed in faint HST images.
It is obvious that larger samples with spectroscopy and HST imaging are desirable to further this work; with the advent of large HST imaging programmes in Cycles 6 and 7 samples of several hundred objects are becoming available (e.g. Brinchmann et al.. 1997). Also the spectral synthesis models are being improved (e.g. the ‘BC96’ Bruzual and Charlot code, in preparation) and it will be possible to include in the models effects such as varying metallicity. With very deep multi-colour HST images there is also the possibility of looking at the star-formation history of different portions of an individual galaxy (Abraham et al.. 1997). It is clear that in the next few years a much more detailed understanding of the evolution and properties of the faint galaxy populations will be achieved.
7 ACKNOWLEDGEMENTS
The authors thank Stefan Charlot for his generosity in making his 1995 spectral synthesis code available to us. This paper is based on observations with the NASA/ESA Hubble Space Telescope, obtained at the Space Telescope Science Institute, which is operated by the Association of Universities for Research in Astronomy Inc., under NASA contract NAS5-26555. Coordination and analysis of data from the Medium Deep Survey is funded by STScI grants GO2684.0X.87A and GO3917.OX.91A. We also gratefully acknowledge the generous allocations of telescope time on the UK Infrared Telescope, operated by the Royal Observatory Edinburgh and the William Herschel Telescope, operated by the Royal Greenwich Observatory in the Spanish Observatorio del Roque de Los Muchachos of the Instituto de Astrofísica de Canarias. We also thank the staff and telescope operators of these telescopes for their enthusiasm and competent support. The data reduction and analysis was performed primarily with computer hardware supplied by STARLINK. All the authors acknowledge funding for this research from the PPARC.
References
- [1]
- [2]
- [3] Abraham R. G., van den Bergh, S., Glazebrook K., Ellis R. S., Santiago B. X., Surma P., Griffiths R. E., 1996A, ApJS, 107, 1
- [4]
- [5] Abraham R. G., Tanvir N. R., Santiago B. X., Ellis R. S., Glazebrook K., van den Bergh S., 1996B, MNRAS, 279, L47
- [6]
- [7] Abraham R. G., et al., 1997, in preparation
- [8]
- [9] Allington-Smith J. R., Breare J. M., Ellis R. S., Gellatly D. W., Glazebrook K., Jorden P. R., MacLean J. F., Oates A. P., et al.., 1994, PASP, 106, 983
- [10]
- [11] Bouwens R. J., Silk J., 1996, ApJ, 471, L19
- [12]
- [13] Brinchmann J., et al., 1997, in preparation
- [14]
- [15] Broadhurst T. J., Ellis R. S., Shanks T., 1988, MNRAS, 235, 827
- [16]
- [17] Bruzual G., Charlot S., 1993, ApJ, 405, 538
- [18]
- [19] Bruzual G., Charlot S., 1996, ApJ, in press
- [20]
- [21] Colless M. M., Ellis R. S., Taylor K., Shaw G., 1991, MNRAS, 253, 686
- [22]
- [23] Cowie L. L, Gardner J. P., Hu E. M., Songalia A., Hodapp K. W., Wainscoat R. J., 1994, ApJS, 94, 461
- [24]
- [25] Cowie L. L., Songalia A., Hu E. M., 1996. ApJ, in press
- [26]
- [27] Driver S. P., Windhorst R. A., Griffiths R. E., 1995, ApJ, 453, 48
- [28]
- [29] Efstathiou G., Ellis R. S., Peterson B. A., 1988, MNRAS 232, 431
- [30]
- [31] Ellis R. S., 1997, Annu. Rev. Astron. Astrophys., 35.
- [32]
- [33] Ellis R. S., Colless M. M., Broadhurst T. J., Heyl J., Glazebrook K., 1996, MNRAS, 280, 235
- [34]
- [35] Freeman K., 1970, ApJ, 160, 811
- [36]
- [37] Frei Z., Guhathakurta P., Gunn J. E., 1996, Astron. J., 111, 174
- [38]
- [39] Glazebrook K., Ellis R. S., Colless M. M, Broadhurst T. J., Allington-Smith J. R., Tanvir N. R., 1995A, MNRAS, 273, 157
- [40]
- [41] Glazebrook K., Peacock J. A., Miller L., Collins C. A., 1995B, MNRAS, 275, 169
- [42]
- [43] Glazebrook K., Ellis R. S., Santiago B. X., Griffiths R. E., 1995C, MNRAS, 275, L19
- [44]
- [45] Griffiths R. E., Casertano S., Ratnatunga K. U., Neuschaefer L. W., Ellis R. S., Gilmore G. F., Glazebrook K., Santiago B., Huchra J. P., Windhorst R. A., et al., 1994, ApJ, 435, L19
- [46]
- [47] Gronwall C., Koo D. C., 1995, ApJ, 440, L1
- [48]
- [49] Kennicutt R. C., 1992, ApJ, 388, 310
- [50]
- [51] Lilly S. J., Le Fevre O., Crampton. D., Hammer F.,Tresse L., 1995, ApJ, 455, 50
- [52]
- [53] Loveday J., Peterson B. A., Efstathiou G., Maddox S. J., 1992. ApJ, 390, 338
- [54]
- [55] McGaugh S. S., 1994, Nat, 367, 538
- [56]
- [57] Schade D. J., Lilly S. J., Hammer F., Le Fevre O., Crampton D., Tresse L., 1995, ApJ 455, L1
- [58]
- [59] Schade D. J., Lilly S. J., Crampton D., Hammer F., Le Fevre O., 1996A, ApJ in press
- [60]
- [61] Schade D. J., Carlberg R. G., Yee H. K. C., López-Cruz, 1996B, ApJ 464, L63.
- [62]
- [63] Pozzetti L., Bruzual G., Zamorani G., 1996, MNRAS, 281, 953 (PBZ)
- [64]
- [65] Wynn C. G., Worswick S. P., 1988, Observatory, 108, 161
- [66]
- [67] Zucca E., Pozzetti L., Zamorani G., 1994, MNRAS 269, 953
- [68]
8 TABLES
TABLE 1. The WHT/LDSS2 Spectroscopic Sample.
| MDS ID | RA | Dec | Q1 | Type2 | [OII] EW | Comment3 | ||||
| ubi1-10 | 0.436 | 01 10 00.98 | -02 28 44.9 | 20.64 | 0.50 | 0.03 | 1 | A | H,K,4000Å break,G | |
| ubi1-8 | No Id | 01 10 00.57 | -02 28 28.4 | 21.66 | 0.42 | 0.00 | 4 | — | Missing? | |
| ubi1-18 | No Id | 01 09 59.94 | -02 28 15.0 | 21.60 | — | — | 4 | — | Missing? | |
| ubi1-24 | 0.065 | 01 09 58.24 | -02 28 05.0 | 20.29 | 0.32 | 0.06 | 1 | E | [OII]?,[OIII],,[NII],[SII] | |
| ubi1-2 | 0.428 | 01 10 00.56 | -02 27 46.6 | 20.64 | 0.33 | 0.00 | 1 | E | [OII],H,K,Mgb | |
| ubi1-43 | No Id | 01 09 56.88 | -02 27 32.0 | 21.97 | 0.36 | 0.01 | 4 | — | Missing? | |
| ubi1-31 | 0.432 | 01 09 58.20 | -02 27 18.7 | 20.24 | 0.33 | 0.19 | 1 | EAB | [OII],,[OII],,H,K,Balmer | |
| ubi1-48 | No Id | 01 09 59.95 | -02 27 04.7 | 20.47 | 0.46 | 0.09 | 3 | — | Weird!!! BAL AGN??? | |
| ubi1-61 | No Id | 01 10 00.50 | -02 26 49.7 | 21.89 | 0.16 | 0.00 | 3 | — | Weak | |
| ubi1-70 | No Id | 01 10 01.23 | -02 26 30.5 | 21.78 | 0.57 | 0.13 | 4 | — | Missing? | |
| ubi1-51 | 0.560 | 01 09 58.50 | -02 26 18.7 | 21.16 | 0.27 | 0.14 | 2 | EAB | [OII],HK?,Balmer?,4000Å break | |
| ubi1-68 | No Id | 01 10 01.16 | -02 26 05.6 | 21.60 | 0.26 | 0.08 | 4 | — | Missing? | |
| ubi1-55 | 0.427 | 01 09 58.87 | -02 25 56.7 | 20.45 | 0.23 | 0.05 | 1 | EA | [OII],?,[OII]?,H,K,G | |
| uim0-11 | 0.597 | 03 55 31.50 | 09 42 15.1 | 21.23 | 0.23 | 0.32 | 1 | E | [OII],[OIII],?,HK? | |
| uim0-10 | No Id | 03 55 31.34 | 09 42 29.0 | 21.55 | 0.19 | 0.06 | 3 | — | Weak | |
| uim0-9 | 0.679 | 03 55 31.13 | 09 42 41.1 | 21.51 | 0.46 | 0.00 | 2 | EA | [OII],H,K | |
| uim0-1 | 0.339 | 03 55 33.45 | 09 43 01.8 | 20.40 | 0.50 | 0.04 | 1 | A | K,H,4000Å break,G,,Mgb,5268 | |
| uim0-18 | No Id | 03 55 29.22 | 09 43 27.9 | 20.89 | 0.20 | 0.17 | 3 | — | Em line?? | |
| uim0-30 | No Id | 03 55 28.49 | 09 43 40.6 | 21.29 | 0.36 | 0.06 | 3 | — | Weak | |
| uim0-28 | 0.466 | 03 55 28.54 | 09 43 53.8 | 21.73 | 0.49 | 0.02 | 2 | A | H,K,4000Å break,[OII]? | |
| uim0-37 | No Id | 03 55 31.53 | 09 44 12.9 | 21.48 | 0.43 | 0.04 | 3 | — | Weak | |
| uim0-38 | 0.475 | 03 55 31.52 | 09 44 23.5 | 20.79 | 0.31 | 0.17 | 1 | EAB | [OII],H,K,Balmer,G,?,[OIII]? | |
| uim0-43 | 0.724 | 03 55 34.03 | 09 44 41.4 | 20.59 | 0.53 | 0.05 | 1 | EAB | H,K,G,Balmer,unk 3594 | |
| uim0-42 | 0.256 | 03 55 32.00 | 09 44 59.4 | 21.74 | 0.30 | 0.03 | 1 | E | [OII],,[OIII],,HK? | |
| ueh0-33 | 0.393 | 00 53 20.73 | 12 33 07.0 | 21.26 | 0.33 | 0.06 | 2 | EAB | [OII],HK?,Balmer? | |
| ueh0-35 | 0.578 | 00 53 20.45 | 12 33 20.2 | 21.37 | 0.25 | 0.14 | 1 | EAB | [OII],strong Balmer,4000Å break,[OII] | |
| ueh0-27 | 0.581 | 00 53 23.03 | 12 33 32.1 | 20.75 | 0.54 | 0.02 | 1 | EAB | [OII],HK,4000Å break,Balmer | |
| ueh0-34 | 0.534 | 00 53 21.17 | 12 33 50.1 | 21.61 | 0.42 | 0.00 | 2 | EAB | [OII]?,HK,4000Å break,G,Balmer | |
| ueh0-43 | 0.585 | 00 53 23.68 | 12 34 17.0 | 21.57 | 0.30 | 0.05 | 1 | EAB | [OII],,HK,Balmer | |
| ueh0-54 | No Id | 00 53 21.54 | 12 34 29.8 | 21.96 | — | — | 3 | — | Weak | |
| ueh0-49 | 0.583 | 00 53 23.57 | 12 34 45.3 | 20.75 | 0.32 | 0.05 | 1 | EAB | [OII],HK,G,Balmer | |
| ueh0-51 | No Id | 00 53 22.42 | 12 35 05.3 | 21.91 | 0.36 | 0.00 | 3 | — | Weak | |
| ueh0-55 | No Id | 00 53 21.18 | 12 35 17.9 | 21.81 | 0.31 | 0.17 | 3 | — | Weak maybe z=1.383 MgII,MgI? | |
| usa0-15 | 0.604 | 17 12 19.41 | 33 35 18.4 | 21.74 | 0.42 | 0.20 | 1 | E | [OII],,[OIII] | |
| usa0-93 | No Id | 17 12 27.48 | 33 35 30.1 | 20.95 | 0.65 | 0.11 | 3 | — | Too faint | |
| usa0-90 | No Id | 17 12 27.76 | 33 35 42.1 | 21.60 | 0.43 | 0.42 | 3 | — | Bright, featureless | |
| usa0-91 | No Id | 17 12 29.68 | 33 36 19.1 | 22.00 | 0.34 | 0.06 | 3 | — | Too faint | |
| usa0-69 | 0.296 | 17 12 24.83 | 33 37 03.8 | 20.00 | 0.20 | 0.90 | 1 | EAB | [OII],,[OIII],,HK,Balmer | |
| usa0-66 | 0.342 | 17 12 22.11 | 33 37 17.7 | 21.84 | 0.24 | 0.08 | 1 | EAB | [OII],,[OIII],HK,G,Balmer | |
| usa0-57 | 0.255 | 17 12 25.88 | 33 36 36.1 | 21.99 | 0.46 | 0.06 | 1 | E | [OII],,[OIII],,? | |
| ux40-108 | 0.227 | 15 19 37.96 | 23 50 51.7 | 17.53 | 0.64 | 0.04 | 1 | A | H,K,G,Mgb,NaD | |
| ux40-102 | 0.322 | 15 19 39.15 | 23 51 06.5 | 21.54 | 0.46 | 0.01 | 1 | EAB | [OII]?,,[OIII],,HK,Balmer | |
| ux40-116 | 0.000 | 15 19 40.49 | 23 51 26.89 | 20.54 | 0.82 | 0.01 | 1 | S | M star | |
| ux40-114 | No Id | 15 19 40.49 | 23 51 26.9 | 21.86 | 0.72 | 0.01 | 3 | — | Featureless | |
| ux40-51 | No Id | 15 19 42.45 | 23 51 57.0 | 21.54 | 0.46 | 0.06 | 3 | — | Possible MgII,MgI at z=1.202? | |
| ux40-83 | 0.570 | 15 19 43.30 | 23 52 13.2 | 21.64 | 0.75 | 0.04 | 2 | EAB | [OIII]?,HK?,Balmer? | |
| ux40-3 | 0.607 | 15 19 40.62 | 23 52 21.6 | 19.79 | 0.39 | 0.17 | 2 | EA | [OII]?,?,HK?,Mgb? | |
| ux40-19 | No Id | 15 19 41.92 | 23 52 33.3 | 21.99 | 0.35 | 0.04 | 3 | — | Too faint | |
| ux40-27 | 0.397 | 15 19 42.94 | 23 52 46.2 | 20.05 | 0.28 | 0.17 | 1 | EAB | [OII],,[OIII],HK,Balmer | |
| ux40-7 | 0.186 | 15 19 38.86 | 23 53 02.1 | 18.91 | 0.43 | 0.16 | 1 | EAB | [OII],,[OIII],,[NII],[SII],HK, Balmer,G,Mgb | |
| ux40-26 | No Id | 15 19 41.29 | 23 53 13.0 | 21.29 | 0.19 | 0.02 | 3 | — | Too faint | |
| ux40-28 | 0.122 | 15 19 40.85 | 23 53 33.8 | 18.11 | 0.60 | 0.12 | 1 | EAB | [OII],,[OIII],,[NII],[SII],HK, Balmer,Mgb,OI(6300),7267 |
-
1.
Redshift Quality values: High confidence, normal confidence, No identification, No signal in spectrum.
-
2.
Type symbols: EEmission lines present, AAbsorption lines present, BBalmer series present (A star signature).
-
3.
In comments: emission feature, absorption feature.
TABLE 2. -band UKIRT Photometry.
| MDS ID | RA | Dec | ||||
| u3p0-2 | 07 00 00.68 | 14 09 28.7 | 21.97 | No signal | 0.38 | 0.01 |
| u3p0-3 | 07 00 00.31 | 14 09 30.4 | 22.38 | — | — | |
| u3p0-4 | 06 59 58.64 | 14 09 42.2 | 24.90 | No signal | — | — |
| u3p0-5 | 06 59 57.94 | 14 09 27.6 | 21.42 | 0.56 | 0.00 | |
| u3p0-7 | 06 59 58.83 | 14 09 35.5 | 99.99 | No signal | — | — |
| u3p0-8 | 06 59 58.20 | 14 09 26.5 | 99.99 | — | — | |
| u3p0-9 | 06 59 59.59 | 14 09 09.4 | 21.65 | 0.29 | 0.95 | |
| u3p0-10 | 06 59 58.22 | 14 09 23.6 | 23.47 | — | — | |
| u3p0-13 | 06 59 59.52 | 14 09 33.0 | 25.35 | No signal | — | — |
| u3p0-14 | 06 59 57.30 | 14 09 55.8 | 24.89 | — | — | |
| u3p0-15 | 06 59 58.23 | 14 09 20.1 | 22.38 | — | — | |
| u3p0-16 | 06 59 58.70 | 14 09 07.5 | 23.40 | — | — | |
| u3p0-17 | 06 59 56.94 | 14 10 22.5 | 21.43 | 0.23 | 0.13 | |
| u3p0-18 | 06 59 55.01 | 14 10 07.5 | 20.76 | 0.48 | 0.04 | |
| u3p0-19 | 06 59 55.47 | 14 10 19.4 | 19.53 | — | — | |
| u3p0-20 | 06 59 55.94 | 14 10 26.6 | 23.51 | — | — | |
| u3p0-21 | 06 59 56.19 | 14 10 33.1 | 21.55 | 0.40 | 0.06 | |
| u3p0-22 | 06 59 54.83 | 14 10 16.8 | 24.21 | — | — | |
| u3p0-23 | 06 59 54.34 | 14 10 16.9 | 22.25 | — | — | |
| u3p0-24 | 06 59 54.13 | 14 10 24.4 | 24.23 | — | — | |
| u3p0-25 | 06 59 53.94 | 14 10 21.8 | 23.60 | — | — | |
| u3p0-26 | 06 59 55.30 | 14 10 51.2 | 20.89 | 0.31 | 0.02 | |
| u3p0-27 | 06 59 55.59 | 14 10 56.8 | 22.26 | — | — | |
| u3p0-28 | 06 59 53.96 | 14 10 43.9 | 24.22 | — | — | |
| u3p0-30 | 06 59 55.63 | 14 09 52.2 | 23.80 | — | — | |
| u3p0-31 | 06 59 57.77 | 14 10 33.8 | 21.76 | 0.23 | 0.02 | |
| u3p0-32 | 06 59 56.99 | 14 10 26.0 | 22.54 | — | — | |
| u3p0-33 | 06 59 55.28 | 14 09 59.1 | 22.24 | — | — | |
| u3p0-35 | 06 59 54.22 | 14 10 02.9 | 24.05 | — | — | |
| u3p0-36 | 06 59 54.92 | 14 10 43.0 | 28.20 | — | — | |
| u3p0-37 | 06 59 54.00 | 14 10 32.8 | 25.28 | No signal | — | — |
| u3p0-38 | 06 59 54.09 | 14 10 37.9 | 24.82 | — | — | |
| u3p0-39 | 06 59 54.22 | 14 10 49.2 | 23.59 | — | — | |
| u3p0-40 | 06 59 56.20 | 14 10 12.5 | 23.49 | No signal | — | — |
| u3p0-42 | 06 59 53.89 | 14 10 54.9 | 22.63 | No signal | — | — |
| u3p0-46 | 06 59 58.46 | 14 11 08.3 | 20.84 | — | — | |
| u3p0-52 | 06 59 57.13 | 14 11 00.2 | 21.90 | — | — | |
| u3p0-53 | 06 59 57.92 | 14 10 49.4 | 21.99 | — | — | |
| u3p0-54 | 06 59 57.14 | 14 11 04.7 | 99.99 | No signal | — | — |
| u3p0-55 | 06 59 58.69 | 14 10 48.3 | 23.95 | — | — | |
| ubi1-1 | 01 10 02.73 | -02 27 52.0 | 20.10 | 0.34 | 0.38 | |
| ubi1-2 | 01 10 00.56 | -02 27 46.6 | 20.64 | 0.33 | 0.00 | |
| ubi1-3 | 01 10 03.37 | -02 28 25.4 | 20.81 | 0.18 | 0.16 | |
| ubi1-4 | 01 10 00.38 | -02 28 05.2 | 22.05 | — | — | |
| ubi1-5 | 01 10 00.48 | -02 28 11.2 | 21.94 | No signal | 0.28 | 0.06 |
| ubi1-6 | 01 10 00.03 | -02 28 19.5 | 19.31 | 0.15 | 0.26 | |
| ubi1-7 | 01 10 01.75 | -02 28 36.0 | 20.97 | 0.28 | 0.08 | |
| ubi1-8 | 01 10 00.57 | -02 28 28.4 | 21.66 | 0.42 | 0.00 | |
| ubi1-9 | 01 10 02.19 | -02 28 44.0 | 20.83 | 0.48 | 0.00 | |
| ubi1-10 | 01 10 00.98 | -02 28 44.9 | 20.64 | 0.50 | 0.03 | |
| ubi1-11 | 01 10 00.95 | -02 28 18.1 | 21.54 | 0.35 | 0.06 | |
| ubi1-12 | 01 10 00.73 | -02 28 18.6 | 22.54 | — | — | |
| ubi1-13 | 01 10 01.42 | -02 27 39.8 | 22.16 | — | — | |
| ubi1-14 | 01 10 03.21 | -02 28 05.9 | 22.73 | — | — | |
| ubi1-15 | 01 10 02.69 | -02 28 09.8 | 22.62 | No signal | — | — |
| ubi1-16 | 01 09 59.68 | -02 28 00.4 | 22.58 | — | — | |
| ubi1-17 | 01 10 02.23 | -02 28 27.3 | 22.27 | — | — | |
| ubi1-18 | 01 09 59.94 | -02 28 15.0 | 21.60 | — | — | |
| ubi1-19 | 01 10 01.50 | -02 28 28.1 | 22.69 | — | — | |
| ubi1-20 | 01 10 00.98 | -02 28 30.4 | 23.48 | — | — | |
| ubi1-21 | 01 10 01.21 | -02 28 32.1 | 23.97 | — | — | |
| ubi1-22 | 01 10 00.84 | -02 28 14.2 | 24.65 | No signal | — | — |
| ubi1-23 | 01 10 01.07 | -02 28 28.1 | 22.97 | No signal | — | — |
| ubi1-24 | 01 09 58.24 | -02 28 05.0 | 20.29 | 0.32 | 0.06 | |
| ubi1-25 | 01 09 58.18 | -02 27 56.3 | 22.83 | — | — | |
| ubi1-26 | 01 09 58.41 | -02 27 45.5 | 22.38 | — | — | |
| ubi1-27 | 01 09 57.38 | -02 28 06.2 | 20.18 | 0.26 | 0.05 | |
| ubi1-28 | 01 09 58.07 | -02 27 40.0 | 20.12 | 0.33 | 0.10 | |
| ubi1-29 | 01 09 58.47 | -02 27 23.8 | 19.67 | 0.29 | 0.11 | |
| ubi1-30 | 01 09 58.31 | -02 27 27.5 | 21.59 | 0.48 | 0.00 | |
| ubi1-31 | 01 09 58.20 | -02 27 18.7 | 20.24 | — | — | |
| ubi1-32 | 01 09 57.25 | -02 27 34.9 | 18.92 | 0.35 | 0.27 | |
| ubi1-33 | 01 09 56.24 | -02 27 51.2 | 22.57 | — | — | |
| ubi1-34 | 01 09 56.02 | -02 27 17.9 | 22.24 | — | — | |
| ubi1-35 | 01 09 55.68 | -02 27 14.2 | 20.97 | 0.28 | 0.07 | |
| ubi1-36 | 01 09 58.57 | -02 27 56.5 | 22.60 | — | — | |
| ubi1-37 | 01 09 58.98 | -02 27 42.0 | 22.13 | No signal | — | — |
| ubi1-38 | 01 09 59.15 | -02 27 26.9 | 22.55 | — | — | |
| ubi1-39 | 01 09 57.95 | -02 27 55.2 | 22.07 | — | — | |
| ubi1-40 | 01 09 57.76 | -02 27 56.7 | 23.55 | No signal | — | — |
| ubi1-41 | 01 09 58.51 | -02 27 37.2 | 22.44 | No signal | — | — |
| ubi1-42 | 01 09 58.33 | -02 27 38.4 | 22.68 | No signal | — | — |
| ubi1-43 | 01 09 56.88 | -02 27 32.0 | 21.97 | 0.36 | 0.01 | |
| ubi1-44 | 01 09 57.61 | -02 27 02.8 | 21.60 | 0.25 | 0.11 | |
| ubi1-45 | 01 09 57.08 | -02 26 56.9 | 21.37 | 0.24 | 0.00 | |
| ubi1-46 | 01 09 58.74 | -02 27 42.3 | 22.59 | — | — | |
| ubi1-47 | 01 09 55.41 | -02 27 28.0 | 22.86 | No signal | — | — |
| ubi1-48 | 01 09 59.95 | -02 27 04.7 | 20.47 | 0.46 | 0.09 | |
| ubi1-49 | 01 09 57.70 | -02 26 23.1 | 21.86 | 0.29 | 0.02 | |
| ubi1-50 | 01 09 58.86 | -02 26 23.9 | 19.57 | 0.62 | 0.03 | |
| ubi1-51 | 01 09 58.50 | -02 26 18.7 | 21.16 | 0.27 | 0.14 | |
| ubi1-52 | 01 10 00.25 | -02 26 23.6 | 22.07 | — | — | |
| ubi1-53 | 01 09 59.78 | -02 26 15.1 | 22.09 | No signal | — | — |
| ubi1-54 | 01 10 00.96 | -02 26 22.8 | 22.12 | — | — | |
| ubi1-55 | 01 09 58.87 | -02 25 56.7 | 20.45 | 0.23 | 0.05 | |
| ubi1-56 | 01 10 01.04 | -02 26 13.4 | 20.43 | 0.38 | 0.10 | |
| ubi1-58 | 01 09 59.60 | -02 26 57.8 | 21.94 | 0.16 | 0.05 | |
| ubi1-59 | 01 10 00.57 | -02 27 01.1 | 22.17 | — | — | |
| ubi1-60 | 01 10 00.42 | -02 26 54.3 | 22.09 | — | — | |
| ubi1-61 | 01 10 00.50 | -02 26 49.7 | 21.89 | 0.16 | 0.00 | |
| ubi1-62 | 01 09 58.66 | -02 26 25.1 | 20.69 | 0.25 | 0.00 | |
| ubi1-63 | 01 10 01.59 | -02 26 39.9 | 21.64 | 0.28 | 0.02 | |
| ubi1-64 | 01 10 01.03 | -02 26 29.7 | 20.89 | — | — | |
| ubi1-65 | 01 09 59.49 | -02 26 16.6 | 21.54 | 0.47 | 0.02 | |
| ubi1-66 | 01 10 01.65 | -02 26 28.6 | 22.63 | — | — | |
| ubi1-67 | 01 10 02.29 | -02 26 16.7 | 20.74 | 0.23 | 0.07 | |
| ubi1-68 | 01 10 01.16 | -02 26 05.6 | 21.60 | 0.26 | 0.08 | |
| ubi1-69 | 01 10 00.96 | -02 26 30.1 | 20.95 | 0.26 | 0.08 | |
| ubi1-71 | 01 10 00.34 | -02 26 11.1 | 25.93 | — | — | |
| ueh0-2 | 00 53 24.41 | 12 33 50.3 | 20.58 | 0.28 | 0.09 | |
| ueh0-7 | 00 53 24.12 | 12 33 01.3 | 22.86 | — | — | |
| ueh0-9 | 00 53 24.83 | 12 32 51.3 | 22.86 | No signal | — | — |
| ueh0-11 | 00 53 24.70 | 12 32 58.5 | 22.75 | — | — | |
| ueh0-13 | 00 53 24.03 | 12 33 29.1 | 22.88 | — | — | |
| ueh0-16 | 00 53 23.66 | 12 33 15.3 | 22.30 | — | — | |
| ueh0-18 | 00 53 24.63 | 12 33 05.6 | 23.06 | No signal | — | — |
| ueh0-23 | 00 53 24.68 | 12 33 06.4 | 22.88 | — | — | |
| ueh0-24 | 00 53 24.56 | 12 33 01.7 | 99.99 | No signal | — | — |
| ueh0-27 | 00 53 23.03 | 12 33 32.1 | 20.75 | 0.54 | 0.02 | |
| ueh0-28 | 00 53 23.05 | 12 33 53.9 | 20.94 | 0.46 | 0.09 | |
| ueh0-29 | 00 53 21.82 | 12 33 07.4 | 20.71 | 0.49 | 0.08 | |
| ueh0-30 | 00 53 21.73 | 12 33 23.6 | 20.71 | 0.39 | 0.12 | |
| ueh0-31 | 00 53 21.28 | 12 33 23.1 | 22.51 | — | — | |
| ueh0-32 | 00 53 21.96 | 12 33 57.8 | 22.18 | — | — | |
| ueh0-33 | 00 53 20.73 | 12 33 07.0 | 21.26 | 0.33 | 0.06 | |
| ueh0-34 | 00 53 21.17 | 12 33 50.1 | 21.61 | 0.42 | 0.00 | |
| ueh0-35 | 00 53 20.45 | 12 33 20.2 | 21.37 | 0.25 | 0.14 | |
| ueh0-36 | 00 53 19.83 | 12 33 11.6 | 21.35 | 0.48 | 0.03 | |
| ueh0-37 | 00 53 19.43 | 12 33 44.8 | 22.50 | — | — | |
| ueh0-38 | 00 53 21.74 | 12 33 15.7 | 23.62 | — | — | |
| ueh0-39 | 00 53 20.81 | 12 33 21.9 | 22.93 | — | — | |
| ueh0-40 | 00 53 20.40 | 12 33 44.4 | 22.19 | — | — | |
| ueh0-41 | 00 53 20.51 | 12 33 22.8 | 22.01 | — | — | |
| ueh0-42 | 00 53 20.25 | 12 34 31.3 | 21.25 | 0.21 | 0.08 | |
| ueh0-43 | 00 53 23.68 | 12 34 17.0 | 21.57 | 0.30 | 0.05 | |
| ueh0-44 | 00 53 22.82 | 12 34 25.1 | 22.64 | — | — | |
| ueh0-45 | 00 53 21.41 | 12 34 38.1 | 22.93 | — | — | |
| ueh0-46 | 00 53 23.32 | 12 34 33.6 | 21.29 | 0.27 | 0.05 | |
| ueh0-47 | 00 53 22.86 | 12 34 41.2 | 22.42 | — | — | |
| ueh0-48 | 00 53 20.68 | 12 34 54.7 | 22.29 | — | — | |
| ueh0-49 | 00 53 23.57 | 12 34 45.3 | 20.75 | 0.32 | 0.05 | |
| ueh0-50 | 00 53 20.82 | 12 35 11.3 | 21.61 | 0.20 | 0.09 | |
| ueh0-51 | 00 53 22.42 | 12 35 05.3 | 21.91 | 0.36 | 0.00 | |
| ueh0-52 | 00 53 23.79 | 12 35 00.1 | 23.04 | — | — | |
| ueh0-53 | 00 53 22.48 | 12 35 13.1 | 21.87 | 0.23 | 0.01 | |
| ueh0-54 | 00 53 21.54 | 12 34 29.8 | 21.96 | — | — | |
| ueh0-55 | 00 53 21.18 | 12 35 17.9 | 21.81 | 0.31 | 0.17 | |
| ueh0-56 | 00 53 20.98 | 12 34 34.2 | 23.08 | — | — | |
| ueh0-57 | 00 53 23.59 | 12 34 53.7 | 22.35 | No signal | — | — |
| uim0-1 | 03 55 33.45 | 09 43 01.8 | 20.40 | 0.50 | 0.04 | |
| uim0-2 | 03 55 33.60 | 09 42 46.9 | 22.10 | — | — | |
| uim0-3 | 03 55 31.99 | 09 43 04.7 | 22.06 | — | — | |
| uim0-4 | 03 55 32.56 | 09 42 53.7 | 22.89 | No signal | — | — |
| uim0-5 | 03 55 31.72 | 09 42 57.2 | 21.93 | — | — | |
| uim0-6 | 03 55 32.34 | 09 42 46.9 | 22.09 | — | — | |
| uim0-7 | 03 55 33.07 | 09 42 32.8 | 21.56 | 0.48 | 0.03 | |
| uim0-8 | 03 55 31.78 | 09 42 45.9 | 20.14 | 0.48 | 0.02 | |
| uim0-9 | 03 55 31.13 | 09 42 41.1 | 21.51 | 0.46 | 0.00 | |
| uim0-10 | 03 55 31.34 | 09 42 29.0 | 21.55 | 0.19 | 0.06 | |
| uim0-11 | 03 55 31.50 | 09 42 15.1 | 21.23 | 0.23 | 0.32 | |
| uim0-12 | 03 55 33.29 | 09 43 08.0 | 22.40 | — | — | |
| uim0-13 | 03 55 34.31 | 09 42 23.6 | 22.11 | — | — | |
| uim0-14 | 03 55 34.06 | 09 42 18.8 | 22.79 | — | — | |
| uim0-15 | 03 55 33.74 | 09 42 18.8 | 21.76 | — | — | |
| uim0-16 | 03 55 32.44 | 09 42 39.4 | 22.96 | No signal | — | — |
| uim0-17 | 03 55 30.58 | 09 43 23.3 | 22.23 | — | — | |
| uim0-18 | 03 55 29.22 | 09 43 27.9 | 20.89 | 0.20 | 0.17 | |
| uim0-19 | 03 55 29.86 | 09 43 43.5 | 19.80 | 0.30 | 0.06 | |
| uim0-20 | 03 55 29.33 | 09 43 44.8 | 21.98 | — | — | |
| uim0-21 | 03 55 28.79 | 09 43 37.0 | 22.11 | — | — | |
| uim0-22 | 03 55 28.05 | 09 43 26.2 | 22.19 | — | — | |
| uim0-23 | 03 55 28.51 | 09 43 34.5 | 22.57 | — | — | |
| uim0-24 | 03 55 28.04 | 09 43 30.6 | 22.00 | — | — | |
| uim0-25 | 03 55 29.29 | 09 44 01.0 | 20.33 | 0.50 | 0.04 | |
| uim0-26 | 03 55 27.35 | 09 43 29.7 | 21.99 | 0.25 | 0.00 | |
| uim0-27 | 03 55 28.01 | 09 43 43.3 | 21.73 | 0.16 | 0.13 | |
| uim0-28 | 03 55 28.54 | 09 43 53.8 | 21.73 | 0.49 | 0.02 | |
| uim0-29 | 03 55 28.27 | 09 43 40.1 | 20.97 | 0.21 | 0.90 | |
| uim0-30 | 03 55 28.49 | 09 43 40.6 | 21.29 | 0.36 | 0.06 | |
| uim0-31 | 03 55 27.98 | 09 43 34.8 | 22.07 | — | — | |
| uim0-32 | 03 55 29.05 | 09 43 46.7 | 23.32 | No signal | — | — |
| uim0-33 | 03 55 30.66 | 09 44 18.5 | 21.83 | No signal | 0.20 | 0.08 |
| uim0-34 | 03 55 31.05 | 09 44 14.0 | 21.76 | 0.22 | 0.49 | |
| uim0-35 | 03 55 32.01 | 09 44 03.9 | 22.44 | — | — | |
| uim0-36 | 03 55 31.12 | 09 44 17.7 | 22.39 | — | — | |
| uim0-37 | 03 55 31.53 | 09 44 12.9 | 21.48 | 0.43 | 0.04 | |
| uim0-38 | 03 55 31.52 | 09 44 23.5 | 20.79 | 0.31 | 0.17 | |
| uim0-39 | 03 55 32.72 | 09 44 27.3 | 23.50 | — | — | |
| uim0-40 | 03 55 32.17 | 09 44 45.2 | 22.57 | — | — | |
| uim0-41 | 03 55 33.03 | 09 44 44.0 | 18.62 | 0.44 | 0.13 | |
| uim0-42 | 03 55 32.00 | 09 44 59.4 | 21.74 | 0.30 | 0.03 | |
| uim0-43 | 03 55 34.03 | 09 44 41.4 | 20.59 | 0.53 | 0.05 | |
| uim0-44 | 03 55 32.32 | 09 43 52.3 | 21.98 | 0.25 | 0.04 | |
| uim0-45 | 03 55 31.59 | 09 44 02.7 | 22.44 | — | — | |
| uim0-46 | 03 55 33.03 | 09 43 53.0 | 22.54 | — | — | |
| uim0-47 | 03 55 33.14 | 09 44 15.6 | 22.24 | — | — | |
| uim0-48 | 03 55 32.43 | 09 44 32.6 | 22.06 | — | — | |
| uim0-49 | 03 55 33.52 | 09 44 19.2 | 21.60 | 0.29 | 0.00 | |
| uim0-51 | 03 55 32.89 | 09 44 24.4 | 23.22 | — | — | |
| uim0-52 | 03 55 32.17 | 09 44 37.3 | 22.58 | — | — | |
| umd4-6 | 21 51 06.68 | 29 00 16.5 | 22.97 | No signal | — | — |
| umd4-9 | 21 51 05.61 | 29 00 25.3 | 22.45 | — | — | |
| umd4-12 | 21 51 06.01 | 29 00 27.5 | 22.32 | — | — | |
| umd4-13 | 21 51 05.86 | 29 00 32.5 | 19.42 | 0.31 | 0.08 | |
| umd4-17 | 21 51 05.86 | 29 00 53.2 | 23.51 | No signal | — | — |
| umd4-20 | 21 51 06.06 | 29 01 02.1 | 22.36 | — | — | |
| umd4-21 | 21 51 05.81 | 29 01 02.3 | 23.07 | — | — | |
| umd4-23 | 21 51 06.22 | 29 01 06.0 | 22.64 | — | — | |
| umd4-25 | 21 51 06.68 | 29 01 07.7 | 22.78 | — | — | |
| umd4-28 | 21 51 07.40 | 29 00 15.4 | 23.07 | — | — | |
| umd4-29 | 21 51 07.54 | 29 01 07.0 | 22.11 | — | — | |
| umd4-30 | 21 51 07.57 | 29 00 58.9 | 23.26 | — | — | |
| umd4-31 | 21 51 07.82 | 29 00 27.2 | 22.56 | — | — | |
| umd4-32 | 21 51 07.80 | 29 00 51.7 | 23.29 | No signal | — | — |
| umd4-33 | 21 51 07.88 | 29 01 01.8 | 23.36 | — | — | |
| umd4-34 | 21 51 08.12 | 29 00 18.5 | 23.47 | — | — | |
| umd4-35 | 21 51 08.33 | 29 00 40.4 | 23.08 | — | — | |
| umd4-36 | 21 51 08.31 | 29 00 50.8 | 23.67 | — | — | |
| umd4-37 | 21 51 08.62 | 29 00 00.7 | 24.27 | No signal | — | — |
| umd4-38 | 21 51 08.82 | 29 00 56.8 | 21.26 | 0.42 | 0.08 | |
| umd4-39 | 21 51 08.95 | 29 00 19.3 | 21.81 | 0.34 | 0.07 | |
| umd4-40 | 21 51 09.15 | 29 00 21.0 | 21.66 | 0.39 | 0.04 | |
| umd4-41 | 21 51 09.08 | 29 01 05.2 | 19.92 | 0.30 | 0.15 | |
| umd4-42 | 21 51 08.93 | 29 00 01.4 | 23.34 | No signal | — | — |
| umd4-44 | 21 51 09.37 | 29 00 08.6 | 18.97 | 0.34 | 0.11 | |
| umd4-45 | 21 51 09.92 | 28 59 56.9 | 23.78 | — | — | |
| umd4-46 | 21 51 09.99 | 29 01 01.1 | 23.25 | — | — | |
| umd4-47 | 21 51 10.08 | 29 00 17.8 | 23.97 | No signal | — | — |
| umd4-48 | 21 51 10.13 | 29 00 44.7 | 23.01 | — | — | |
| umd4-49 | 21 51 10.21 | 29 00 00.5 | 24.81 | No signal | — | — |
| umd4-50 | 21 51 10.22 | 29 00 14.2 | 22.73 | — | — | |
| umd4-51 | 21 51 10.52 | 29 00 33.0 | 23.20 | — | — | |
| umd4-52 | 21 51 10.60 | 29 00 15.1 | 22.41 | — | — | |
| umd4-53 | 21 51 11.27 | 29 00 33.8 | 23.30 | No signal | — | — |
| umd4-54 | 21 51 11.65 | 29 00 11.2 | 22.83 | — | — | |
| umd4-58 | 21 51 07.22 | 28 59 51.0 | 23.21 | No signal | — | — |
| umd4-59 | 21 51 09.83 | 28 59 48.4 | 20.31 | 0.41 | 0.04 | |
| umd4-61 | 21 51 10.26 | 28 59 43.7 | 23.21 | No signal | — | — |
| umd4-62 | 21 51 09.10 | 28 59 38.5 | 20.70 | 0.34 | 0.12 | |
| umd4-63 | 21 51 09.79 | 28 59 39.4 | 23.89 | No signal | — | — |
| umd4-64 | 21 51 08.70 | 28 59 30.5 | 23.21 | — | — | |
| umd4-65 | 21 51 08.86 | 28 59 28.2 | 20.98 | 0.36 | 0.05 | |
| umd4-66 | 21 51 07.61 | 28 59 28.7 | 23.11 | No signal | — | — |
| umd4-68 | 21 51 07.19 | 28 59 22.2 | 22.74 | — | — | |
| umd4-69 | 21 51 09.64 | 28 59 18.7 | 23.61 | No signal | — | — |
| umd4-70 | 21 51 10.71 | 28 59 18.8 | 23.97 | — | — | |
| umd4-71 | 21 51 07.89 | 28 59 16.7 | 22.70 | — | — | |
| umd4-72 | 21 51 10.98 | 28 59 15.6 | 21.84 | — | — | |
| umd4-74 | 21 51 09.93 | 28 59 13.7 | 21.38 | 0.28 | 0.12 | |
| umd4-75 | 21 51 07.36 | 28 59 12.3 | 23.15 | — | — | |
| umd4-76 | 21 51 07.34 | 28 59 07.1 | 21.27 | — | — | |
| umd4-77 | 21 51 09.18 | 28 59 07.5 | 23.63 | — | — | |
| umd4-78 | 21 51 08.16 | 28 59 05.4 | 23.30 | — | — | |
| umd4-82 | 21 51 07.37 | 28 58 48.4 | 23.33 | No signal | — | — |
| uo50-3 | 17 55 26.37 | 18 17 57.4 | 22.23 | — | — | |
| uo50-8 | 17 55 25.64 | 18 18 03.8 | 22.98 | — | — | |
| uo50-15 | 17 55 24.60 | 18 17 56.2 | 21.06 | 0.22 | 0.31 | |
| uo50-19 | 17 55 24.16 | 18 17 57.7 | 20.86 | 0.23 | 0.09 | |
| uo50-20 | 17 55 24.05 | 18 17 56.1 | 21.04 | 0.24 | 0.08 | |
| uo50-28 | 17 55 23.36 | 18 17 53.6 | 21.93 | 0.30 | 0.31 | |
| uo50-34 | 17 55 23.74 | 18 18 06.5 | 22.14 | — | — | |
| uo50-35 | 17 55 23.21 | 18 18 05.3 | 23.40 | — | — | |
| uo50-36 | 17 55 25.22 | 18 18 15.0 | 22.05 | — | — | |
| uo50-37 | 17 55 24.69 | 18 18 13.0 | 22.58 | No signal | — | — |
| uo50-38 | 17 55 25.88 | 18 18 19.1 | 22.81 | — | — | |
| uo50-39 | 17 55 26.53 | 18 18 21.6 | 20.93 | — | — | |
| uo50-40 | 17 55 25.60 | 18 18 24.1 | 20.79 | — | — | |
| uo50-41 | 17 55 23.97 | 18 18 14.4 | 22.02 | — | — | |
| uo50-42 | 17 55 24.88 | 18 18 21.7 | 22.80 | — | — | |
| uo50-43 | 17 55 22.00 | 18 18 10.6 | 22.68 | No signal | — | — |
| uo50-44 | 17 55 25.40 | 18 18 28.6 | 21.37 | — | — | |
| uo50-45 | 17 55 25.61 | 18 18 33.4 | 21.16 | 0.39 | 0.14 | |
| uo50-46 | 17 55 25.55 | 18 18 30.8 | 21.37 | — | — | |
| uo50-47 | 17 55 25.47 | 18 18 27.4 | 21.56 | — | — | |
| uo50-48 | 17 55 24.21 | 18 18 26.1 | 23.55 | — | — | |
| uo50-49 | 17 55 23.31 | 18 18 22.6 | 22.22 | — | — | |
| uo50-50 | 17 55 25.19 | 18 18 31.2 | 23.61 | No signal | — | — |
| uo50-51 | 17 55 24.13 | 18 18 29.5 | 23.05 | — | — | |
| uo50-52 | 17 55 22.04 | 18 18 21.4 | 23.51 | — | — | |
| uo50-53 | 17 55 25.60 | 18 18 41.2 | 21.14 | — | — | |
| uo50-54 | 17 55 25.76 | 18 18 38.4 | 20.81 | — | — | |
| uo50-55 | 17 55 25.52 | 18 18 38.3 | 21.67 | — | — | |
| uo50-56 | 17 55 24.39 | 18 18 35.3 | 24.33 | No signal | — | — |
| uo50-57 | 17 55 24.11 | 18 18 38.2 | 23.14 | — | — | |
| uo50-58 | 17 55 23.92 | 18 18 40.4 | 20.33 | 0.24 | 0.35 | |
| uo50-59 | 17 55 21.65 | 18 18 31.5 | 22.76 | — | — | |
| uo50-60 | 17 55 21.78 | 18 18 33.8 | 21.59 | No signal | — | — |
| uo50-61 | 17 55 24.30 | 18 18 48.9 | 18.34 | — | — | |
| uo50-62 | 17 55 23.70 | 18 18 45.7 | 19.78 | 0.67 | 0.36 | |
| uo50-63 | 17 55 25.94 | 18 18 57.2 | 22.95 | — | — | |
| uo50-64 | 17 55 23.76 | 18 18 56.0 | 20.85 | — | — | |
| uo50-65 | 17 55 23.58 | 18 18 55.3 | 21.59 | — | — | |
| uo50-66 | 17 55 24.45 | 18 18 55.9 | 21.47 | — | — | |
| uo50-67 | 17 55 22.41 | 18 18 47.3 | 22.23 | — | — | |
| uo50-68 | 17 55 23.01 | 18 18 52.9 | 23.27 | — | — | |
| uo50-70 | 17 55 24.89 | 18 19 06.8 | 23.53 | — | — | |
| uo50-71 | 17 55 23.78 | 18 19 02.6 | 22.29 | — | — | |
| uo50-72 | 17 55 22.14 | 18 18 57.9 | 21.46 | — | — | |
| uo50-73 | 17 55 21.44 | 18 18 54.4 | 22.43 | No signal | — | — |
| uo50-74 | 17 55 21.48 | 18 19 00.8 | 22.35 | — | — | |
| uo50-76 | 17 55 23.86 | 18 19 12.2 | 21.67 | 0.38 | -0.06 | |
| uo50-77 | 17 55 22.83 | 18 19 07.8 | 22.26 | No signal | — | — |
| uo50-78 | 17 55 21.29 | 18 19 01.8 | 23.14 | — | — | |
| uo50-80 | 17 55 27.19 | 18 18 40.5 | 21.73 | 0.71 | 0.17 | |
| uo50-81 | 17 55 26.95 | 18 18 54.6 | 21.75 | 0.44 | 0.01 | |
| uo50-83 | 17 55 27.08 | 18 19 01.6 | 20.98 | 0.48 | -0.08 | |
| uop0-2 | 07 50 47.31 | 14 40 21.2 | 22.36 | — | — | |
| uop0-4 | 07 50 47.18 | 14 40 16.1 | 21.54 | 0.28 | -0.07 | |
| uop0-10 | 07 50 45.34 | 14 40 08.1 | 24.75 | — | — | |
| uop0-11 | 07 50 44.71 | 14 40 04.0 | 22.80 | — | — | |
| uop0-14 | 07 50 43.94 | 14 40 01.7 | 99.99 | — | — | |
| uop0-16 | 07 50 43.62 | 14 40 06.1 | 24.23 | No signal | — | — |
| uop0-17 | 07 50 45.96 | 14 40 26.8 | 22.83 | — | — | |
| uop0-18 | 07 50 46.54 | 14 40 32.5 | 21.87 | 0.29 | 0.00 | |
| uop0-19 | 07 50 46.57 | 14 40 34.0 | 21.81 | — | — | |
| uop0-20 | 07 50 44.16 | 14 40 15.3 | 22.54 | — | — | |
| uop0-21 | 07 50 46.82 | 14 40 38.0 | 23.73 | — | — | |
| uop0-22 | 07 50 43.95 | 14 40 15.7 | 21.34 | 0.25 | -0.11 | |
| uop0-23 | 07 50 43.29 | 14 40 10.5 | 99.99 | — | — | |
| uop0-24 | 07 50 46.83 | 14 40 45.9 | 21.47 | 0.10 | 0.03 | |
| uop0-25 | 07 50 46.43 | 14 40 49.6 | 22.73 | — | — | |
| uop0-26 | 07 50 43.01 | 14 40 23.0 | 22.81 | — | — | |
| uop0-27 | 07 50 46.81 | 14 40 56.2 | 22.23 | — | — | |
| uop0-28 | 07 50 42.73 | 14 40 29.6 | 21.54 | — | — | |
| uop0-29 | 07 50 46.61 | 14 41 04.3 | 22.50 | — | — | |
| uop0-30 | 07 50 43.06 | 14 40 37.8 | 21.09 | 0.24 | 0.09 | |
| uop0-31 | 07 50 44.83 | 14 40 28.1 | 22.47 | — | — | |
| uop0-32 | 07 50 43.94 | 14 40 43.1 | 16.71 | 0.60 | 0.00 | |
| uop0-33 | 07 50 43.64 | 14 40 38.7 | 22.86 | — | — | |
| uop0-34 | 07 50 44.89 | 14 40 31.8 | 19.88 | — | — | |
| uop0-35 | 07 50 45.47 | 14 41 03.0 | 22.86 | — | — | |
| uop0-36 | 07 50 45.14 | 14 41 16.9 | 21.75 | — | — | |
| uop0-37 | 07 50 44.88 | 14 41 11.0 | 17.64 | 0.56 | 0.03 | |
| uop0-41 | 07 50 47.54 | 14 40 55.9 | 21.22 | — | — | |
| uop0-42 | 07 50 46.78 | 14 41 17.9 | 22.12 | — | — | |
| uop0-43 | 07 50 46.77 | 14 41 15.8 | 22.52 | — | — | |
| uop0-44 | 07 50 47.11 | 14 41 18.6 | 21.75 | 0.35 | -0.01 | |
| uop0-45 | 07 50 47.80 | 14 41 21.4 | 22.24 | — | — | |
| uop0-46 | 07 50 47.14 | 14 41 38.0 | 21.32 | 0.43 | -0.10 | |
| uop0-47 | 07 50 47.39 | 14 41 37.4 | 22.51 | — | — | |
| uop0-48 | 07 50 49.10 | 14 41 04.5 | 22.01 | — | — | |
| uop0-49 | 07 50 48.48 | 14 41 22.8 | 23.48 | — | — | |
| uop0-50 | 07 50 47.76 | 14 41 47.3 | 23.12 | — | — | |
| uop0-51 | 07 50 48.96 | 14 41 33.8 | 21.64 | — | — | |
| uop0-52 | 07 50 49.59 | 14 41 17.2 | 23.19 | — | — | |
| uop0-53 | 07 50 49.77 | 14 41 14.3 | 22.05 | — | — | |
| uop0-54 | 07 50 50.26 | 14 41 13.0 | 21.14 | 0.26 | -0.01 | |
| uop0-55 | 07 50 50.08 | 14 41 23.4 | 23.01 | No signal | — | — |
| uop0-56 | 07 50 49.21 | 14 41 53.9 | 22.86 | — | — | |
| uop0-57 | 07 50 51.29 | 14 41 20.1 | 20.69 | 0.37 | -0.01 | |
| uop0-58 | 07 50 51.20 | 14 41 32.3 | 22.38 | — | — | |
| uop0-60 | 07 50 51.07 | 14 41 37.5 | 22.43 | — | — | |
| uop0-61 | 07 50 50.53 | 14 41 51.8 | 22.97 | — | — | |
| uop0-62 | 07 50 51.45 | 14 41 42.5 | 22.46 | — | — | |
| usa0-47 | 17 12 24.58 | 33 36 26.8 | 23.49 | — | — | |
| usa0-56 | 17 12 24.80 | 33 36 41.9 | 23.27 | — | — | |
| usa0-57 | 17 12 25.88 | 33 36 36.1 | 21.99 | 0.46 | 0.06 | |
| usa0-70 | 17 12 25.18 | 33 36 41.6 | 23.68 | — | — | |
| usa0-74 | 17 12 24.64 | 33 35 55.8 | 23.62 | No signal | — | — |
| usa0-76 | 17 12 27.37 | 33 36 25.9 | 22.10 | — | — | |
| usa0-77 | 17 12 26.68 | 33 36 07.9 | 22.83 | — | — | |
| usa0-78 | 17 12 25.19 | 33 35 47.3 | 19.03 | 0.67 | 0.12 | |
| usa0-79 | 17 12 28.40 | 33 36 34.7 | 23.65 | — | — | |
| usa0-80 | 17 12 28.04 | 33 36 26.5 | 22.94 | — | — | |
| usa0-81 | 17 12 28.40 | 33 36 27.2 | 22.75 | — | — | |
| usa0-82 | 17 12 27.06 | 33 35 57.5 | 21.12 | 0.55 | 0.08 | |
| usa0-83 | 17 12 26.30 | 33 35 38.2 | 24.13 | — | — | |
| usa0-84 | 17 12 29.35 | 33 36 35.5 | 19.41 | — | — | |
| usa0-85 | 17 12 29.52 | 33 36 33.0 | 20.86 | 0.29 | 0.37 | |
| usa0-86 | 17 12 28.47 | 33 36 19.7 | 23.83 | — | — | |
| usa0-87 | 17 12 27.18 | 33 35 48.5 | 20.58 | — | — | |
| usa0-88 | 17 12 28.72 | 33 36 16.2 | 23.47 | No signal | — | — |
| usa0-89 | 17 12 29.55 | 33 36 24.9 | 20.88 | 0.24 | 0.10 | |
| usa0-91 | 17 12 29.68 | 33 36 19.1 | 22.00 | — | — | |
| usa0-92 | 17 12 27.66 | 33 35 30.9 | 22.90 | — | — | |
| usa0-93 | 17 12 27.48 | 33 35 30.1 | 20.95 | 0.65 | 0.11 | |
| usa0-94 | 17 12 27.35 | 33 35 27.4 | 22.68 | — | — | |
| usa0-95 | 17 12 28.88 | 33 35 57.1 | 22.00 | — | — | |
| usa0-96 | 17 12 28.23 | 33 35 43.7 | 23.40 | — | — | |
| usa0-97 | 17 12 29.73 | 33 36 12.2 | 22.60 | — | — | |
| usa0-98 | 17 12 30.34 | 33 36 07.3 | 21.35 | 0.34 | 0.09 | |
| usa0-99 | 17 12 28.01 | 33 35 29.4 | 21.32 | 0.40 | 0.10 | |
| usa0-100 | 17 12 29.45 | 33 35 56.4 | 22.34 | — | — | |
| usa0-101 | 17 12 29.27 | 33 35 45.7 | 22.92 | — | — | |
| usa0-102 | 17 12 31.12 | 33 36 16.5 | 21.98 | 0.46 | 0.03 | |
| usa0-103 | 17 12 31.32 | 33 36 13.3 | 22.74 | — | — | |
| usa0-104 | 17 12 30.84 | 33 36 09.5 | 24.64 | No signal | — | — |
| usa0-105 | 17 12 30.60 | 33 36 04.2 | 23.23 | No signal | — | — |
| usa0-106 | 17 12 28.72 | 33 35 19.4 | 20.49 | 0.27 | 0.13 | |
| usa0-107 | 17 12 29.16 | 33 35 27.3 | 23.66 | — | — | |
| usa0-108 | 17 12 29.95 | 33 35 41.0 | 21.64 | 0.30 | 0.29 | |
| usa0-109 | 17 12 30.90 | 33 36 00.2 | 23.33 | No signal | — | — |
| usa0-110 | 17 12 30.09 | 33 35 36.8 | 22.84 | — | — | |
| usa0-111 | 17 12 30.03 | 33 35 33.8 | 23.22 | — | — | |
| usa0-112 | 17 12 30.18 | 33 35 34.0 | 23.42 | — | — | |
| usa0-114 | 17 12 29.90 | 33 35 29.6 | 23.82 | No signal | — | — |
| usa0-115 | 17 12 31.45 | 33 35 59.6 | 23.82 | — | — | |
| ux40-1 | 15 19 39.35 | 23 52 40.2 | 22.14 | — | — | |
| ux40-2 | 15 19 39.00 | 23 52 46.7 | 22.18 | No signal | — | — |
| ux40-3 | 15 19 40.62 | 23 52 21.6 | 19.79 | — | — | |
| ux40-4 | 15 19 39.52 | 23 52 41.7 | 22.14 | — | — | |
| ux40-5 | 15 19 40.39 | 23 52 25.5 | 21.83 | 0.58 | 0.06 | |
| ux40-7 | 15 19 38.86 | 23 53 02.1 | 18.91 | 0.43 | 0.16 | |
| ux40-8 | 15 19 41.11 | 23 52 22.6 | 18.57 | 0.62 | 0.04 | |
| ux40-9 | 15 19 39.34 | 23 52 55.3 | 22.15 | — | — | |
| ux40-10 | 15 19 40.47 | 23 52 33.8 | 22.60 | — | — | |
| ux40-11 | 15 19 38.61 | 23 53 14.7 | 21.67 | 0.29 | 0.13 | |
| ux40-12 | 15 19 40.72 | 23 52 36.2 | 22.64 | — | — | |
| ux40-13 | 15 19 40.54 | 23 52 40.7 | 22.17 | — | — | |
| ux40-14 | 15 19 38.79 | 23 53 18.0 | 22.29 | No signal | — | — |
| ux40-15 | 15 19 41.00 | 23 52 35.2 | 23.34 | — | — | |
| ux40-16 | 15 19 41.15 | 23 52 43.7 | 20.95 | — | — | |
| ux40-17 | 15 19 41.39 | 23 52 41.9 | 19.04 | 0.30 | 0.22 | |
| ux40-18 | 15 19 39.86 | 23 53 12.2 | 22.37 | — | — | |
| ux40-19 | 15 19 41.92 | 23 52 33.3 | 21.99 | — | — | |
| ux40-20 | 15 19 41.13 | 23 52 51.5 | 23.36 | — | — | |
| ux40-21 | 15 19 40.91 | 23 52 55.1 | 22.58 | — | — | |
| ux40-22 | 15 19 42.28 | 23 52 37.2 | 22.96 | — | — | |
| ux40-23 | 15 19 41.34 | 23 53 01.1 | 23.74 | No signal | — | — |
| ux40-24 | 15 19 40.31 | 23 53 25.7 | 21.96 | 0.26 | 0.02 | |
| ux40-25 | 15 19 40.96 | 23 53 11.7 | 99.99 | — | — | |
| ux40-26 | 15 19 41.29 | 23 53 13.0 | 21.29 | — | — | |
| ux40-27 | 15 19 42.94 | 23 52 46.2 | 20.05 | 0.28 | 0.17 | |
| ux40-28 | 15 19 40.85 | 23 53 33.8 | 18.11 | — | — | |
| ux40-29 | 15 19 43.31 | 23 52 48.3 | 20.05 | 0.28 | 0.43 | |
| ux40-30 | 15 19 42.62 | 23 53 02.3 | 24.93 | — | — | |
| ux40-31 | 15 19 41.29 | 23 53 34.7 | 30.71 | — | — | |
| ux40-32 | 15 19 43.81 | 23 52 48.3 | 20.75 | 0.58 | 0.05 | |
| ux40-33 | 15 19 42.99 | 23 53 05.1 | 22.83 | — | — | |
| ux40-34 | 15 19 42.51 | 23 53 21.0 | 20.72 | 0.50 | 0.01 | |
| ux40-35 | 15 19 42.50 | 23 53 18.4 | 20.96 | — | — | |
| ux40-36 | 15 19 43.41 | 23 53 09.5 | 24.45 | — | — | |
| ux40-37 | 15 19 38.55 | 23 53 08.8 | 21.81 | 0.48 | 0.04 | |
| ux40-38 | 15 19 42.48 | 23 52 57.1 | 24.12 | No signal | — | — |
| ux40-39 | 15 19 42.11 | 23 53 14.3 | 22.91 | — | — | |
| ux40-40 | 15 19 42.76 | 23 53 06.6 | 22.91 | — | — | |
| ux40-41 | 15 19 39.44 | 23 52 34.6 | 22.18 | — | — | |
| ux40-42 | 15 19 42.15 | 23 53 31.8 | 23.53 | No signal | — | — |
| ux40-44 | 15 19 40.11 | 23 53 06.0 | 24.61 | — | — | |
| ux40-45 | 15 19 41.52 | 23 53 12.4 | 22.16 | — | — | |
| ux40-46 | 15 19 42.33 | 23 53 03.6 | 99.99 | — | — | |
| ux40-47 | 15 19 43.52 | 23 52 29.2 | 22.91 | — | — | |
| ux40-64 | 15 19 42.15 | 23 52 12.8 | 24.21 | — | — | |
| ux40-65 | 15 19 43.20 | 23 52 17.5 | 22.85 | No signal | — | — |
| ux40-66 | 15 19 43.51 | 23 52 13.3 | 23.21 | — | — | |
| uy00-28 | 14 16 18.16 | 11 32 24.6 | 20.42 | 0.41 | 0.04 | |
| uy00-30 | 14 16 18.29 | 11 32 19.9 | 20.87 | 0.27 | 0.02 | |
| uy00-45 | 14 16 17.59 | 11 31 56.3 | 20.66 | 0.37 | 0.06 | |
| uy00-46 | 14 16 17.03 | 11 32 25.5 | 22.57 | — | — | |
| uy00-47 | 14 16 17.86 | 11 31 23.4 | 21.87 | No signal | — | — |
| uy00-48 | 14 16 17.68 | 11 31 26.3 | 23.22 | No signal | — | — |
| uy00-49 | 14 16 16.92 | 11 32 08.7 | 22.63 | — | — | |
| uy00-50 | 14 16 17.43 | 11 31 25.8 | 22.32 | — | — | |
| uy00-51 | 14 16 17.29 | 11 31 36.3 | 23.51 | — | — | |
| uy00-52 | 14 16 16.41 | 11 31 57.8 | 21.26 | 0.30 | 0.21 | |
| uy00-53 | 14 16 16.33 | 11 31 55.8 | 21.25 | — | — | |
| uy00-54 | 14 16 16.66 | 11 31 33.6 | 21.45 | 0.16 | -0.00 | |
| uy00-55 | 14 16 15.68 | 11 32 11.3 | 22.43 | — | — | |
| uy00-56 | 14 16 16.27 | 11 31 25.1 | 99.99 | No signal | — | — |
| uy00-57 | 14 16 15.51 | 11 32 12.4 | 22.51 | — | — | |
| uy00-58 | 14 16 15.92 | 11 31 39.5 | 21.60 | 0.32 | 0.02 | |
| uy00-59 | 14 16 15.47 | 11 32 04.7 | 20.04 | 0.49 | 0.07 | |
| uy00-60 | 14 16 15.63 | 11 31 55.0 | 22.52 | — | — | |
| uy00-61 | 14 16 15.07 | 11 32 19.5 | 20.77 | 0.25 | -0.00 | |
| uy00-62 | 14 16 15.79 | 11 31 32.9 | 22.54 | — | — | |
| uy00-63 | 14 16 15.35 | 11 31 58.3 | 22.03 | — | — | |
| uy00-64 | 14 16 15.73 | 11 31 16.2 | 21.50 | 0.41 | 0.04 | |
| uy00-65 | 14 16 15.41 | 11 31 36.1 | 23.57 | No signal | — | — |
| uy00-66 | 14 16 15.11 | 11 31 46.2 | 21.52 | 0.56 | 0.00 | |
| uy00-67 | 14 16 14.78 | 11 31 55.5 | 21.33 | 0.48 | 0.05 | |
| uy00-68 | 14 16 14.75 | 11 31 49.6 | 23.17 | No signal | — | — |
| uy00-69 | 14 16 15.03 | 11 31 21.1 | 21.85 | 0.28 | 0.03 | |
| uy00-70 | 14 16 14.31 | 11 31 55.2 | 21.29 | 0.37 | 0.02 | |
| uy00-71 | 14 16 14.24 | 11 31 34.0 | 22.12 | — | — | |
| uy00-72 | 14 16 13.39 | 11 32 06.0 | 19.70 | 0.41 | 0.05 | |
| uy00-73 | 14 16 13.62 | 11 31 55.6 | 21.63 | 0.42 | 0.01 | |
| uy00-74 | 14 16 13.84 | 11 31 35.9 | 20.77 | 0.42 | 0.08 | |
| uy00-75 | 14 16 13.94 | 11 31 24.8 | 20.50 | 0.24 | -0.01 | |
| uy00-76 | 14 16 13.57 | 11 31 12.6 | 19.71 | 0.29 | 0.22 | |
| uy00-77 | 14 16 13.62 | 11 31 14.6 | 19.85 | — | — | |
| uy00-78 | 14 16 13.43 | 11 31 19.3 | 22.68 | — | — | |
| uy00-79 | 14 16 13.00 | 11 31 46.7 | 22.61 | — | — | |
| uy00-80 | 14 16 13.12 | 11 31 31.7 | 99.99 | — | — | |
| uzk0-1 | 12 11 11.82 | 39 27 55.3 | 22.80 | No signal | — | — |
| uzk0-2 | 12 11 12.81 | 39 27 10.4 | 22.06 | No signal | — | — |
| uzk0-3 | 12 11 12.66 | 39 27 27.9 | 22.82 | — | — | |
| uzk0-4 | 12 11 12.94 | 39 27 36.4 | 21.15 | — | — | |
| uzk0-5 | 12 11 12.89 | 39 27 48.8 | 22.18 | — | — | |
| uzk0-6 | 12 11 13.73 | 39 27 21.1 | 22.66 | — | — | |
| uzk0-7 | 12 11 13.89 | 39 27 15.1 | 22.26 | — | — | |
| uzk0-8 | 12 11 14.14 | 39 27 23.4 | 20.29 | — | — | |
| uzk0-9 | 12 11 13.87 | 39 27 49.3 | 21.67 | — | — | |
| uzk0-10 | 12 11 14.01 | 39 27 52.8 | 19.84 | 0.43 | 0.20 | |
| uzk0-11 | 12 11 14.66 | 39 27 38.3 | 22.15 | — | — | |
| uzk0-12 | 12 11 14.79 | 39 27 42.1 | 21.69 | 0.33 | -0.10 | |
| uzk0-13 | 12 11 14.35 | 39 28 19.7 | 22.87 | — | — | |
| uzk0-14 | 12 11 16.18 | 39 27 20.0 | 21.40 | 0.42 | -0.03 | |
| uzk0-15 | 12 11 14.95 | 39 28 23.7 | 20.53 | — | — | |
| uzk0-16 | 12 11 16.21 | 39 27 29.3 | 23.27 | — | — | |
| uzk0-17 | 12 11 16.86 | 39 27 33.6 | 23.08 | No signal | — | — |
| uzk0-18 | 12 11 16.10 | 39 28 13.8 | 21.66 | 0.28 | 0.08 | |
| uzk0-19 | 12 11 17.35 | 39 27 24.4 | 22.78 | — | — | |
| uzk0-20 | 12 11 16.88 | 39 27 52.7 | 21.41 | 0.50 | 0.03 | |
| uzk0-21 | 12 11 16.89 | 39 27 49.9 | 21.90 | — | — | |
| uzk0-22 | 12 11 16.28 | 39 28 21.8 | 23.10 | No signal | — | — |
| uzk0-23 | 12 11 17.41 | 39 27 35.6 | 22.95 | — | — | |
| uzk0-24 | 12 11 17.64 | 39 27 36.6 | 23.20 | — | — | |
| uzk0-25 | 12 11 16.90 | 39 28 12.8 | 22.90 | No signal | — | — |
| uzk0-26 | 12 11 18.01 | 39 27 24.6 | 99.99 | No signal | — | — |
| uzk0-27 | 12 11 17.47 | 39 27 55.8 | 23.64 | — | — | |
| uzk0-28 | 12 11 17.13 | 39 28 14.3 | 24.54 | No signal | — | — |
| uzk0-29 | 12 11 17.74 | 39 27 42.3 | 22.93 | No signal | — | — |
| uzk0-30 | 12 11 18.19 | 39 27 27.8 | 99.99 | — | — | |
| uzk0-31 | 12 11 16.01 | 39 27 07.3 | 22.93 | — | — | |
| uzk0-32 | 12 11 16.44 | 39 27 06.3 | 22.79 | — | — | |
| uzk0-33 | 12 11 17.90 | 39 27 07.7 | 22.67 | — | — | |
| uzk0-34 | 12 11 15.85 | 39 27 01.1 | 22.48 | — | — | |
| uzk0-35 | 12 11 18.54 | 39 27 05.0 | 99.99 | No signal | — | — |
| uzk0-36 | 12 11 14.86 | 39 26 53.5 | 19.98 | 0.50 | 0.05 | |
| uzk0-37 | 12 11 15.64 | 39 26 54.9 | 21.17 | 0.36 | 0.05 | |
| uzk0-38 | 12 11 14.16 | 39 26 49.2 | 22.52 | — | — | |
| uzk0-39 | 12 11 15.07 | 39 26 50.1 | 23.41 | — | — | |
| uzk0-40 | 12 11 18.10 | 39 26 54.5 | 24.18 | — | — | |
| uzk0-41 | 12 11 15.17 | 39 26 46.2 | 22.12 | — | — | |
| uzk0-42 | 12 11 18.39 | 39 26 55.1 | 26.75 | — | — | |
| uzk0-43 | 12 11 16.69 | 39 26 48.1 | 21.92 | — | — | |
| uzk0-44 | 12 11 17.83 | 39 26 49.0 | 22.56 | — | — | |
| uzk0-45 | 12 11 15.29 | 39 26 34.7 | 22.62 | — | — | |
| uzk0-46 | 12 11 13.00 | 39 26 27.9 | 99.99 | — | — | |
| uzk0-47 | 12 11 17.90 | 39 26 40.8 | 23.21 | — | — | |
| uzk0-48 | 12 11 18.74 | 39 26 41.5 | 23.45 | No signal | — | — |
| uzk0-49 | 12 11 17.44 | 39 26 34.6 | 23.47 | — | — | |
| uzk0-50 | 12 11 17.37 | 39 26 29.9 | 22.31 | — | — | |
| uzk0-51 | 12 11 17.96 | 39 26 25.9 | 22.92 | — | — | |
| uzk0-52 | 12 11 19.02 | 39 26 27.6 | 20.53 | 0.40 | 0.07 | |
| uzk0-53 | 12 11 18.60 | 39 26 21.7 | 22.63 | — | — | |
| uzk0-54 | 12 11 15.83 | 39 26 12.8 | 22.80 | — | — | |
| uzk0-55 | 12 11 16.52 | 39 26 14.0 | 24.10 | — | — | |
| uzk0-56 | 12 11 18.95 | 39 26 19.0 | 25.68 | — | — | |
| uzk0-57 | 12 11 16.96 | 39 26 08.2 | 22.77 | — | — | |
| uzk0-58 | 12 11 16.23 | 39 26 04.4 | 22.43 | — | — | |
| uzk0-59 | 12 11 17.85 | 39 26 09.1 | 23.37 | — | — | |
| uzk0-60 | 12 11 15.95 | 39 26 02.7 | 22.73 | — | — | |
| uzk0-61 | 12 11 19.25 | 39 26 09.9 | 26.06 | — | — | |
| uzk0-62 | 12 11 12.19 | 39 26 43.4 | 99.99 | No signal | — | — |
| uzk0-63 | 12 11 12.33 | 39 26 35.7 | 24.23 | No signal | — | — |
| uzk0-64 | 12 11 12.53 | 39 26 19.5 | 99.99 | No signal | — | — |
| uzk0-65 | 12 11 12.38 | 39 26 23.1 | 23.92 | — | — | |
| uzk0-66 | 12 11 12.22 | 39 26 31.0 | 24.02 | — | — | |
| uzk0-67 | 12 11 11.99 | 39 26 38.3 | 99.99 | No signal | — | — |
| uzk0-68 | 12 11 12.15 | 39 26 20.5 | 22.57 | — | — | |
| uzk0-69 | 12 11 11.71 | 39 26 42.5 | 24.04 | — | — | |
| uzk0-70 | 12 11 12.21 | 39 26 14.1 | 23.52 | — | — | |
| uzk0-71 | 12 11 11.79 | 39 26 27.6 | 22.63 | — | — | |
| uzk0-72 | 12 11 12.47 | 39 25 52.5 | 24.34 | No signal | — | — |
| uzk0-73 | 12 11 11.38 | 39 26 43.5 | 22.88 | — | — | |
| uzk0-74 | 12 11 12.19 | 39 25 51.7 | 22.95 | — | — | |
| uzk0-75 | 12 11 11.92 | 39 25 59.3 | 21.96 | 0.30 | 0.03 | |
| uzk0-76 | 12 11 11.76 | 39 26 08.0 | 22.56 | — | — | |
| uzk0-77 | 12 11 11.58 | 39 25 51.6 | 22.91 | — | — | |
| uzk0-78 | 12 11 11.39 | 39 25 48.9 | 99.99 | — | — | |
| uzk0-79 | 12 11 10.33 | 39 26 54.7 | 23.94 | — | — | |
| uzk0-80 | 12 11 10.73 | 39 26 23.0 | 20.52 | 0.53 | 0.04 | |
| uzk0-81 | 12 11 10.42 | 39 26 34.1 | 20.52 | 0.41 | 0.04 | |
| uzk0-82 | 12 11 10.16 | 39 26 47.7 | 21.33 | 0.39 | 0.05 | |
| uzk0-83 | 12 11 11.15 | 39 25 57.9 | 22.58 | — | — | |
| uzk0-84 | 12 11 09.52 | 39 26 33.9 | 21.92 | 0.23 | 0.30 | |
| uzk0-85 | 12 11 10.30 | 39 25 48.4 | 22.72 | — | — | |
| uzk0-86 | 12 11 09.40 | 39 26 11.5 | 22.90 | — | — | |
| uzk0-87 | 12 11 08.72 | 39 26 34.6 | 23.00 | — | — | |
| uzk0-88 | 12 11 08.86 | 39 26 26.3 | 22.00 | — | — | |
| uzk0-89 | 12 11 08.85 | 39 26 23.8 | 22.18 | — | — | |
| uzk0-90 | 12 11 08.87 | 39 25 47.3 | 21.41 | 0.52 | 0.19 | |
| uzk0-91 | 12 11 08.57 | 39 26 06.0 | 22.32 | — | — | |
| uzk0-92 | 12 11 08.62 | 39 26 03.5 | 23.06 | — | — | |
| uzk0-93 | 12 11 07.98 | 39 26 27.9 | 22.57 | — | — | |
| uzk0-94 | 12 11 08.33 | 39 26 06.5 | 22.50 | — | — | |
| uzk0-95 | 12 11 07.65 | 39 26 26.7 | 22.55 | — | — |
TABLE 3. Statstical comparison of distribution with models.
| Model | All | E/S0 | ||||
|---|---|---|---|---|---|---|
| No-Evolution SEDs | -12.67 | 1.60 | 2.85 | -6.95 | 2.23 | 3.20 |
| No-Evolution SEDs | -12.30 | 1.99 | 2.85 | -7.09 | 3.08 | 3.25 |
| PBZ Luminosity Evolution | -2.88 | 1.36 | 2.60 | -6.52 | 1.34 | 3.25 |
| PBZ Luminosity Evolution | -1.54 | 1.52 | 2.50 | -6.94 | 1.32 | 3.35 |
| Model | Spiral | Irr/Pec | ||||
| No-Evolution SEDs | -6.45 | 0.90 | 2.80 | -4.81 | 5.87 | 2.45 |
| No-Evolution SEDs | -6.37 | 1.10 | 2.80 | -4.45 | 6.96 | 2.45 |
| PBZ Luminosity Evolution | -3.27 | 0.88 | 2.50 | -8.65 | 4.63 | 2.10 |
| PBZ Luminosity Evolution | -5.69 | 1.04 | 2.40 | -8.68 | 5.22 | 2.05 |
| ‘Eternally Middle-Aged’ () | — | — | — | -2.73 | 1.83 | 2.55 |