Relationship between X-ray and ultraviolet emission in 3C 273
Abstract
In 3C 273, ultraviolet flux and X-ray flux measured by BATSE are not well correlated, contrarily to predictions of several models, unless the X-ray flux lags the UV emission by 1.75 yr. The absence of observed correlation at small lag cannot be due to spectral variability. A Comptonizing corona model is however compatible with all UV and X-ray observations covering the BATSE period.
1 INTRODUCTION
Many models predict some physical links between the X-ray emission and the ultraviolet emission in AGN. It is however very difficult to test these predictions, mostly because it requires an intense X-ray monitoring. We make a first step in that direction by comparing the X-ray emission of 3C 273 observed by BATSE with the ultraviolet observations performed by the IUE satellite. We explore here whether BATSE data, which are quasi-continuous in time and cover a large spectral domain, can provide useful constraints. We use simple phenomenological models that predict - at least partly - how X-ray and UV emissions interplay, and test whether these models can account for the observed data.
2 OBSERVATIONS

We consider here the continuous BATSE observations of 3C 273. A photon flux between 20 keV and 200 keV is available from COSSC, which is obtained by the fit of a power-law with an index of 1.7 (Fig. 1 top). The most obvious feature is a large bump between 1994 and 1995, but other peaks exist, in particular in 1992-1993. We shall compare this light curve with the UV light curve obtained with the IUE satellite between 1250 and 1300 (Fig. 1 bottom). Among others, two bumps are clearly present in 1992-1993 and in 1994-1995, in periods roughly corresponding to the bumps in the BATSE light curve; however, the relative intensities of the bumps are completely different: the peak between 1992 and 1993 is strong with IUE, and weak with BATSE; while the peak between 1994 and 1995 is weak with IUE, but strong with BATSE. If the two components are physically related without delay, and if the BATSE flux is a good measure of the total X-ray flux, it implies that a third parameter must play a role in the physical relationship.
3 BATSE-IUE CROSS-CORRELATION

We calculate the cross-correlation of the UV and X-ray light curves (Fig. 2) by interpolating the BATSE light curve, to quantify the relationship between the light curves. There is a very significant peak at a delay around -1.75 yr. This would mean that a UV-flux increase is followed by a X-ray flux increase a bit less than 2 years later. The correlation is however dominated by the presence of a single dominating bump in both light curves, and is possibly only a coincidence. However, if the two bumps are signatures of a unique event, either the distance between the UV and X-ray emission zones should be larger than one light-year, or the interaction travels at a speed much smaller than the speed of light.
The correlation has a local maximum close to , but at a value that makes it hardly significant. If there exists any physical relationship between the UV and X-ray emissions at small lags, other parameters must appear in this relationship and contribute in a large part to the ratio of UV and X-ray fluxes. In that case, the (strongly damped) correlation peak suggests that the UV light curve follows the X-ray light curve with a delay of 2 months. Such a delay would be natural for a reprocessing model, where the accretion disk is heated by the X-ray radiation from a source located above the accretion disk.
4 THE CORRELATION AT -1.75 yr
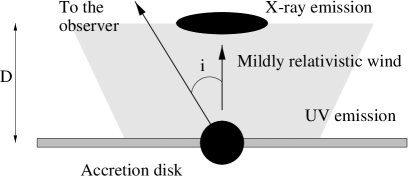
If the large correlation peak around -1.75 yr is real, it is best explained by models where the X-ray source is located far from the UV source. Courvoisier & Camenzind [2] have proposed a scenario (illustrated on Fig. 3) that can account easily for this lag.
A mildly-relativistic wind is shocked at a distance 1 pc above the disk. We assume that the power of the wind is correlated to the blue-bump luminosity. The power of the wind reaches the shock region after a delay , where pc is the distance between the accretion disk and the shock zone, and is the velocity of the wind. The observed delay between the lightcurves is then:
| (1) |
where rad is the angle between the observer and the perpendicular to the accretion disk (deduced from superluminal motion) and gives a negligible contribution, is the speed of light, is the redshift. The observed delay is obtained for , compatible with the assumption of mildly relativistic jet, although several times larger that the value used in [2]. It must be noted that the interaction cannot travel at the speed of light.
5 CORRELATION WITHOUT DELAY

An obvious parameter that can affect a correlation between UV flux and the X-ray flux derived from BATSE is spectral variability. Several measurements of the spectral index of 3C 273 can be found in the litterature. The best measurement up to now has been made by SAX [3], which found that the X-ray spectrum of 3C 273 from 1 to 200 keV follows a power-law with an index 1.57 0.01. OSSE measurements [4, 6] do not reach this level of accuracy, but low-energy experiments, like EXOSAT, GINGA, and ASCA, have shown that a small spectral variability exists [5, 1]. Taking this spectral variability into account, it means that the BATSE flux is not necessarily representative of the total X-ray flux. A distinction must be made however between the energy flux, and the photon flux. For a given 20–200 keV flux, the effect of a hardening of the X-ray spectrum may be an increase of the total energy flux, but a decrease of the total photon flux, as it is dominated by low-energy photons.

If we assume that either the total X-ray energy flux or the total X-ray photon flux is proportional to the UV flux, we can calculate how the photon index would have to change to account for the observed BATSE and UV fluxes. We take a X-ray power-law that extends from 1 keV up to 1 MeV (other limits do not affect the qualitative results). The calculated photon index curves can be fitted to the photon index measurements from other missions. Fig. 4 shows that the assumption of correlated X-ray and UV energy fluxes cannot give a good fit to the observations. Fig. 5 (dashed curve) shows that the assumption that their photon fluxes are correlated requires very large, photon index variations, which is not supported by the observations. It is therefore very improbable that the UV flux and the total X-ray flux (either energy or photon) are completely correlated without (or with a small) delay.
6 COMPTONIZING CORONA
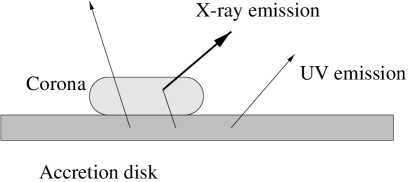
Walter & Courvoisier [7, 8] have developed a model to explain the peculiar relationship observed between the photon index and the X-ray-to-UV photon flux ratio in several AGN, among which 3C 273. We apply here this model in a corona geometry, where the corona covers only a part of the accretion disk, as shown in Fig. 6. A thermal plasma of electrons above the disk Comptonizes the UV flux from the accretion disk. The larger the optical depth of the plasma and its covering factor, the larger the ratio of X-ray-to-UV photon flux. If the corona has a small optical depth , the spectral index is related to and to the electron temperature [7, 8].
We can therefore deduce a relationship between the photon index and the X-ray-to-UV photon flux ratio. We can also calculate in this case the photon index curve predicted by this model, taking into account the UV and BATSE light curves. We assume here that the mean photon index is 1.6 and that the plasma temperature is keV, as in [8]. We use also the fact that SAX observed an unique power-law from 1 to 200 keV.
The photon index curve implied by this model is shown on Fig. 5 (solid curve). It is similar to the one obtained in the case of complete correlation, but with a much smaller dispersion. It fits relatively well the historic measurements of the photon index by other telescopes. Thus this model is compatible with all the UV and X-ray observations covering the BATSE period.
7 CONCLUSION
Correlation analysis points to a X-ray source located far from the ultraviolet source. This correlation however awaits confirmation, as it can easily be due to a coincidence. If the correlation is physical, it is most probable that interaction between the UV and X-ray emissions travels at a speed slower than the speed of light. Wind and shock model is in agreement with the observed delay, provided that the UV light curve is indicative of the power transported by the wind.
Assuming a relationship without delay between X-ray and UV emission, we find that models that predict a correlation between the X-ray energy flux and the UV flux are hard to reconcile with the observations presented here. In particular, reprocessing models fall in this category. The same difficulty arises for models that predicts a correlation between the UV and X-ray photon fluxes.
The Comptonizing corona model discussed here predicts a relationship between the X-ray photon flux, the UV photon flux, and the X-ray photon index. The set of observations discussed here actually supports this model.
References
- [1] Cappi M. & Matsuoka M., 1997, 2nd INTEGRAL Workshop, p. 389, ESA SP-382
- [2] Courvoisier T.J.-L. & Camenzind M., 1989, A&A 224, 10
- [3] Grandi P. et al., 1997, A&A 325L, 17
- [4] Johnson W.N. et al., 1995, ApJ 445, 182
- [5] Malaguti G., Bassani L., & Caroli E., 1994, ApJ 94, 517
- [6] McNaron-Brown K. et al., 1997, ApJ 474, L85
- [7] Walter R. & Courvoisier T.J.-L., 1990, A&A 233, 40
- [8] Walter R. & Courvoisier T.J.-L., 1992, A&A 258, 255