08(01.1,16.3,12.1), 10(08.1) \offprintsP. Bonifacio 11institutetext: Osservatorio Astronomico di Trieste Via G.B. Tiepolo 11 34131 Trieste, Italy 22institutetext: Department of Physics and Astronomy, Michigan State University, East Lansing MI 48824, USA
CS 22957-027: A carbon-rich extremely-metal-poor star ††thanks: This paper is based on observations collected at ESO, La Silla
Abstract
We present a high-resolution spectroscopic analysis of the extremely-metal-poor star CS 22957-027, which Beers et al. (1992) noted to exhibit a rather strong G-band. For = 4839 K, derived from broadband photometry, our analysis obtains = 2.25, and a very low metallicity of [Fe/H]=. The carbon-to-iron ratio is found to be enhanced by dex relative to the solar value, similar to the handful of other carbon–rich metal–deficient stars discussed by Norris et al. (1997a) and Barbuy et al. (1997). From the (1,0) Swan bandhead and lines the isotope ratio is 10, indicating a enrichment. Nitrogen is also found to be enhanced by dex. The process elements Sr and Ba are, surprisingly, found to be under-abundant relative to solar, with [Sr/Fe]=-0.91 and [Ba/Fe]=-0.93. The star’s low luminosity requires that the chemical enrichment arises from mass transfer from an evolved companion, rather than self-polluting dredge-up processes. However, the process elements Sr and Ba are unusually low, with a solar ratio to one another, at variance with what found in the “classical” CH stars.
Finally we note that a feature due to 13CH is present in coincidence with the Th II 401.9129 nm resonance line. The blend is of relevance for the nucleo-chronology use of the Th II line in these extremely metal poor stars, when significant is present.
keywords:
Stars:abundances - Stars:Population II - Stars:late type - Galaxy:halo1 Introduction
The surveys of Beers et al. (1985, 1992, hereafter BPS), aimed at the discovery of very metal–poor stars, have shown that about 10% of the stars more metal–poor than [Fe/H]=–2.0 have a stronger than normal G-band. At higher metallicities, the strong–G–band stars are less frequent, on the order of a few percent (Norris et al. 1997a). The excess of carbon-enhanced stars at progressively lower metal abundance is unexplained, but is probably linked to the early stages of Galactic chemical evolution.
| Date | Tel. | Texp | range | S/N | R | |
|---|---|---|---|---|---|---|
| sec | nm | |||||
| 1981/06/08 | PAL5.0 | 180 | 380-450 | 20 | 4000 | |
| 1993/09/23 | ESO1.5 | 600 | 380-450 | 20 | 4000 | |
| 1996/09/05 | ESO1.5 | 900 | 380-450 | 25 | 4000 | |
| 1996/09/27 | ESO3.6 | 1810 | 393-523 | 20 | 32000 | |
| 1996/09/28 | ESO3.6 | 3630 | 350-463 | 30 | 32000 |
| ion | log gf | EW | Comment | ||
|---|---|---|---|---|---|
| (nm) | (pm) | ||||
| 457.1096 | Mg I | -5.69 | 1.15 | 4.35 | syn |
| 470.2991 | Mg I | -0.67 | – | 4.88 | syn |
| 516.7321 | Mg I | -1.03 | – | 4.48 | syn |
| 517.2684 | Mg I | -0.42 | – | 4.48 | syn |
| 518.3604 | Mg I | -0.18 | – | 4.48 | syn |
| 422.6728 | Ca I | 0.24 | – | 3.36 | syn |
| 443.4957 | Ca I | -0.03 | – | 3.36 | syn |
| 393.3663 | Ca II | 0.13 | – | 3.36 | syn |
| 396.8469 | Ca II | -0.17 | – | 3.36 | syn |
| 390.4785 | Ti I | 0.03 | 3.80 | 2.82 | |
| 392.4527 | Ti I | -0.94 | 1.76 | 2.28 | |
| 400.8926 | Ti I | -1.04 | 2.20 | 2.49 | |
| 468.1908 | Ti I | -1.00 | 1.10 | 2.05 | |
| 498.1732 | Ti I | 0.52 | 3.18 | 2.03 | |
| 499.1067 | Ti I | 0.35 | 1.21 | 1.65 | |
| 502.2871 | Ti I | -0.39 | 1.23 | 2.39 | |
| 503.9959 | Ti I | -1.19 | 1.00 | 2.14 | |
| 374.1635 | Ti II | -0.14 | 8.00 | 2.33 | |
| 398.7600 | Ti II | -2.63 | 2.19 | 2.31 | |
| 416.3648 | Ti II | -0.40 | 1.88 | 2.30 | |
| 444.3794 | Ti II | -0.81 | 8.11 | 2.21 | |
| 450.1273 | Ti II | -0.75 | 6.51 | 1.83 | |
| 456.3761 | Ti II | -0.95 | 6.64 | 2.17 | |
| 518.8680 | Ti II | -1.20 | 5.58 | 2.57 | |
| 359.3481 | Cr I | 0.31 | – | 2.27 | syn |
| 390.8756 | Cr I | -1.00 | – | 2.77 | syn |
| 425.4332 | Cr I | -0.11 | – | 2.07 | syn |
| 464.6148 | Cr I | -0.70 | 1.41 | 2.24 | |
| 520.4506 | Cr I | -0.17 | – | 1.87 | syn |
| 520.6038 | Cr I | 0.03 | – | 1.97 | syn |
| 520.8419 | Cr I | 0.16 | – | 1.97 | syn |
| 362.3183 | Fe I | -0.71 | 3.05 | 3.92 | |
| 368.5998 | Fe I | -0.23 | 4.56 | 4.35 | |
| 371.9935 | Fe I | -0.43 | 21.40 | 3.99 | |
| 382.1179 | Fe I | 0.24 | 4.66 | 4.26 | |
| 390.6479 | Fe I | -2.24 | 8.94 | 4.13 | |
| 422.2213 | Fe I | -0.93 | 2.67 | 4.01 | |
| 423.3602 | Fe I | -0.56 | 4.51 | 4.05 | |
| 426.0473 | Fe I | 0.13 | 8.11 | 4.05 | |
| 492.0502 | Fe I | 0.07 | – | 3.96 | syn |
| 495.7298 | Fe I | -0.34 | – | 3.91 | syn |
| 495.7597 | Fe I | 0.13 | – | 4.01 | syn |
| 501.2067 | Fe I | -2.64 | – | 4.06 | syn |
| 504.1755 | Fe I | -2.09 | – | 3.96 | syn |
| 517.1595 | Fe I | -1.79 | – | 4.01 | syn |
| 519.1455 | Fe I | -0.66 | – | 4.16 | syn |
| 520.2335 | Fe I | -1.56 | – | 3.91 | syn |
| 523.2939 | Fe I | -0.14 | 4.40 | 4.05 | |
| 458.3837 | Fe II | -2.02 | 3.35 | 4.40 | |
| 492.3927 | Fe II | -1.32 | 6.24 | 4.33 | |
| 366.4085 | Ni I | -2.07 | 5.12 | 2.89 | |
| 367.0423 | Ni I | -2.08 | 5.00 | 2.74 | |
| 377.2525 | Ni I | -3.06 | 3.03 | 3.35 | |
| 407.7709 | Sr II | 0.17 | – | -1.42 | syn |
| 421.5519 | Sr II | -0.15 | – | -1.47 | syn |
| 455.4029 | Ba II | 0.17 | – | -2.10 | syn |
| 493.4076 | Ba II | -0.15 | – | -2.37 | syn |
Chemical peculiarities in cool stars () are often interpreted as a result of mixing nucleosynthesis products to the stellar surface. The nucleosynthesis may have taken place either in the star itself or in an evolved companion from which mass has been accreted either through Roche-Lobe overflow or through stellar winds. The evolution in a binary system is probably responsible for the formation of Ba stars, CH-stars, sgCH-stars (McClure, 1984; McClure & Woodsworth, 1990; McClure 1997b) and dwarf Carbon stars (Green & Margon 1994). The BPS strong-G-band stars have been labeled “CH–stars” in the BPS papers, but their relation to the more metal–rich CH stars ([Fe/H]), remains to be verified. Few of these have, to date, been subject to detailed analysis: CS 22892-052 (McWilliam et al. 1995, Sneden et al. 1996), CS 22948-027, CS 29497-034 (Barbuy et al. 1997), LP 706-7 and LP 625-44 (Norris et al. 1997a). All these stars proved to be enhanced in –process elements, like the “classical” CH and Ba stars. In addition CS 22892-052 shows a unique signature: the enhancement of –process elements (e.g. [Eu/Fe]=+1.7), showing that their production took place early in the Galaxy. Sneden et al. (1996) and McWilliam et al. (1995) suggested that the process enhancement observed in CS 22892-052 originated from the ejecta of an early supernova. The process element distribution is important to infer the number and type of events which originated it (see the discussion by Goriely & Arnould 1997). However, the supernova hypothesis leaves the carbon excess ([C/Fe]=+1) unexplained. Norris et al. (1997a) speculated on the existence of a 10 M star which has gone through an AGB evolution and ends as a Type II SN, to synthesize both C and process elements. The same authors mention the more exotic possibility of “hypernovae” of mass in excess of 100 M. The presence of Th and other process elements in CS 22892-052 has been used to derive a radioactive-decay age of the universe (Cowan et al. 1997). Such large enhancements of the process elements are certainly not present in LP 706-7 and LP 625-44, but remain to be investigated for CS 22948-027 and CS 29497-034. Further studies of this class of stars should eventually lead to a better understanding of their nature. In this paper we describe the analysis of another C-enhanced metal-poor star: CS 22957-027.
2 Observations and data reduction
In September 1996 we collected two spectra of CS 22957-027 with the CASPEC spectrograph at the ESO 3.6 m telescope. The echelle grating with 31.6 lines/mm and the long camera (f/3) were used. The detector was the Tek CCD (24 micron pixels) with a readout noise of 4e-/pixel. With the long camera the scale at the detector was about 0.077 Å /pixel. The slit was set at arc seconds providing a resolving power of 32000, as measured from the Thorium-Argon emission lines. The echellograms were reduced using the MIDAS ECHELLE package. The background was subtracted and cosmic rays removed with the FILTER/ECHELLE command. The images were not flat-fielded since this process increases the noise in the spectra and, at the wavelengths covered by our data, fringing is not important. The spectra were then wavelength calibrated using the Th-Ar lamp spectrum. Since the observations were carried out during bright time it was necessary to subtract the sky spectrum. For the image covering the range 393-523 nm we had a sky spectrum taken with the same spectrograph setting, and we subtracted that spectrum after appropriate scaling. For the other frame we extracted directly the sky spectrum above the stellar spectrum, smoothed it with a gaussian 7 pixels wide to increase the S/N, and subtracted this. Each order was independently normalized by fitting a spline through a set of interactively chosen points. All the orders were then merged into a single spectrum. These normalized spectra were shifted to rest wavelength and over-plotted on synthetic spectra computed with the SYNTHE code (Kurucz 1993) to perform the line identification. This allowed us to identify a number of probably unblended lines for which we measured equivalent widths. The lines were measured using the IRAF task splot on the non-normalized spectra, defining a local continuum and fitting a gaussian to the line. When a line could be measured in the two different spectra or on two adjacent orders of the same spectrum a straight average of the independent measurements was taken.
Heliocentric radial velocities measured by cross-correlation in velocity space, using a synthetic spectrum as a template, (range 400 nm - 460 nm) from our two high-resolution spectra are given in Table 1. We report there also radial velocities measured from medium-resolution spectra obtained at the Palomar 5.0 m and at the ESO 1.5 m telescopes. The data is sparse, but does not show any obvious variations of radial velocity over a long time baseline.
3 Abundance analysis
Our analysis relies on an extension of the ATLAS model-atmosphere grid described in Molaro et al. (1997) and on model atmospheres computed with the same assumptions. The only photometry presently available for CS 22957-027 is broadband . To estimate the effective temperature from we used two different calibrations: that of Alonso et al. (1996) and that of McWilliam et al. (1995). The Alonso et al. calibration provides also a metallicity term, whereas the McWilliam et al. assumes [Fe/H]. For this value of [Fe/H] and the two calibrations coincide and yield . If we adopt the BPS metallicity estimate ([Fe/H]=-3.95) the Alonso et al. (1996) calibration yields = 4906 K. This star is estimated to be unreddened by BPS – a small reddening, of the order of 0.05 mag, would increase the by only 100–150 K (depending on the adopted calibration). A concern in deriving the from for CH and related stars is that both bands may be affected by the strong molecular absorption. However, McWilliam et al. (1995) adopt the temperature for CS 22892-052, which is not in contradiction with the excitation equilibrium derived. In fact the small line-to-line scatter found by them for Fe I is inconsistent with any sizeable slope. In our case, forcing the 9 unblended Fe I lines to yield a zero slope in the abundance – excitation energy plane would result in a which is only 100 K hotter than the adopted one. The number of lines is too small to give much weight on this excitation temperature, therefore we decided to adopt the photometric = 4839 K. The error on this effective temperature may be estimated from the standard deviation of the Alonso et al. (1996) calibration, which is 130 K. This error does not take into account errors on photometry and reddening: a change of 0.01 mag in results in a change of 28 K in the derived . The calibration is not very sensitive to metallicity: a decrease of 0.3 dex in [Fe/H] implies an increase of 11 K in , while an increase by 0.3 dex in [Fe/H] implies a decrease of only 1 K in . Clearly, photometry further into the infrared would be useful to constrain . A microturbulent velocity of 1.7 was determined by the requirement that the derived abundance be independent of equivalent width for the Fe I lines.
At this the color gives little leverage on , so we used an ionization equilibrium to estimate the surface gravity. We could only measure two unblended Fe II lines, but were able to measure 8 Ti I and 7 Ti II unblended lines. We therefore used the Ti I/ Ti II equilibrium. The Ti I and Ti II lines yield the same abundance (within 0.02 dex) for =2.25. The gravity is however very uncertain: a change of only 0.3 dex in the Ti II abundance would change the gravity by one dex. Hence we assume that the error on is on the order of 1 dex.
For the unblended lines we used the WIDTH9 code to determine the abundances; for the blended lines we used spectrum synthesis along with the SYNTHE code. The atomic and molecular data necessary for spectrum synthesis are those of Kurucz (1993), unless otherwise stated. For the CH lines we placed the values on the same scale as that used by Norris et al. (1997a) by multiplying the Kurucz (1993) values by 0.4.
| band system | abundance | |||
| C2 | 0 | 0 | ; [C/Fe]= | |
| C2 | 1 | 1 | ; [C/Fe]= | |
| C2 | 1 | 0 | [C/Fe]= | |
| CH | ; [C/Fe]= | |||
| CN | 0 | 0 | ; [N/Fe]= | |
With the adopted model (4839,2.25,-3.5,1.0) and a 1.7 microturbulence, the 17 Fe I lines, selected after excluding blends and doubtful measurements, yield
where the quoted error reflects only the line-to-line scatter. This is somewhat higher than the estimate of [Fe/H] by BPS on the basis of the K index alone. However, recent recalibration of the CaII K / grid by Beers et al. (1997) obtains an estimate of , in close agreement with the present value. Thus CS 22957-027 is among the most metal–poor carbon–rich stars. Among the similar objects which have been studied to date, only CS 29497-034 is possibly more metal–poor than this star, depending on the true value for its effective temperature.
4 Abundance errors
The abundances derived from atomic lines are summarized in Table 2 and those from molecular lines in Table 3.
| element | [X/Fe] | ||
|---|---|---|---|
| C | 8.56 | +2.00 | |
| N | 8.05 | +1.10 | |
| Mg | 7.58 | +0.38 | |
| Ca | 6.36 | +0.43 | |
| Ti | 4.99 | +0.68 | |
| Cr | 5.67 | -0.07 | |
| Fe | 7.48 | 0.00 | |
| Ni | 6.25 | +0.17 | |
| Sr | 2.90 | -0.91 | |
| Ba | 2.13 | -0.93 |
The error on the abundances has two components: the first is related to the presence of noise in the spectra, the second is related to the models used to derive abundances from equivalent widths or line profiles. The latter includes both errors in the model-atmosphere parameters (, , microturbulence, metallicity), and shortcomings in the model-atmosphere and spectrum synthesis (treatment of convection, reliability of 1D-models, input atomic and molecular data, etc.). In this section we shall try to quantify only abundance errors due to the noise in the spectra and to errors in the adopted , and microturbulent velocity. The results are summarized in Table 4.
4.1 Atomic lines
| element | ||||
|---|---|---|---|---|
| C | 0.20 | 0.30 | 0.4 | 0.1 |
| N | 0.20 | 0.10 | 0.1 | 0.1 |
| Mg | 0.18 | 0.20 | 0.35 | 0.03 |
| Ca | 0.20 | 0.15 | 0.30 | 0.05 |
| Ti | 0.29 | 0.15 | 0.31 | 0.03 |
| Cr | 0.29 | 0.15 | 0.09 | 0.02 |
| Fea | 0.12 | 0.16 | 0.15 | 0.02 |
| Ni | 0.26 | 0.19 | 0.06 | 0.03 |
| Sr | 0.03 | 0.15 | 0.26 | 0.06 |
| Ba | 0.14 | 0.15 | 0.33 | 0.01 |
a line to line scatter, except for C and N, see text
b change in abundance for a 130 K change in
c change in abundance for a 1 dex change in
d change in
abundance for a 0.1 change in microturbulent velocity
For the blended lines we used spectrum synthesis, i.e. we computed several synthetic spectra with different abundances of the element under scrutiny until two “bracketing” synthetic spectra were found, as shown in Fig. 4. Changes of less than 0.1 dex could not be appreciated visually, so 0.1 dex may be considered as an order-of-magnitude estimate of the abundance error for these lines.
For unblended lines one can estimate an error on the equivalent width and compute its effect on the derived abundance. However, for atomic species with many lines measured we regard the line-to-line scatter more informative on the abundance error , in spite of the fact that this is due to the errors in the atomic data as well as to the errors in the equivalent widths. The error on the equivalent width is difficult to assess, except for the isolated lines. An optimistic estimate of the errors on equivalent widths may be obtained from the formula (7) of Cayrel (1988), which, for our instrumental setup, gives an error in the range 0.6 - 0.9 pm, depending on the S/N and wavelength. Errors in the placement of the continuum can easily make the error on the equivalent width a factor of two or three larger, however this is difficult to quantify. Some improvement is expected for the lines which could measured on the two spectra and on two adjacent orders, however this is at most a factor of two.
For each element in Table 5 we report four errors: is the r.m.s. error (line-to-line scatter), is the error derived by changing by K (the maximum of the two values was taken), is the error derived by changing by dex and derived by changing the microturbulent velocity by km s-1. For Ca, where formally the line to line scatter is zero, we estimate =0.2 dex at 2 (see above).
4.2 Molecular bands
For molecular bands the situation is more complex. In the first place, the presence of the bands makes the continuum placement very difficult, in particular when a band completely fills one echelle order. Different bands and different molecules give slightly different abundances; the worst case is the discrepancy between the C2 Swan (0,0) band and the CH bands, which yield abundances differing by 0.25 dex. However, these discrepancies could easily be attributed to errors in the placement of the continuum or to the adopted molecular data (a slight renormalization of the C2 values could force the agreement). For these reasons we believe the band-to-band scatter in abundances to be not very informative. We performed several trials of plausible normalizations and found that the effect on the derived abundance was of the order of 0.2 dex; we therefore quote this value, both for C and N, as in Table 5.
There is a further source of uncertainty due to the effect of the unknown O abundance on all the carbon-bearing molecules, and the dependence of the N abundance derived from CN bands on the C abundance. The O abundance is relevant because in cool stars the formation of CO is predominant. Since there are no lines in our spectra suitable for the determination of an O abundance, we assume [O/Fe]=+0.4, as observed in “normal” halo stars, although in some CH stars this ratio is lower (Vanture 1992a). Our star is relatively hot, so that the C abundance is not overly sensitive to the adopted O abundance; a change in O abundance by 0.4 dex produces a change of less than 0.1 dex in the derived C abundance, both from C2 lines and CH lines. Note, however, that the behaviour is strongly non-linear, and much larger effects would result by O enhancements of 1 dex or more. The O abundance affects the CH and C2 lines in a similar way.
5 Results
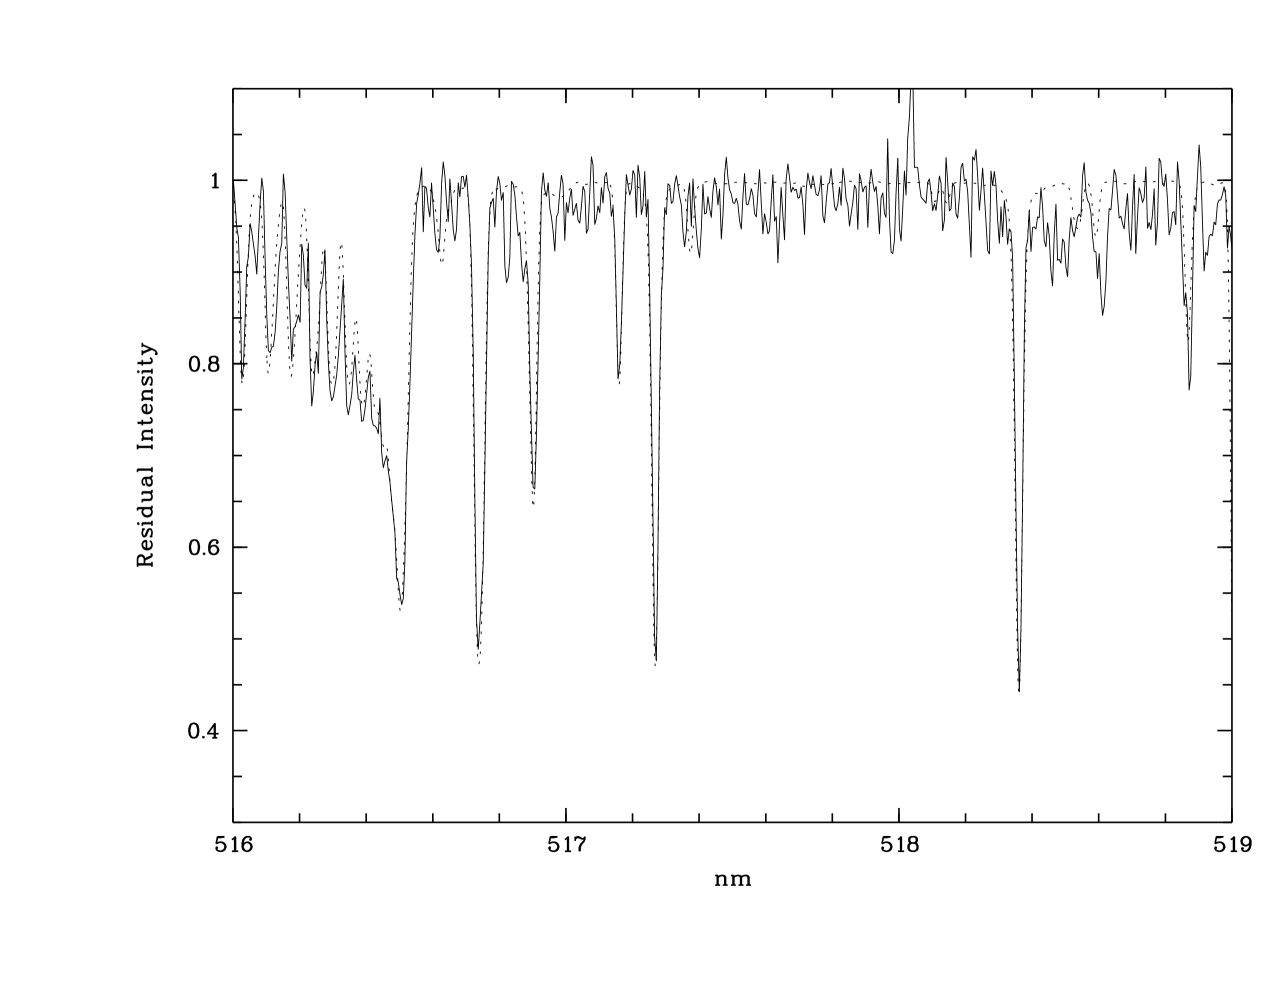
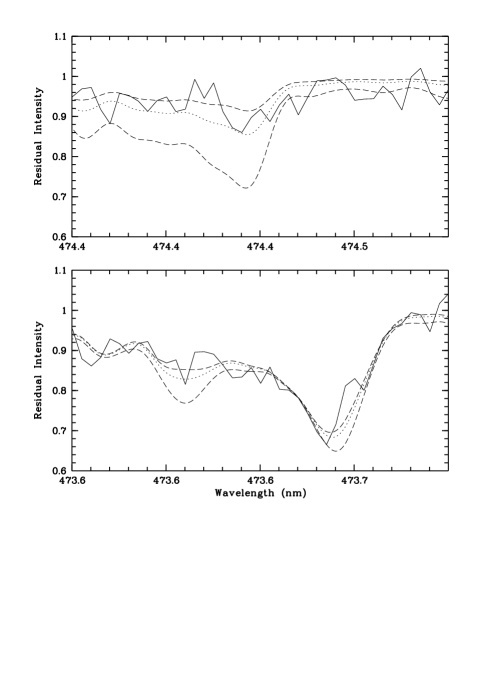
The C overabundance, evident from the low-resolution spectroscopy, is confirmed. In Fig. 1 the C2 (0,0) Swan bandhead, together with the Mg I b triplet, is shown in order to illustrate the significant carbon enhancement in CS 22957-027. The superimposed synthetic spectrum has been computed assuming [C/Fe]=+2.25 and [Mg/Fe]=+0.38. Our results are summarized in Table 4. There we report the C abundance derived from CH lines, since these affect the observed spectrum more than C2 lines. We have also been able to detect the (1,0) Swan band of the molecule, shown in Fig. 2, together with the same bandhead for (lower panel). For the spectrum synthesis of the band we employed the same molecular data as Aoki & Tsuji (1997), namely: wavelengths from Pesic et al. (1983), band oscillator strength of , derived from the lifetime measurement of Naulin et al. (1988), and Hönl-Condon factors from Danylewych et al. (1974). The ratio derived from this band is , thus requiring a considerable enrichment in .
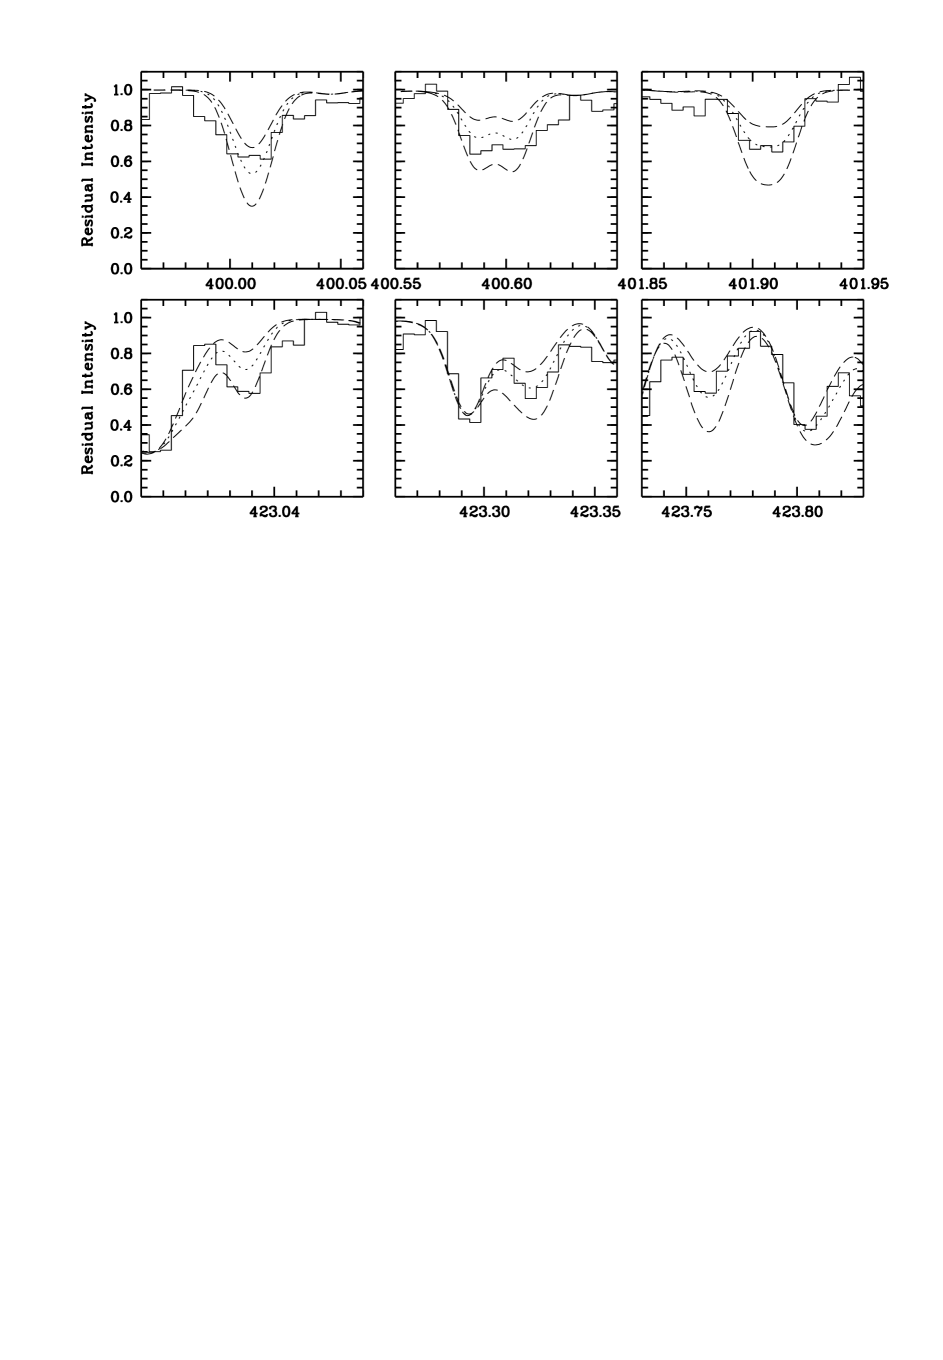
Norris et al. (1997b) noted that lines are present in the spectrum of CS 22957-027. Some of the identified in our spectrum are shown in Fig. 3. The figure also shows superimposed synthetic spectra and it may be appreciated that the isotopic ratio lies between 3 (equilibrium value for the CN cycle) and 20, with a preferred rather low value around 10, in concert with the results from the Swan (1,0) band. In the spectral synthesis the wavelengths of some of the lines, listed as “predicted” in Kurucz (1993), have been changed slightly to bring observations and computations into better agreement. The modified wavelengths are listed in detail in Table 6 .
Our spectra of CS 22957-027 show a strong absorption feature at 401.905 nm, which has a good wavelength coincidence with the Th II 401.9129 nm resonance line (Fig. 3) which was used by Cowan et al. (1997) in CS 22892-052 for nucleo-chronology. However, in CS 22957-027 two lines fall in this spectral region, and we believe they are the main contributors to the feature, but some adjustment of the predicted wavelengths is necessary (see Table 6). If the whole feature is interpreted as due to Th II only, it implies a very high Th abundance ([Th/H]=+2.3, using log gf= of Lawler et al. 1990), but spectrum synthesis with this high Th abundance is not satisfactory and fails to reproduce the blue wing of the feature. The FWHM of the feature is 0.032 nm, while typical widths of unblended Fe I lines in our spectra are 0.02 nm, revealing that the feature is a blend rather than a single line. The lack of detection of Eu lines suggests that the feature at 401.9 nm is not mainly due to Th, since the process requires both elements be synthesized at the same time.
The presence of lines blending the Th II line is of relevance for the use of this Th II line in these stars for nucleo-chronology when the carbon isotope is enhanced at the levels observed in this star.
The N abundance is deduced from the CN violet system and in particular from the (0,0) bandhead at 388.3 nm. It depends on the adopted C abundance: for [C/Fe]=+2.00, as indicated by the CH lines, the N enhancement is [N/Fe]=+1.1, which implies C/N . In “classical” CH stars the C/N ratio is always greater than 1, in the range 2–6, as is expected from products of partial CN cycling (Vanture 1992a). N is found to be enhanced over iron in all the other very-metal-poor C-enhanced stars (Norris et al. 1997a ; Barbuy et al. 1997) with C/N ratios in the range 4–15. The [C/N] ration in CS 22957-027 are compared with that of other metal-poor carbon-rich stars in Fig. 5.
| label | ||
|---|---|---|
| Kurucz93 | adopted | |
| 399.9661 | 106.00X00F2 B00E2 13 | 400.0061 |
| 399.9738 | 106.00X00E1 B00F1 13 | 400.0138 |
| 400.0996 | 106.00X00F2 B00E2 12 | 400.1266 |
| 400.5666 | 106.00X00E2 B00E2 13 | 400.5866 |
| 400.5840 | 106.00X00F1 B00F1 13 | 400.6040 |
| 401.6749 | 106.00X00F2 B00E2 12 | 401.7149 |
| 401.8765 | 106.00X00E2 B00E2 13 | 401.9000 |
| 401.8936 | 106.00X00F1 B00F1 13 | 401.9136 |
| 423.1222 | 106.00X00F2 A00F2 13 | 423.1422 |
| 423.1281 | 106.00X00E1 A00E1 13 | 423.1481 |
| 423.1294 | 106.00X00E1 A00F2 13 | 423.1494 |
| 423.3039 | 106.00X01E2 A01E2 13 | 423.3239 |
| 423.3051 | 106.00X01F2 A01F2 13 | 423.3251 |
| 423.3088 | 106.00X01E1 A01E1 13 | 423.3288 |
| 423.0170 | 106.00X00F1 A00F1 13 | 423.0270 |
| 423.0183 | 106.00X00F1 A00E2 13 | 423.0283 |
| 423.7354 | 106.00X00F2 A00F2 13 | 423.7554 |
| 423.7445 | 106.00X00E1 A00E1 13 | 423.7645 |
| 423.7450 | 106.00X00E1 A00F2 13 | 423.7650 |
| 437.0416 | 106.00X00F2 A00F2 13 | 437.0636 |
| 437.0421 | 106.00X00F2 A00E1 13 | 437.0651 |
The violet CN system poses some problems with abundance determinations, for example Norris & Da Costa (1995) found that its use yields abundances which are 0.5 dex lower than the blue CN band around 420 nm (). We do not have spectra for a metal-poor star with well-determined N abundance, e.g. from NH lines, to allow us a renormalization of the values of the kind used by Norris et al. (1997a). However we expect that such a procedure would increase our derived N abundance by about 0.5 dex.
The data on Mg and Ca shows an [/Fe] ratio larger than solar, as observed in halo stars of this low metallicity, not showing evidence of any peculiarities. Furthermore, the Ti abundance supports these findings, although it is slightly higher than “normal.” Note, however, that the scatter of Ti abundances is on the order of 0.3 dex. Ni and Cr closely track Fe, as is expected for elements produced under conditions of nuclear statistical equilibrium.
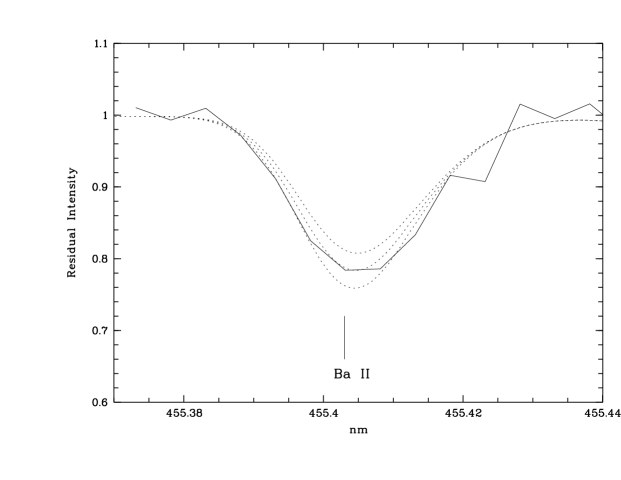
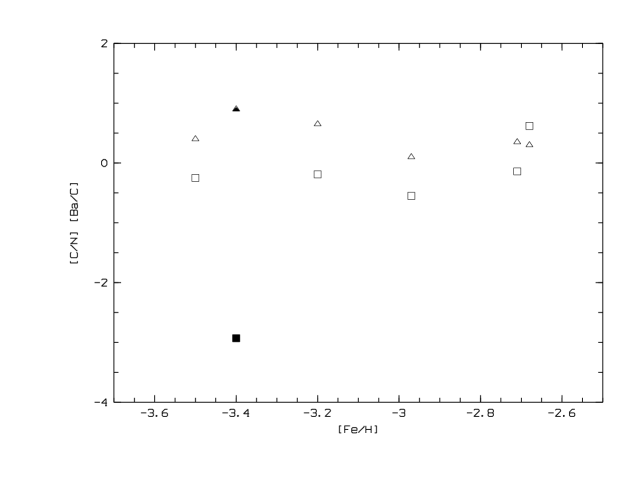
Sr and Ba in CS 22957-027 are deficient with respect to iron ([Sr/Fe] , [Ba/Fe]) – the Ba II resonance line at 455.4 nm is shown in Fig. 4 as an example. The Nd II and Eu II resonance lines at 411.0472 nm and 412.97 nm, respectively, are not detected. A deficiency appears to be present in all capture elements, in contrast to the large overabundance observed in CH and Ba stars. Figure 5 shows that CS 22957-027 has [Ba/C] about 2.5 dex lower than the other five very-metal-poor CH stars (CS 22892-052 McWilliam et al. 1995, Sneden et al. 1996; CS 22948-027, CS 29497-034 Barbuy et al. 1997; LP 706-7 and LP 625-44 Norris et al. 1997a).
5.1 Comparison with Norris et al. (1997b)
After submitting this work we became aware of the analysis of Norris et al. (1997b) of this same star. The atmospheric parameters derived by Norris et al. (1997b) are very close to those adopted by us, = 4850, =1.9 and microturbulent velocity of 1.5 . The agreement of is not surprising, since both are derived from the colour, albeit with different calibrations, but the agreement of surface gravities is, on the other hand, quite significant. Norris et al. (1997b) derived from the FeI/FeII ionization equilibrium, while we derived it from the TiI/TiII equilibrium, thus the two results strengthen each other and the quoted 1 dex error for our is probably an overestimate.
The metallicity of CS22957-027 derived by Norris et al. (1997b) is [Fe/H], which is in remarkably good agreement with our result. Norris et al. (1997) use model-atmospheres based on Bell et al. (1976), whereas we use ATLAS model-atmospheres with no convective overshooting and element enhanced ODFs. The abundances of the other elements in common are also in substantial agreement and so is the . Exceptions are N, Ti and Sr for which the difference exceeds 0.3 dex. We have already commented on the problems with N determinations, we note here that the suggested increase of 0.5 dex in our N abundance would bring our result closer to that of Norris et al. (1997b). For Ti the difference may be attributed to the different set of lines used, in fact we have only 4 Ti II lines in common. The discrepancy for Sr can be explained by the fact that Norris et al. (1997b) determine the abundance from the equivalent width. Our synthetic spectrum reveals that many weak CN lines lower the continuum. The total equivalent width of the feature on our spectra is 7.7 pm, in agreement with the value of 8.0 pm of Norris et al. (1997b).
The radial velocity measured by Norris et al. (1997b) is of (internal error) and again does not support any evidence of variability. Their spectra were taken on August 5th 1996 and provide a short time baseline if compared with ours.
6 Discussion
We have provided evidence that CS 22957-027, with [Fe/H], is one of the most metal-deficient carbon stars. The is 10, indicating an enhancement of , and the s-process elements are at the values found in non carbon stars with similar metallicities. Of the numerous classes of carbon stars, at least three bear some resemblance to CS 22957-027: CH stars, early R stars, and AGB stars (late R and N stars). In the following we discuss the possible membership of CS 22957-027 to these groups, but conclude that this star is unique, and does not match entirely the properties of any of these groups of stars.
CH stars are metal-deficient stars characterized by strong G bands, with enhancements of process elements at the level observed in the AGB stars. Typical [/Fe] in the CH stars are from 0.6 to 1.3 dex. Since their inferred luminosities are too low for AGB stars, a model of mass transfer from a carbon star, presently evolved to white dwarf, to its companion, the CH star, has been proposed. In fact the majority of the CH stars have been shown to be binaries by McClure & Woodsworth (1990). Most of the CH stars have ratios around 10, but a small fraction exhibit very high values, in excess of 500. The low values are a factor of 3 higher than the metal-poor RGB, which exhibit a peak at the CN-cycle equilibrium value ( 3-4). The high values are much higher than that observed in the population I carbon stars of N-type (Aoki and Tsuji 1997). The two different isotopic ratios probably reflect different astrophysical origins. Those with very high can be explained, like the carbon stars of N-type, by transfer of material which contains dredged up from the He-burning layer. The CH stars with low require a transfer of , but also a dredge-up of the products of internal CNO-cycle in the accreting star to lower the . Another possibility is that mass transfer involves material where the has already been lowered by hot-bottom burning (Renzini & Voli 1981 ). This latter binary-star scenario can explain the carbon and nitrogen enhancement and the low ratio found in CS22957-027, however the modest amount of process elements found by us is rather peculiar among CH stars. On the other hand this deficiency is not unusual for very-low-metallicity stars ([Fe/H] ) which are not C- or N- enhanced. Inspection of Fig. 7a of Ryan et al. (1996), where the process element abundances versus metallicity for very metal-poor stars are plotted, shows that CS22957-027 falls in the region where the heaviest concentration of points lie. In addition to the normal abundances of neutron-capture elements, the ratio [Ba/Sr] is solar, at variance with what observed in CH stars, where the heavy process (such as Ba) to light process (such as Sr) elements ratio ([hs/ls]) is super-solar (ranging from about 0.5 to 2 dex, with an average value of 0.9; Vanture, 1992b). It has been also suggested by Aoki and Tsuji (1997) that the CH stars may be the population II counterparts of Ba stars. If this is so, then CS22957-027 should not belong to the CH group.
Can it be that CS22957-027 is on the thermally pulsating AGB (TP-AGB) and thus self-enriched by the third dredge-up? Our derived surface gravity places the star below the TP-AGB luminosities, and it is therefore unlikely that it has undergone self-enrichment. Evolutionary arguments also do not support the AGB hypothesis. Very-low-mass stars do not undergo the third dredge-up, although the exact value of the minimum main-sequence mass for the third dredge-up to occur is not known precisely; Marigo et al. (1996) find that the minimum mass for their metal-poor models (Z=0.008) to undergo dredge-up is 1.1, while Gustafsson & Ryde (1996) suggest . The evolutionary time–scales for a metal-poor star of mass between 1 and 1.2 M⊙ to reach the TP-AGB are on the order of 7–4 Gyr (Boothroyd & Sackman 1988), which is almost a factor of two less than for a solar-metallicity star. If the very-metal-poor stars were formed some 10 Gyr ago, we do not expect any of them to be presently on the TP-AGB after experiencing dredge-up. Less-massive stars could be on the TP-AGB, but should not have experienced the third dredge-up. A relatively young (3–10 Gyr) metal-poor population has been identified by Preston et al. (1994), the so-called Blue Metal Poor (BMP) stars, and these stars could be presently observed on the AGB. Thus it might be possible to understand the chemical peculiarities we observe as due to self-enrichment only if CS 22957-027 is more luminous than we derived and is relatively young, as it could be if it belongs to the cool end of the BMP population. In this case the lack of enhancement of process elements poses some difficulties.
Another class of stars which bears some resemblance to CS 22957-027 are the early-R stars. These are a class of carbon stars without enhancement of s-process elements (Dominy 1984). The solar abundance for s-elements in the early-R stars is in sharp contrast with other related stars (N, S, Ba giants, Ba dwarfs, CH, sgCH, dwarf carbon stars) which all show significantly- enhanced abundances of the process elements relative to iron (Green and Margon 1994). In early-R stars the ranges from near 4 to 15. A sample of early-R stars has not shown evidence of binarity after a 16 year-baseline monitoring of radial velocity (McClure 1997a), ruling out the binarity, in contrast to what has been found for the CH stars. Typical metallicities for the early-R stars are solar or slightly metal-deficient, in the range -. The distinguishing features of early-R stars from the CH stars are the non-enhancement of process elements and the non-binarity of the early-R stars. The fact that no metal-poor early-R stars are known may not imply that such stars do not exist. In fact, they may have escaped detection and misclassified as CH stars, the only safe discriminating criterion being the abundance of the elements. There is no agreement as to the origin of early-R stars, but the most viable hypothesis is that of mixing of C produced by explosive helium-core flash at the tip of the RGB (Dominy 1984). More exotic hypothesis such as the coalescence of a binary system have been also suggested (McClure 1997a).
CS22957-027 appears to be similar to the early-R stars, except for the much lower metallicity. Early-R stars show [C/H] in the range +0.1 to +0.8, or [C/Fe] in the range +0.2 to +1.0, while CS22957-027 has [C/H]=-1.4 and [C/Fe]=+2.0, thus showing a lower carbon content, albeit with a higher [C/Fe]. The early-R stars require a conspicuous carbon enrichment, at least on the order of 30% of the solar carbon. If the mechanism responsible for the formation of early-R stars is the helium-core flash one could expect similar amounts of carbon to be mixed, whatever the metallicity. This would rule out the possibility of an early-R star with a low carbon content. However it is not inconceivable that the amount of carbon mixed during the He-flash depends also on the initial metallicity, being lower for lower-metallicity stars.
Thus, CS 22957-027 appears unique among the carbon stars at very low metallicity, requiring the [C/Fe] and [N/Fe] enhancements to be created by a process which does not lead also to an process element enrichment. The few other carbon stars at low metallicity presently known have thus-far proven to be enhanced in –process elements, like the classical CH and Ba stars. They may have a similar nature to the latter, and mass transfer in a binary system may be able to explain their origin. However, the process element enrichment of CS 22892-052 needs another explanation. None of the scenarios so far proposed appears entirely satisfactory. Ryan et al. (1996) already pointed out that the very-metal-poor carbon stars probably encompass objects with more than one origin. CS 22957-027 is another object which poses some problems to common wisdom on carbon–rich objects. Its properties could be described by saying that it is a Pop. II R0-R5 star or a peculiar CH star, neither of which has been previously observed. Further scrutiny of other carbon-enhanced stars is clearly warranted and can provide important clues towards an understanding of nucleosynthesis processes in the early Galaxy.
Acknowledgements.
This research was partially supported by Collaborative NATO grant No. 950875. TCB acknowledges support from NSF grant AST 95-29454 awarded to Michigan State University. We wish to thank B. Barbuy for helpful discussions on the synthesis of molecular bands and G. Bono for helpful discussions on AGB stars.References
- [1] Alonso A., Arribas S., Martínez-Roger C., 1996, A&A 313, 873
- [2] Aoki W., Tsuji T., 1997, A&A 317, 845
- [3] Barbuy, B., Cayrel, R., Spite, M., Beers, T.C., Spite, F., Nordström, B., Nissen P.E., 1997, A&A 317, L63
- [4] Beers T.C., Preston G.W., Shectman S.A., 1985, AJ 90, 2089
- [5] Beers T.C., Preston G.W., Shectman S.A., 1992, AJ 103, 1987
- [6] Beers T.C., Rossi, S., Norris, J.E., Ryan, S.G., Shefler, T., 1997, in preparation
- [7] Bell R.A., Eriksson K., Gustafsson B., Nordlund A., 1976, A&AS 23, 37
- [8] Boothroyd A.I., Sackman I.J., 1988, ApJ 328, 671
- [9] Cayrel R., 1988 in Cayrel de Strobel G., Spite M., eds, Proc. IAU Symp. 132, The Impact of Very High S/N Spectroscopy on Stellar Physics. Kluwer, Dordrecht, p. 345
- [10] Cowan J.J., McWilliam A., Sneden C., Burris D.L., 1997, ApJ 480, 246
- [11] Danylewych L.L, ,, Proc. R. Soc. Lond. A. Nicholls, R.W.:1974399 197
- [12] Dominy J. F., 1984, ApJS 55, 27
- [13] Goriely S., Arnould M., 1997, A&A 322, L29
- [14] Green P.J., Margon B., 1994, ApJ 423, 723
- [15] Gustafsson B., Ryde N., 1996 IAU Symposium 177 “ The Carbon Star Phenomenon ” astro-ph/9610261
- [16] Kurucz R.L. 1993, CD-ROM 13, 18
- [17] Lawler J.E., Whaling W., Grevesse N., 1990, Nat 346, 635
- [18] Luck R.E., Bond H.E., 1982, ApJ 259, 792
- [19] McClure R.D., 1984, PASP 96, 117
- [20] McClure R.D., 1997a, PASP 109, 256
- [21] McClure R.D., 1997b, PASP 109, 536
- [22] McClure R.D., Woodsworth A.W., 1990, ApJ 352, 709
- [23] McWilliam, A., Preston, G.W., Sneden, C., Searle L., 1995, AJ 109, 2757
- [24] Marigo P., Bressan A., Chiosi C., 1996, A&A 313, 545
- [25] Molaro P., Bonifacio P., Castelli F., Pasquini L., 1997, A&A 319, 593
- [26] Naulin C., Costes M., Dorthe G., 1988, Chem. Phys. Lett. 143, 496
- [27] Norris J.E., Da Costa G.S., 1995, ApJ 447, 680
- [28] Norris J.E., Ryan S.G., Beers T.C., 1997a, ApJ 488, 350
- [29] Norris J.E., Ryan S.G., Beers T.C., 1997b, ApJ 489, L169
- [30] Pesic D.S., Vujisoc B.R., Rakotoarijimy D., Weniger S., 1983, J. Mol. Spec. 100, 245
- [31] Preston G.W., Beers T.C., Shectman S.A., 1994, AJ 108, 538
- [32] Renzini A., Voli M., 1981, A&A 94, 175
- [33] Ryan S.G., Norris J.E., Beers T.C., 1996, ApJ 471, 254
- [34] Sneden, C., McWilliam, A., Preston, G.W., Cowan, J.J., Burris, D.L., Armosky, B.J., 1996, ApJ 467, 819
- [35] Vanture, A.D., 1992a, AJ 104, 1986
- [36] Vanture, A.D., 1992b, AJ 104, 1997
- [37] Woosley S.E., Weaver T.E., 1995, ApJS 101, 181