Low-Luminosity Early-Type Galaxies in the Coma Cluster: Variations in Spectral Properties
Abstract
We present spectra of nine low-luminosity early-type galaxies (M) in the Coma cluster. The spectra, which were obtained with the Multiple Mirror Telescope and cover the spectral region 3300-5350 Å, exhibit a large variation in Balmer line strengths. In fact the line strength variation among the Coma low-luminosity galaxies is as large as that found among a sample of low-luminosity ellipticals in the Virgo cluster and lower density environments. When compared to detailed population synthesis models, the variation in Balmer line strengths among the Coma galaxies indicates a range in luminosity-weighted mean age of from 1 Gyr to 12 Gyr. The two youngest galaxies are shown to be in a post-starburst state, i.e., they are not simply former spirals whose star formation was recently terminated. Moreover, the 1 Gyr ages of these two youngest low-luminosity galaxies are similar to those of the brighter post-starburst galaxies in Coma.
1 Introduction
Recent multi-fiber spectroscopy of the Coma cluster of galaxies has revealed that a substantial fraction of the early-type galaxies in this nearby rich cluster have experienced a starburst within the last 1 Gyr (Caldwell et al. 1993, hereafter Paper I; Caldwell & Rose 1997, hereafter Paper II). In particular, nearly 40% of the early-type galaxies in the SW region of Coma (centered 40´ SW of the cluster center) have experienced recent starbursts, while in other areas of the cluster only 5% of the galaxies are in a post-starburst state111There is some variation in what different investigators actually mean by the term “starburst”. For the purposes of this paper we consider a starburst to be any period of unusually high star formation for a galaxy of a given morphological type. Hence for early-type galaxies, any period of substantial star formation qualifies as a starburst under our definition..
The aforementioned multi-fiber studies concentrated primarily on galaxies brighter than B = 17.5 (MB = -17.5 for H∘= 70 km s-1 ). A substantial number of galaxies with B17.5 were also observed, but the signal-to-noise ratio of these spectra was not high enough to make a reliable assessment as to the presence or absence of recent starbursts. Nevertheless, as is described in Paper I, a number of the faint galaxies (six out of 20 spectra in the SW region) have spectra with an unusually weak break at Ca II H and K. While the spectra were generally too noisy for a reliable evaluation of the strength of the Balmer lines in individual spectra, when the six weak-break spectra were coadded, the resultant spectrum exhibited stronger Balmer lines and weaker metal lines than in the composite of “normal” break spectra (see Fig. 15 of Paper I). Hence on the basis of this previous spectroscopy, there is reason to suspect that some of the faint galaxies in Coma have also experienced recent star formation, and perhaps starbursts.
Clearly it is important to determine whether the faint (B17.5) galaxies in Coma, especially those in the SW region, have participated in the starburst phenomenon that many of their brighter, more massive brethren have experienced. In particular, a knowledge of the luminosity distribution of the (post)-starburst galaxies in Coma could help to reveal the cause of the starburst phenomenon, which is at present still highly uncertain. Moreover, it is important as well to determine whether the progenitors of the post-starburst galaxies were early-type galaxies, spirals, or may even be spirals with recently truncated star formation (rather than true post-burst galaxies). Thus any information that can be gleaned concerning the nature of the progenitor galaxies could also be useful in understanding the cause of the starbursts. With these questions in mind we have obtained spectra of nine low-luminosity early-type galaxies in Coma with the MMT. The spectra exceed the S/N ratios of the multi-fiber spectra of the faint galaxies in Papers I and II, and are of sufficient quality that age and metallicity diagnostic indices developed in Rose (1994), Jones & Worthey (1995), Jones (1997), and Leonardi & Rose (1996) can be applied with confidence. In §2 the spectroscopic data are described. In §3 we present results on the ages of the faint Coma galaxies, compare them to a sample of faint ellipticals in Virgo and lower-density environments that have been studied by Jones (1997), and finally investigate their kinematics within the Coma cluster.
2 Observational Data
We obtained spectra for nine low-luminosity galaxies in the Coma cluster. The Coma galaxies selected are listed in Table 1. The first 5 are located in the central region, within 15′ (0.4 Mpc) of the cluster center. They had not been observed before by us, but the velocities in Colless & Dunn (1995) indicate that they are cluster members. The next 4 galaxies in the table are located in the SW region. All were observed previously by us in Paper I at lower S/N ratio; two were classified as having weak H& K breaks (GMP 5282 and 5320), one was thought to have a normal break (GMP5362), and one was unclassifiable based on the 1993 data (GMP4420). All of these galaxies are fainter than B=17.3, and all are classified as S0’s in Caldwell et al. (1993 and here), while one was classified as an E by Dressler (1980). In Fig. 1 are plotted the locations in the Coma cluster of the nine low-luminosity galaxies that we studied spectroscopically.
In addition, we observed one similarly low-luminosity galaxy in Virgo. This galaxy, IC 3065 (VCC140), was selected from the Binggeli et al. (1985) catalog in the Virgo cluster; it has a low luminosity (BT=14.3, B at Coma would be 18.1), and a velocity placing it in the Virgo cluster. It is 4.3 degrees from M87, or about 1.1 Mpc.
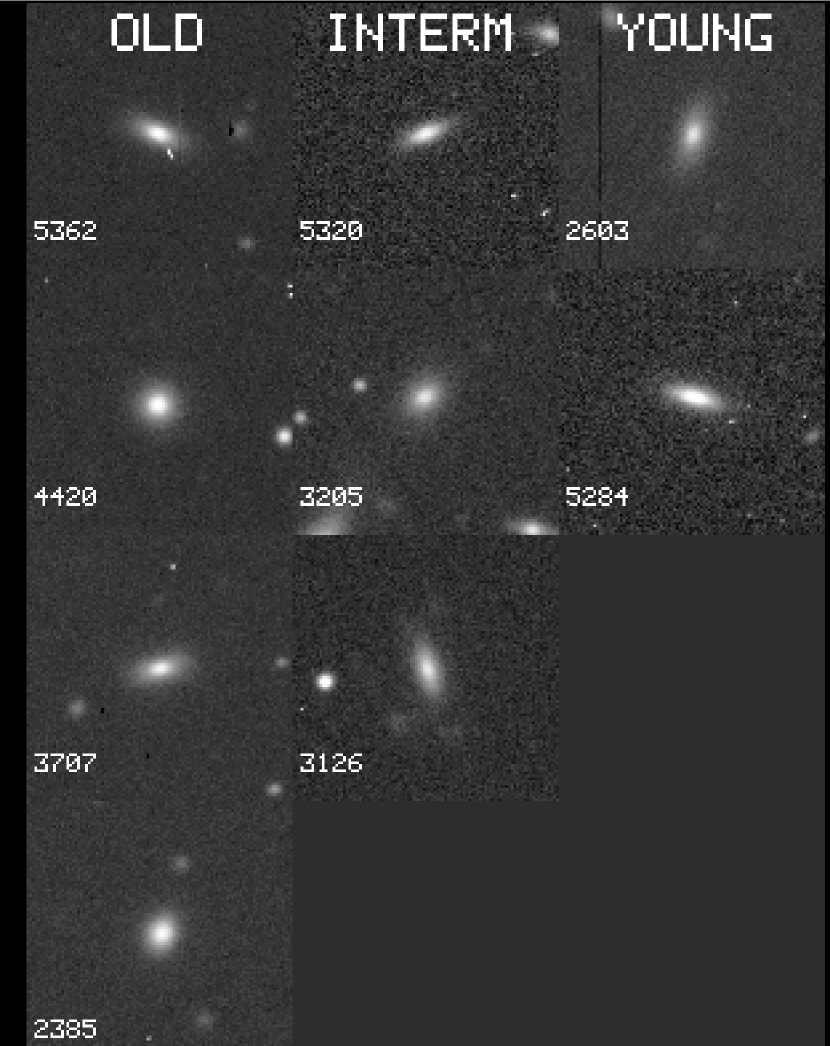
CCD images of the Coma galaxies were obtained at the FLWO 1.2 telescope (Terlevich et al., 1997). They are shown in Fig 2, grouped into the age bins determined below. Radial light profiles of these galaxies confirm that all are S0’s.
2.1 Spectroscopic Data
Spectra of the 9 galaxies in Coma and of IC 3065 in Virgo were taken with the MMT and its blue-channel spectrograph on 1997 April 19-20. The spectral resolution was 3.2Å FWHM; exposure times are listed in Table 1. In addition, spectra were obtained of the radial velocity K giant standards HD171232, HD66141, and HD65934, and of the spectrophotometric standard HZ44. After the raw spectra were bias-subtracted and flat-fielded, they were reduced to one-dimensional, sky-subtracted form using the IRAF apextract package, and then wavelength calibrated and fluxed. Radial velocities were determined using the IRAF fxcor routine, and making use of the radial velocity standard stars. Velocity dispersions were also calculated from the IRAF fxcor program. To do so, however, required calibrating the broadening parameter determined in fxcor so that a reliable transformation into a velocity dispersion could be made. Specifically, we artificially broadened the spectrum of HD171232 by various amounts, then cross-correlated the broadened spectra with the original spectrum, and compared the broadening parameter produced by the fxcor routine with the actual gaussian used to artificially broaden the spectra.
We were also kindly given spectra of 8 low-luminosity E galaxies in Virgo and other lower-density environments by Lewis Jones, to form a comparison sample with the Coma spectra. These spectra, which were obtained at the KPNO 4-m telescope at 1.8 Å resolution FWHM, are summarized in Jones’s PhD thesis (Jones 1997).
3 Ages, Metallicities, and Kinematics of Faint Coma Galaxies
3.1 Spectral Variations Among the Faint Coma Galaxies
In Fig. 3 are plotted spectra of the nine faint early-type galaxies in Coma and the one Virgo galaxy. We have divided the Coma spectra into three age groups, where the ages of the three groups will be determined in §3.2. From an examination of the strength of the Balmer lines relative to neighboring metal lines, it is apparent that there exists a considerable spread in the properties of the nine spectra. We begin by quantifying this variation in spectral properties.
One manner in which to compare the strength of Balmer lines to neighboring metal lines is to form a ratio of the central intensity of a Balmer line relative to that of a nearby metal line (Rose 1984; Rose 1985). Here we compare H to the Fe I4325 line, H to the Fe I4045 line, and H8 to the 3859 feature (which is a mixture of CN and Fe I absorption). These ratios are hereafter referred to as the , , and indices respectively, and are basically a measure of overall spectral type. Note that the way these indices are defined, as the Balmer line becomes stronger relative to the metal line (i.e., towards earlier spectral type), the indices become lower in numerical value. For instance, a star with spectral type A has an index of 0.5, early G is at 0.8, and early K is at 1.2. For this paper we also define an average of the above three indices, which we hereafter refer to as the Hn/Fe index, i.e., Hn/Fe = ++. We will also make use of another line ratio index, defined in Rose (1985) and modelled in Leonardi & Rose (1996), which forms the ratio of the combined feature Ca II H + H with the Ca II K line. This index, which is used to look at young populations due to its sensitivity to the presence of hot stars, will henceforth be referred to as the Ca II index. As discussed in Rose (1985), the line ratio indices have the advantage of being relatively insensitive to variations in spectral resolution.
Observational errors in the line ratio indices have been determined from multiple exposures of several galaxies in the following manner. We obtained three one hour exposures of GMP5320 and two each for GMP2603, GMP4420, and GMP5362. The rms scatter in the various indices were computed from each of these multiple exposures, and the errors for individual galaxies were adjusted according to photon statistics to the flux level in the GMP4420 exposures. It was then assumed that the errors in , , and are the same, and so a mean error for these three indices was computed from the average. We then compared this error with the error in the Hn/Fe I indices, which should be lower than the mean errors in the individual indices, according to propagation of errors. This turned out to be approximately the case, and we adopted an error for Hn/Fe I of 0.03 for the flux level in GMP4420, and adjusted the errors in all other galaxies for their different exposure levels. The errors in the individual indices were set to be higher.
Data on the various Balmer line indices for the Coma low-luminosity galaxies is summarized in Table 2 and illustrated in Fig. 4(a)-(c), where the three individual indices (, , and ) are plotted against the composite Hn/Fe index. The Coma galaxies are plotted as filled circles, and the Virgo low-luminosity galaxy IC3065 is plotted as a starred hexagon. To avoid the influence of velocity broadening of the lines on the spectral indices, all spectra were gaussian smoothed to a common velocity dispersion of 100 km s-1 . Also plotted, as unfilled squares, are the eight low-luminosity elliptical galaxies from Jones (1997); these spectra were not only gaussian smoothed to the same velocity broadening, but they were also broadened from their instrumental resolution of 1.8 Å FWHM to the FWHM of 3.2 Å that is characteristic of our Coma spectra. From Fig. 4(a)-(c) it is evident that all three Balmer indices are well correlated, as expected, and demonstrate the quantitative range in Balmer line strength that is apparent from visual inspection of Fig. 3. Furthermore, the faint Coma galaxies and the low-luminosity Jones ellipticals clearly exhibit similar behavior in these diagrams, i.e., the slopes and zeropoints of fits to the Coma and to the Jones galaxies are indistinguishable within the errors, and the range in index values is similar. However, the Coma galaxies are somewhat more concentrated to lower Balmer index values than the Jones ellipticals, which we will see below is due to a younger mean age.
A more commonly used approach to defining spectral indices is to measure the equivalent width of an individual spectral feature. A problem with using such a procedure in the blue spectral region (at a spectral resolution that is characteristically used for the study of galaxies in integrated light) is that it is difficult to locate a clean continuum area on both sides of the spectral line. However, given the low velocity dispersion of the Coma galaxies and the 3 Å intrinsic resolution of the spectra, we can use “pseudo-equivalent width” indices that have been defined previously for such situations. Specifically, Rose (1994) defined equivalent width indices for H, Fe I 4045, and Ca I 4226, which were revised by Jones & Worthey (1995) and Jones (1997). According to the Jones (1997) definition, which we adopt here, the pseudo-continuum peaks on either side of the line center are interpolated to find the local continuum at a given point in the line; the equivalent width is obtained from the central 3.74 Å around the line center (see Jones 1997 for details). In what follows, we make use of the , , and indices from Jones (1997). The great advantage to these indices is that Jones & Worthey (1995) and Jones (1997) have shown how they can be modelled in integrated light to determine the ages and metallicities of galaxies without the usual degenerate effects of age and metallicity. The disadvantage is that the latter indices are much more sensitive to the effects of spectral resolution (and differences in spectrograph line profiles) than the line ratio indices. Thus comparing indices from two datasets (as we have done here) is less secure in the case of the equivalent width indices than it is for the line ratio indices. Data on the equivalent width indices and their errors are also compiled in Table 2, where the errors in indices were determined in the same basic manner as in the case of the line ratio indices, i.e., from multiple exposures of several galaxies.
In Fig. 4(d) we have plotted the data for Coma and Jones galaxies versus the Hn/Fe index. Note that the agreement between the two datasets in this case is less striking than for the line ratio indices, namely, the Jones galaxies show a shallower slope to their versus Hn/Fe relation than the Coma galaxies. Plots of and versus Hn/Fe are shown in Fig. 7. In the case of versus Hn/Fe, again the Jones galaxies have a slightly shallower slope than the Coma galaxies. The differences between Jones’s (1997) galaxies and ours in the pseudo-equivalent width diagrams is likely due to the above-mentioned difficulty of landing such indices from different spectrographs onto a common system (without the use of “standard” stars to supply transformations between data sets), due to the sensitivity of the indices to the spectrograph line profiles as well as to the overall FWHM. Since we do not have observations of “standard” stars from the Jones (1997) stellar library to tie our system to his, we are unable to rule out the possibility that the pseudo-equivalent width index differences reflect intrinsic differences between our Coma galaxies and his galaxy sample. Finally, the most noteworthy aspect of the versus Hn/Fe plot is the relatively large scatter in both sets of galaxies. This lack of correlation between Ca and overall spectral type is discussed in Jones (1997) and found to be part of a general pattern of non-solar abundance trends in -elements. Such non-solar abundance behavior has been advocated in several previous studies (e.g., Faber 1977, Worthey et al. 1992, de Freitas Pacheco 1996, Casuso et al. 1996), especially in regard to Mg, and is attributed to differing chemical evolution histories among early-type galaxies.
To summarize at this point, the faint Coma early-type galaxies exhibit a quantifiable spread in their Balmer line properties. This spread is very similar in nature to that found in Jones’s (1997) sample of low-luminosity elliptical galaxies. The similarity between the Coma and Jones galaxies is particularly apparent in the line ratio indices, which are relatively insensitive to spectral resolution effects. The agreement is less compelling in the case of the equivalent width and indices, but we attribute this to the difficulty of landing two different data sets on the same system. Finally, the indices indicates a sizable spread in non-solar abundance ratios among the faint Coma galaxies that is similar to that found in Jones’s low-luminosity ellipticals. We now consider how these spectral variations can be modelled in terms of age and metallicity differences.
3.2 Age Variations Among the Faint Coma Galaxies
The most significant challenge to a reliable determination of the ages and metallities of galaxies from their integrated spectra is the degenerate effects of age and metallicity on the integrated spectra (e.g., Worthey 1994). Recently, however, Jones & Worthey (1995) and Jones (1997) have used the index, plotted versus a number of metal line indices, to produce age determinations that are relatively free of the age-metallicity degeneracy. The age and metallicity determinations are based on population synthesis models described in Worthey (1994). In these models, stellar evolutionary isochrones from several sources are combined with empirical fits to the behavior of spectral indices in stars as a function of Teff, log g, and [Fe/H] to predict the behavior of integrated spectral indices as a function of age and metallicity. The application of this modelling to elliptical galaxies is described in Jones & Worthey (1995) and Jones (1997). In particular, Jones (1997) finds that among the eight low-luminosity ellipticals he studied in Virgo and in lower-density environments, there is a large range in “age” (i.e., epoch of last major star formation) among the ellipticals, but very little dispersion in metallicity. Thus he finds age to be the principal contributor to the observed spread in spectral properties of low-luminosity elliptical galaxies. Ages of from 2 to 16 Gyr were found among the eight galaxies studied.
As was illustrated in §3.1, the spread in Balmer line spectral indices is as great among the faint Coma early-type galaxies as it is among Jones’s (1997) low-luminosity ellipticals. It is thus natural to suspect that there is a correspondingly large range in age among the faint Coma galaxies. Some support for this conjecture is evident in Fig. 6, where the indices for the Coma (filled circles) and Jones (unfilled squares) galaxies are plotted versus the index. This diagram separates age from metallicity effects, with the Jones galaxies roughly following a line of constant (near-solar) metallicity and varying age from the lower right (older age) to upper left (younger age) area of the diagram. The faint Coma galaxies follow the same basic trend as the Jones galaxies, but the errors in the spectral indices are considerably larger. Thus the age sensitive versus plot indicates a large spread in age among the faint Coma galaxies, but the errrors are large enough that the ages derived from this plot are probably not very accurate on an individual basis. In addition, as pointed out earlier, the and other pseudo-equivalent width indices measured for the Coma galaxies do not appear to exactly match the Jones (1997) system, thereby casting some doubt on the reliability of the ages that we would infer from these indices.
To obtain a more accurate and reliable determination of the ages of the faint Coma galaxies, we make use of the fact that Jones (1997) found a good correlation between the indices (from which the ages are determined) for his eight galaxies and the line ratio indices, which in turn correlate well with the other two Balmer line ratio indices ( and ). To illustrate this point we plot in Fig. 7 the indices for Jones’s (1997) eight galaxies versus the combined Hn/Fe indices. In this plot we first smoothed Jones’s spectra to the same spectral resolution as our slightly lower resolution MMT Coma spectra. It is evident from Fig. 7 that correlates well with Hn/Fe. Thus we now use Hn/Fe as a surrogate for , since, as a composite of three indices, it has smaller errors than . To do so, we made a fit of the Hn/Fe indices of Jones’s eight galaxies to the ages he derived for them in Jones (1997) by modelling their indices. We then used the fit to convert the Hn/Fe indices of the faint Coma galaxies (and IC3065) into ages. The results of this procedure are listed in Table 3. Note that two of the faint Coma galaxies have a young (2 Gyr) age, three fall in an intermediate (4-6 Gyr) age range, and the other four are basically old (10-12 Gyr). The age range is similar to that of Jones’s (1997) eight low-luminosity ellipticals, except that none of the faint Coma galaxies appears to be as old as Jones’s two oldest galaxies (16-17 Gyr), and on the whole the Coma galaxies are somewhat younger than Jones’s (only one of which is young, one is intermediate age, and the other five are old). Again, we note that there is some uncertainty to using the Hn/Fe index as a surrogate for , but the tight correlation between the Hn/Fe and indices of the Jones (1997) galaxies, coupled with the fact that our galaxies appear to exhibit the same behavior in the Fig. 6 diagram of versus , indicates that the substitution is valid.
For the two youngest Coma galaxies, with determined ages of 2 Gyr, it is of course highly likely that we are observing recent star formation superimposed on an older stellar population(s), rather than a uniformly 2 Gyr old population. To evaluate the possible star formation scenarios for these two “youngest” Coma galaxies, we utilize another age determination technique for young stellar populations that is described in Leonardi & Rose (1996). The Leonardi & Rose (1996) method, which is based on the above-mentioned Ca II index, is geared towards distinguishing between different possible star formation scenarios for a galaxy with recent star formation. For example, if recent star formation (i.e., within the last 2 Gyr) has occurred, how do we determine whether the star formation occurred in a relatively sudden burst, or whether we are simply viewing a galaxy at some point after truncation of long-term star formation? And if we are viewing the galaxy after a star formation burst, how can we distinguish between a weak burst, seen relatively soon after it terminated, from a stronger burst seen relatively longer after termination? For details of the method, the reader is referred to Leonardi & Rose (1996). The method has been applied to several of the brighter Coma early-type galaxies in Caldwell et al. (1996). There it was found that the brighter Coma galaxies did experience recent starbursts, as opposed to truncation of long-term star formation (e.g., in the disk of a spiral).
In Fig. 8 we reproduce the basic Leonardi & Rose (1996) diagram with the positions of the two “young” faint Coma galaxies (GMP2603 and GMP5284) marked as filled triangles. Plotted as unfilled squares are post-starburst models shown at various times after termination of the starburst; the specific times are marked on the plot (e.g., 0.0., 0.5, 1.0, etc. Gyr). The filled circle represents the composite of five of Jones’s (1997) old elliptical galaxies. 222Note that we have used a different composite old population spectrum than in Leonardi & Rose (1996), where we used a composite spectrum of 70 Coma cluster galaxies obtained with the KPNO 4m Hydra multi-fiber positioner. The composite of low-luminosity elliptical galaxy spectra used here seems more appropriate to us for comparison to the faint Coma galaxies, which have similar luminosities, but the results obtained differ by less than 0.1 Gyr if the composite Coma cluster galaxy spectrum is used as the old population anchor. The dotted lines that connect the various post-starburst points with the composite old galaxy point represent the results of taking linear combinations of the former with the latter. The small x’s on the dotted lines represent ten percent increments in the balance between PSB and old galaxy light. Thus the first x next to the 0.0 age PSB point represents a combination of 90% (normalized at 4000 Å) PSB light and 10% old galaxy light. Finally, we have plotted the trajectory of a “truncated” galaxy which had a constant star formation rate over 15 Gyr, and then the star formation was suddenly terminated. The various open triangles connected by the solid line represent the spectral indices of this fading truncated galaxy at increments of 0.5 Gyr after truncation of the star formation, with the first triangle near the “CON” label representing the galaxy 0.0 Gyr after truncation. Thus a galaxy with such a truncated star formation history should lie somewhere on the solid line, while a truncated galaxy that had a declining star formation rate over its lifetime would lie somewhere to the right of the line. Given that the two faint Coma galaxies lie to the left of the truncated constant star formation line, we conclude that they underwent a true starburst in the sense that they experienced enhanced star formation before going quiescent. Furthermore, as can be seen from Fig. 8, the PSB age of GMP5284, which lies in the SW region of Coma populated by many other PSB galaxies, is 1.0 Gyr, which is consistent with the 0.8-1.3 Gyr ages found for the four brighter Coma PSB galaxies in the SW region discussed in Caldwell et al. (1996). For reference, the positions of three of those galaxies are marked as filled squares in Fig. 8 (the fourth galaxy was observed at lower spectral resolution and thus cannot be marked on the plot). Finally, the age of GMP2603, which is the low-luminosity “young” galaxy in the central region of Coma, can be seen in Fig. 8 to have a PSB age of 1.6 Gyr, which is also about the same age as that of the PSB galaxies in the SW region.
To conclude, the two “youngest” low-luminosity galaxies studied by us (GMP2603 and GMP5284) both are seen in Fig. 8 to have undergone recent starbursts, i.e., we are viewing a recent episode of star formation in these two galaxies that is superimposed on an older population. Their spectral indices do not appear to be consistent with a “truncated spiral”, i.e., a constant star formation spiral whose star formation was truncated in the recent past. Like the more luminous PSB Coma galaxies, there is little evidence for a disturbed morphology in the images of these two galaxies (see Fig. 2). Thus these two faint early-type galaxies appear to have undergone a similar star formation history in the recent past as the brighter PSB galaxies in the Coma cluster.
3.3 Spatial Distribution and Kinematics of the Faint Coma Galaxies
In the previous section we showed that the ages of the faint Coma early-type galaxies obtained from modelling of high S/N ratio MMT spectra correlate well with the separation of the multi-fiber spectra from Paper I into two groups (based on visual examination of the spectra), those with weak Ca II breaks versus those with normal break amplitudes. Specifically, the modelling has determined that the group of faint galaxies with weak break amplitude spectra consists of galaxies which have undergone major star formation within the last 2 Gyr. We now consider the spatial distribution and kinematics of the low-luminosity Coma galaxies in the SW that were visually classified as weak break, and compare to those of their normal break amplitude faint brethren. Basic information on the weak break and normal break faint galaxies is given in Tables 4 and 5, respectively. There the galaxies are listed by GMP number and position and velocity data are also given.
In Fig. 9 we have plotted the spatial distribution of the weak break (filled squares) and normal break (open squares) faint galaxies in Coma. There appears to be no spatial segregation of the weak-break low luminosity galaxies from the normal break ones, though the small number of galaxies involved here would make such a distribution hard to detect.
On the other hand, the kinematics of the two groups of faint galaxies in the SW region of Coma appear to be different. The mean radial velocity and line-of-sight velocity dispersion for the fifteen normal break galaxies are 6845 km s-1 and 985 km s-1 respectively, while the mean velocity and dispersion for the six weak break galaxies are 7505 km s-1 and 137 km s-1 respectively. The hypothesis that the two groups are selected from the same parent velocity distribution is rejected by the Kolmogorov-Smirnoff test at the 4.4% level. Thus while the evidence is not overwhelming, there is an indication from the somewhat limited velocity data that the faint Coma galaxies in the SW with recent star formation belong to a higher mean velocity and lower velocity dispersion system than the “older” faint galaxies. In comprehensive analyses of the kinematics of the Coma cluster, both Colless & Dunn (1996) and Biviano et al. (1996) found a gradient in velocity along the NE-SW axis of the cluster. Biviano et al. (1996) in particular found that if the sample is restricted to faint (i.e., 17B20) members, then the mean velocity in the SW region of Coma is 6600 km s-1 ; they demonstrate that the faint galaxies tend to trace the underlying kinematics of the cluster while the brighter galaxies tend to lie in subclusters. On the other hand, there is a spatial-velocity subcluster in the SW region, centered on NGC4839, which has a high mean velocity (7339 km s-1 , according to Colles & Dunn 1996), and low dispersion (329 km s-1 ). Thus according to the evidence accumulated so far, the normal break faint Coma galaxies in the SW region appear to be partaking in the overall kinematics of the faint galaxies in that region, while the weak break galaxies, i.e., those with recent star formation, appear to be affiliated kinematically with the NGC4839 group. To place this in further perspective, Biviano et al. (1996) find that the abnormal spectrum galaxies from Paper I have a mean velocity and dispersion very similar to that of the NGC4839 subcluster. Thus the brighter post-starburst galaxies in Coma SW appear to be associated with the NGC4839 kinematic subcluster. However, the velocity dispersion of the abnormal spectrum galaxies remains controversial in that in Paper I we found a high value, while Biviano et al. (1996), using the biweight estimator, find a low value. In short, while the data is still sparse, the evidence to date sugests that the fainter galaxies with recent star formation belong to the NGC4839 subcluster, along with the brighter post-starburst galaxies. There remains considerable uncertainty as to whether the NGC4839 subcluster is in the process of falling into the main cluster (Colless & Dunn 1996) or has already passed through the main cluster and is in the process of merging with it (Burns et al. 1994; Paper II).
4 Conclusions
The two main results to emerge from spectroscopy of the nine low-luminosity
early-type galaxies in Coma are:
(1) The faint Coma galaxies have a large range in star formation histories.
In fact the variation in age found among the faint Coma galaxies is at least
as large as, and perhaps even larger than, that found among low-luminosity
ellipticals in lower density environments.
(2) We have shown that two of the nine galaxies contain a very recent (2 Gyr)
population superimposed on an older population. In both cases the 2 Gyr
population represents a period of enhanced star formation, i.e., we are seeing
both galaxies in a true PSB state, rather than in a state of recently truncated
star formation in a disk. Thus these two galaxies appear to have had similar
recent star formation histories as the brighter PSB galaxies that are
concentrated in the SW region of Coma.
The fact that the faint Coma cluster S0 galaxies have such a large range in ages provides an interesting contrast to studies of the brighter early-type galaxies in rich clusters. In the central regions of Coma, most of the brighter galaxies have uniform (old) ages (Bower et al. 1990; Bower et al. 1992; Rose at al. 1994), while the age range among brighter early-type galaxies in the SW region is large. Thus the evolution of cluster galaxies appears to be a function of mass as well as of location in the cluster. Recent HST images have revealed that over time, disk galaxies in clusters evolved from star-forming systems to non-star-forming systems (e.g., Dressler et al. 1994). Our results indicate that the low luminosity disk galaxies in Coma evolved to the latter state on a longer time scale (on average) than the more luminous ones. Simulations of disk galaxies in clusters, such as those of Moore et al (1996, 1997) which follow the transformation of a small disk galaxy into a spheroidal system, may be relevant here. However, what is needed is not necessarily a drastic structural change (the faint Coma galaxies studied by us are S0’s, rather than spheroidals), but rather a method to remove the gas via vigorous star formation over a short time period.
References
- (1)
- (2) Bica, E., & Alloin, D. 1986, A&A, 162, 21
- (3)
- (4) Biviano, A., Durret, F., Gerbal, D., Le Fevre, O., Lobo, C., Mazure, A., & Slezak, E. 1996, A&A, 311, 95
- (5)
- (6) Bower, R. G., Ellis, R. S., Rose, J. A., & Sharples, R. M. 1990, AJ, 99, 530
- (7)
- (8) Bower, R. G., Lucey, J. R., & Ellis, R. S. 1992, MNRAS, 254, 601
- (9)
- (10) Caldwell, N., Rose, J. A., Sharples, R. M., Ellis, R. S., & Bower, R. G. 1993, AJ, 106, 473 (Paper I)
- (11)
- (12) Caldwell, N., Rose, J. A., Franx, M., & Leonardi, A. 1996, \aj, 111, 78
- (13)
- (14) Caldwell, N., & Rose, J. A. 1997, AJ, 113, 492
- (15)
- (16) Casuso, E., Vazdekio, A., Peletier, R. F., & Beckman, J. E. 1996, ApJ, 458, 533
- (17)
- (18) Colless, M., & Dunn, A. 1996, ApJ, 458, 435
- (19)
- (20) de Freitas Pacheco, J. A. 1996, MNRAS, 278, 841
- (21)
- (22) Dressler, A., Oemler, A. Jr., Sparks, W. B., & Lucas, R. A. 1994, ApJ, 435, L23
- (23)
- (24) Faber, S. M. 1977, in The Evolution of Galaxies and Stellar Populations, edited by B. M. Tinsley and R. B. Larson (Yale University Observato ry), p. 157
- (25)
- (26) Jones, L. A., PhD Thesis (University of North Carolina)
- (27)
- (28) Jones, L. A., & Worthey, G. 1995, ApJ, 446, 31
- (29)
- (30) Leonardi, A. J., & Rose, J. A. 1996, AJ, 111, 182
- (31)
- (32) Moore, B., Katz, N., Lake, G., Dressler, A., & Oemler, A. 1996, Nature, 379, 613
- (33)
- (34) Moore, B., Lake, G., & Katz, N. 1997, LANL preprint astro-ph/9701211
- (35)
- (36) Rose, J. A. 1984, AJ, 89, 1238
- (37)
- (38) Rose, J. A. 1985, AJ, 90, 1927
- (39)
- (40) Rose, J. A. 1994, AJ, 107, 206
- (41)
- (42) Rose, J. A., Bower, R. G., Caldwell, N., Ellis, R. S., Sharples, R. M., & Teague, P. 1994, AJ, 108, 2054
- (43)
- (44) Terlevich, A., Caldwell, N. & Bower, R. 1997, in preparation
- (45)
- (46) Worthey, G. 1994, ApJS, 95, 107
- (47)
- (48) Worthey, G., Faber, S. M., & Gonzalez, J. J. 1992, ApJ, 398, 69
- (49)


![[Uncaptioned image]](/html/astro-ph/9712214/assets/x4.png)
Figure 3(b) Spectra of “intermediate” age Coma cluster low-luminosity galaxies, and a similar galaxy in the Virgo cluster (IC3065).
![[Uncaptioned image]](/html/astro-ph/9712214/assets/x5.png)
Figure 3(c) Spectra of “young” Coma cluster low-luminosity gaalxies.


| Galaxy | RA (2000) | Dec (2000) | BaaData from Godwin et al. (1983) | B-RaaData from Godwin et al. (1983) | DbbNumbers and types from Dressler (1980) | C93ccTypes from Caldwell et al. (1993) and work done therefore | V(CD)ddFrom Colless & Dunn (1995) | V(C93)eeFrom Caldwell et al. (1993) | exp. |
|---|---|---|---|---|---|---|---|---|---|
| GMP2385 | 13:00:54.6 | 27:50:31.4 | 17.62 | 1.82 | S0 | 7092 | 3600s | ||
| GMP2603 | 13:00:33.2 | 27:49:27.1 | 17.36 | 1.80 | 83 S0 | S0 | 8181 | 7200s | |
| GMP3126 | 12:59:50.8 | 27:49:58.8 | 17.55 | 1.82 | S0 | 7905 | 3600s | ||
| GMP3205 | 12:59:44.1 | 27:52:03.3 | 17.61 | 1.83 | S0 | 6196 | 3600s | ||
| GMP3707 | 12:59:09.3 | 28:02:27.3 | 17.76 | 1.82 | S0 | 7220 | 3600s | ||
| GMP4420 | 12:58:11.3 | 27:56:23.9 | 17.60 | 1.86 | E/S0 | 8500 | 8509 | 7200s | |
| GMP5284 | 12:56:42.2 | 27:32:53.6 | 17.98 | 1.75 | S0 | 7573 | 7545 | 3600s | |
| GMP5320 | 13:01:36.4 | 27:42:28.7 | 18.80 | 1.81 | S0 | 7596 | 7625 | 3600s | |
| GMP5362 | 12:56:34.0 | 27:41:14.4 | 17.77 | 1.89 | 60 E | S0 | 6843 | 10800s | |
| IC3065ffData from Binggeli et al. (1985) | 12:12:39.6 | 14:42:48 | 14.3 | S0 | 1072 | 1200s |
| Galaxy | Hn/Fe I | Ca II | ||||||
|---|---|---|---|---|---|---|---|---|
| GMP2385 | 0.99 | 0.95 | 1.06 | 1.00 | 1.18 | 1.00 | 0.86 | 0.99 |
| 0.05 | 0.05 | 0.05 | 0.03 | 0.00 | 0.10 | 0.10 | 0.10 | |
| GMP2603 | 0.82 | 0.81 | 0.78 | 0.80 | 1.18 | 1.29 | 0.82 | 0.96 |
| 0.04 | 0.04 | 0.04 | 0.02 | 0.00 | 0.07 | 0.07 | 0.07 | |
| GMP3126 | 0.90 | 0.91 | 0.89 | 0.90 | 1.64 | 1.12 | 0.78 | 1.29 |
| 0.06 | 0.06 | 0.06 | 0.04 | 0.00 | 0.12 | 0.12 | 0.12 | |
| GMP3205 | 0.82 | 0.93 | 0.91 | 0.89 | 1.14 | 1.06 | 0.60 | 0.75 |
| 0.07 | 0.07 | 0.07 | 0.04 | 0.00 | 0.14 | 0.14 | 0.14 | |
| GMP3707 | 1.06 | 1.04 | 0.91 | 1.00 | 2.03 | 0.79 | 1.00 | 1.15 |
| 0.07 | 0.07 | 0.07 | 0.04 | 0.00 | 0.14 | 0.14 | 0.14 | |
| GMP4420 | 0.99 | 1.03 | 1.07 | 1.03 | 1.34 | 0.92 | 0.81 | 1.10 |
| 0.04 | 0.04 | 0.04 | 0.02 | 0.00 | 0.07 | 0.07 | 0.07 | |
| GMP5284 | 0.82 | 0.85 | 0.76 | 0.81 | 0.97 | 1.18 | 0.52 | 0.86 |
| 0.05 | 0.05 | 0.05 | 0.03 | 0.00 | 0.10 | 0.10 | 0.10 | |
| GMP5320 | 0.92 | 0.88 | 0.77 | 0.86 | 1.34 | 1.13 | 0.71 | 1.16 |
| 0.05 | 0.05 | 0.05 | 0.03 | 0.00 | 0.10 | 0.10 | 0.10 | |
| GMP5362 | 1.00 | 0.98 | 0.99 | 0.99 | 1.23 | 0.98 | 0.91 | 1.17 |
| 0.04 | 0.04 | 0.04 | 0.02 | 0.00 | 0.08 | 0.08 | 0.08 | |
| IC3065 | 0.88 | 0.81 | 0.87 | 0.85 | 0.99 | 1.33 | 0.70 | 1.13 |
| 0.03 | 0.03 | 0.03 | 0.02 | 0.00 | 0.06 | 0.06 | 0.06 |
| Galaxy | Hn/Fe I | Age(Gyr) |
|---|---|---|
| GMP2385 | 1.000 | 11.2 |
| GMP2603 | 0.805 | 2.0 |
| GMP3126 | 0.902 | 6.6 |
| GMP3205 | 0.885 | 5.8 |
| GMP3707 | 1.004 | 11.4 |
| GMP4420 | 1.028 | 12.5 |
| GMP5284 | 0.810 | 2.2 |
| GMP5320 | 0.857 | 4.4 |
| GMP5362 | 0.988 | 10.6 |
| VCC140 | 0.854 | 5.8 |
| Galaxy | RA | Dec | V⊙ |
|---|---|---|---|
| (2000) | ( km s-1 ) | ||
| SW Region | |||
| GMP4215 | 12:58:31.5 | 27:23:41.6 | 7554 |
| GMP4314 | 12:58:21.8 | 27:53:32.2 | 7252 |
| GMP4330 | 12:58:20.4 | 27:25:46.1 | 7601 |
| GMP4469 | 12:58:06.7 | 27:34:37.1 | 7452 |
| GMP5284 | 12:56:42.2 | 27:32:53.6 | 7545 |
| GMP5320 | 12:56:38.3 | 27:34:15.4 | 7625 |
| Central Region | |||
| GMP2421 | 13:00:50.9 | 27:44:34.5 | 8126 |
| GMP2478 | 13:00:45.3 | 27:50:08.0 | 8720 |
| NE Region | |||
| GMP864 | 13:01:11.8 | 28:26:06 | 6573 |
| GMP885 | 13:01:09.5 | 28:30:27 | 8147 |
| GMP1107 | 13:00:45.7 | 28:45:28 | 5412 |
| GMP1379 | 13:00:13.9 | 28:46:13 | 5756 |
| GMP1975 | 12:59:10.7 | 28:24:56 | 5272 |
| Galaxy | RA | Dec | V⊙ |
|---|---|---|---|
| (2000) | ( km s-1 ) | ||
| SW Region | |||
| GMP3588 | 12:59:18.3 | 27:30:48.4 | 6076 |
| GMP4420 | 12:58:11.3 | 27:56:23.9 | 8509 |
| GMP4447 | 12:58:09.7 | 27:32:57.7 | 6958 |
| GMP4479 | 12:58:05.9 | 27:25:07.7 | 5749 |
| GMP4502 | 12:58:03.4 | 27:40:56.6 | 7209 |
| GMP4519 | 12:58:01.4 | 27:51:12.6 | 5638 |
| GMP4535 | 12:58:00.6 | 27:27:14.4 | 7653 |
| GMP4630 | 12:57:50.6 | 27:29:27.2 | 7335 |
| GMP4656 | 12:57:47.7 | 27:46:10.0 | 5764 |
| GMP4714 | 12:57:43.1 | 27:34:39.3 | 7226 |
| GMP4956 | 12:57:21.5 | 27:28:28.8 | 6902 |
| GMP5012 | 12:57:13.9 | 27:15:13.4 | 5174 |
| GMP5102 | 12:57:04.2 | 27:31:33.2 | 8328 |
| GMP5296 | 12:56:40.8 | 27:26:51.7 | 7310 |
| GMP5362 | 12:56:34.0 | 27:41:14.4 | 6843 |
| Central Region | |||
| GMP3481 | 12:59:25.6 | 28:11:12.9 | 7718 |
| NE Region | |||
| GMP1076 | 13:00:48.4 | 28:26:27 | 7243 |
| GMP1201 | 13:00:35.2 | 28:32:37 | 7142 |
| GMP1266 | 13:00:27.1 | 28:45:03 | 7007 |
| GMP1885 | 12:59:19.7 | 28:28:59 | 7808 |
| GMP2033 | 12:59:03.8 | 28:11:43 | 7491 |