Discovery of a Supernova Explosion at Half the Age of the Universe
and its Cosmological Implications
S. Perlmutter1,2, G. Aldering1, M. Della Valle3, S. Deustua1,4, R. S. Ellis5,
S. Fabbro1,6,7, A. Fruchter8, G. Goldhaber1,2, A. Goobar1,9, D. E. Groom1,
I. M. Hook1,10, A. G. Kim1,11, M. Y. Kim1, R.A. Knop1, C. Lidman12,
R. G. McMahon5, P. Nugent1, R. Pain1,6, N. Panagia13,
C. R. Pennypacker1,4, P. Ruiz-Lapuente14, B. Schaefer15 & N. Walton16
(The Supernova Cosmology Project)
The ultimate fate of the universe, infinite expansion or a big crunch, can be determined by measuring the redshifts, apparent brightnesses, and intrinsic luminosities of very distant supernovae. Recent developments have provided tools that make such a program practicable: (1) Studies of relatively nearby Type Ia supernovae (SNe Ia) have shown that their intrinsic luminosities can be accurately determined1,2,3; (2) New research techniques4 have made it possible to schedule the discovery and follow-up observations of distant supernovae, producing well over 50 very distant ( = 0.3 – 0.7) SNe Ia to date5,6,7. These distant supernovae provide a record of changes in the expansion rate over the past several billion years. By making precise measurements of supernovae at still greater distances, and thus extending this expansion history back far enough in time, we can even distinguish8 the slowing caused by the gravitational attraction of the universe’s mass density from the effect of a possibly inflationary pressure caused by a cosmological constant . We report here the first such measurements, with our discovery of a Type Ia supernova (SN 1997ap) at = 0.83. Measurements at the Keck II 10-m telescope make this the most distant spectroscopically confirmed supernova. Over two months of photometry of SN 1997ap with the Hubble Space Telescope and ground-based telescopes, when combined with previous measurements2,5 of nearer SNe Ia, suggests that we may live in a low mass-density universe. Further supernovae at comparable distances are currently scheduled for ground and space-based observations.
SN 1997ap was discovered by the Supernova Cosmology Project on 5 March 1997 UT, during a two-night search at the CTIO 4-m telescope that yielded 16 new supernovae. The search technique finds such sets of high-redshift supernovae on the rising part of their light curves and guarantees the date of discovery, thus allowing follow-up photometry and spectroscopy of the transient supernovae to be scheduled4. The supernova light curves were followed with scheduled -, -, and some -band photometry at the CTIO, WIYN, ESO 3.6m, and INT telescopes, and with spectroscopy at the ESO 3.6 m and Keck II telescopes. In addition, SN 1997ap was followed with scheduled photometry on the Hubble Space Telescope (HST).
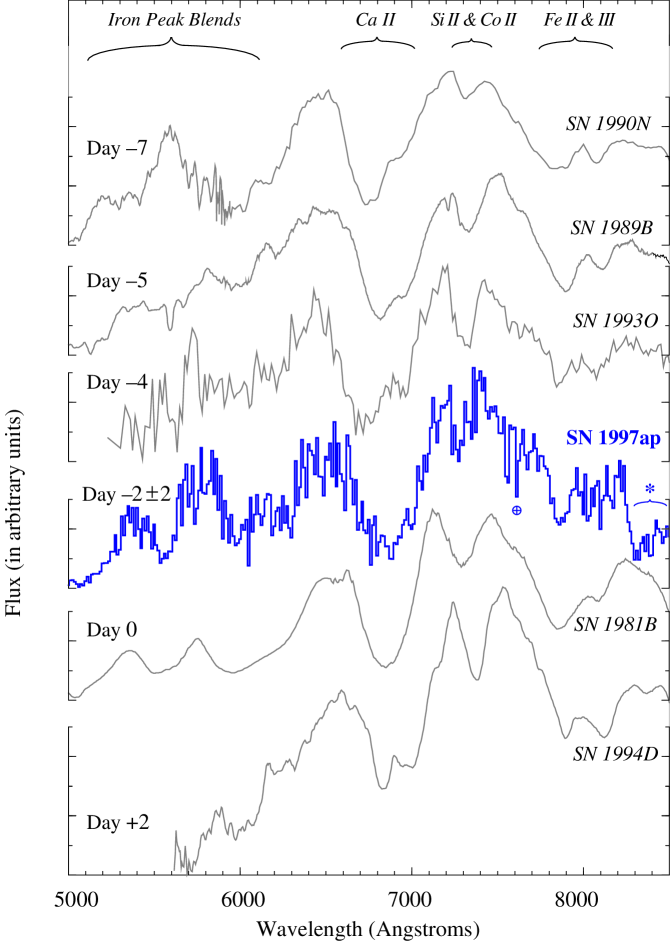
Figure 1 shows the spectrum of SN 1997ap, obtained on 14 March 1997 UT with a 1.5 hour integration on the Keck II 10-m telescope. There is negligible (5%) host-galaxy light contaminating the supernova spectrum, as measured from the ground- and space-based images. When fit to a time series of well-measured nearby Type Ia supernova (SN Ia) spectra9, the spectrum of SN 1997ap is most consistent with a “normal” SN Ia at observed SN-restframe days (4 observer’s days) before the supernova’s maximum light in the restframe band. It is a poor match to the “abnormal” SNe Ia, such as the brighter SN 1991T or the fainter SN 1986G. For comparison, the spectra of low-redshift, “normal” SNe Ia are shown with wavelengths redshifted as they would appear at . These spectra show the time evolution from seven days before to two days after maximum light.
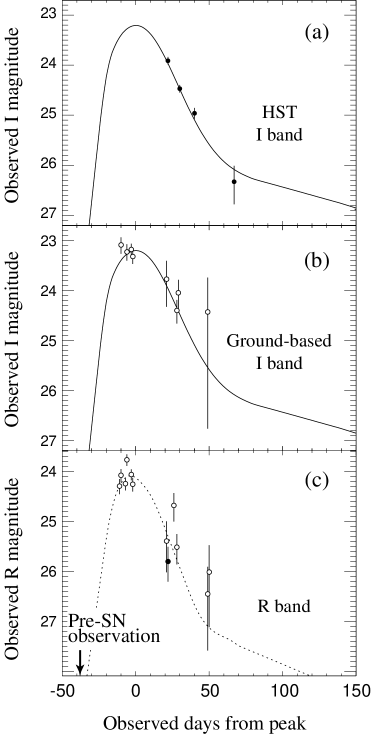
Figure 2 shows the photometry data for SN 1997ap, with significantly smaller error bars for the HST observations (Figure 2a) than for the ground-based observations (Figure 2b and 2c). The width of a SN Ia’s light curve has been shown to be an excellent indicator of its intrinsic luminosity, both at low redshift1,2,3 and at high redshift5: the broader and slower the light curve, the brighter the supernova is at maximum. We characterize this width by fitting the photometry data to a “normal” SN Ia template light curve that has its time axis stretched or compressed by a linear factor, called the “stretch factor”4,5; a “normal” supernova such as SN 1989B, SN 1993O, or SN 1981B in Figure 1 thus has a stretch factor of . To fit the photometry data for SN 1997ap, we use template - and -band light curves that have first been time-dilated and wavelength-shifted (“-corrected”) to the - and -bands as they would appear at (see ref 5 and Nugent et al in preparation). The best-fit stretch factor for all the photometry of Figure 2 indicates that SN 1997ap is a “normal” SN Ia: when fit for a date of maximum at 16.3 March 1997 UT (the error-weighted average of the best-fit dates from the light curve, March 1997 UT, and from the spectrum, March 1997 UT).
It is interesting to note that we could alternatively fit the time dilation of the event, holding the stretch factor constant at , the best fit value from the spectral features obtained in ref 10. We find that the event lasted times longer than a nearby supernova, providing the strongest confirmation yet of the cosmological nature of redshift11,12,9.
The best-fit peak magnitudes for SN 1997ap are and . (In this letter, all magnitudes quoted or plotted are transformed to the standard Cousins13 and bands.) These peak magnitudes are relatively insensitive to the details of the fit: if the date of maximum is left unconstrained or set to the date indicated by the best-match spectrum, or if the ground- and space-based data are fit alone, the peak magnitudes still agree well within errors.
The ground-based data show no evidence of host-galaxy light, but the higher-resolution HST imaging shows a marginal detection (after co-adding all four dates of observation) of a possible host galaxy 1 arcsecond from the supernova. This light does not contaminate the supernova photometry from the HST and it contributes negligibly to the ground-based photometry. The projected separation is 6 kpc (for , and ) and the corresponding -band rest-frame magnitude is and its surface brightness is mag arcsec-2, consistent with properties of local spiral galaxies. We note that the analysis will need a final measurement of any host-galaxy light after the supernova has faded, in the unlikely event that there is a very small knot of host-galaxy light directly under the HST image of SN 1997ap.
We compare the -corrected observed difference of peak magnitudes (measured at the peak of each band, not the same day) to the color found for “normal” low-redshift SNe Ia. We find that the restframe color of SN 1997ap is consistent with an unreddened “normal” SN Ia color, (see ref 14 and also Nugent et al. in preparation). In this region of the sky, there is also no evidence for Galactic reddening15. Given the considerable projected distance from the putative host galaxy, the supernova color, and the lack of galaxy contamination in the supernova spectrum, we proceed with an analysis under the hypothesis that the supernova suffers negligible host-galaxy extinction, but with the following caveat:
Although correcting for - of reddening would shift the magnitude by only one standard deviation, , the uncertainty in this correction would then be the most significant source of uncertainty for this one supernova, due to the large uncertainty in the measurement and to the sparse low-redshift -band reference data. HST -band observations are currently planned for future supernovae, to allow a comparison with the restframe color, a much better indicator of reddening for SNe Ia. Such data will thus provide an important improvement in extinction correction uncertainties for future SNe and eliminate the need for assumptions regarding host-galaxy extinction. In the following analysis, we also do not correct the lower-redshift supernovae for possible host-galaxy extinction, so any similar distribution of extinction would partly compensate for this possible bias in the cosmological measurements.
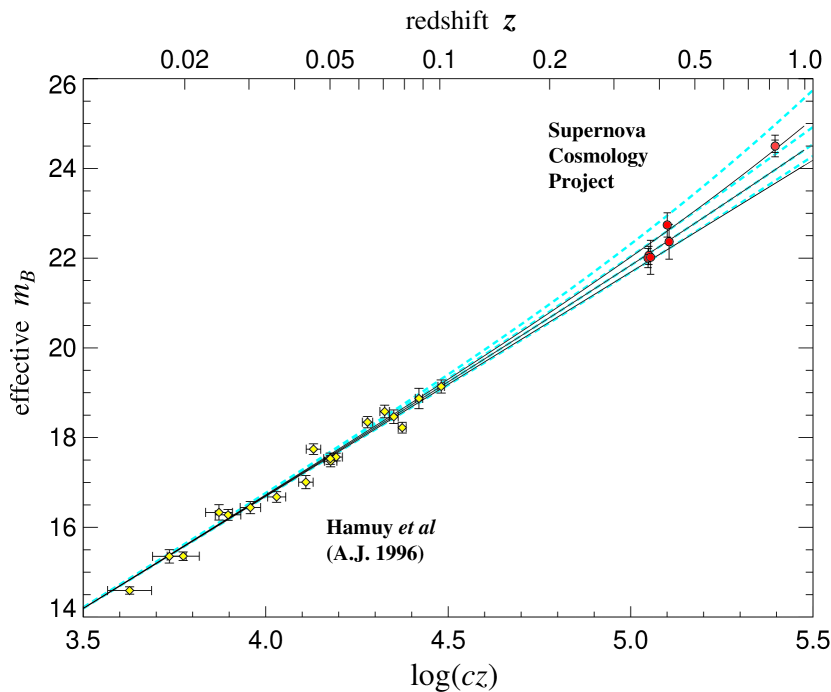
The significance of SNe Ia at for measurements of the cosmological parameters is illustrated on the Hubble diagram of Figure 3. To compare with low-redshift magnitudes, we plot SN 1997ap at an effective restframe -band magnitude of , derived, as in ref 5, by adding a -correction and increasing the error bar by the uncertainty due to the (small) width-luminosity correction and by the intrinsic dispersion remaining after this correction. By studying SNe Ia at twice the redshift of our first previous sample at , we can look for a correspondingly larger magnitude difference between the cosmologies considered. At the redshift of SN 1997ap, a flat universe is separated from a flat universe by almost one magnitude, as opposed to half a magnitude at . For comparison, the uncertainty in the peak magnitude of SN1997ap is only 0.15 mag, while the intrinsic dispersion amongst stretch-calibrated SNe Ia is mag5. Thus, at such redshifts even individual SNe Ia become powerful tools for discriminating amongst various world models, provided observations are obtained, such as those presented here, where the photometric errors are below the intrinsic SNe Ia dispersion.
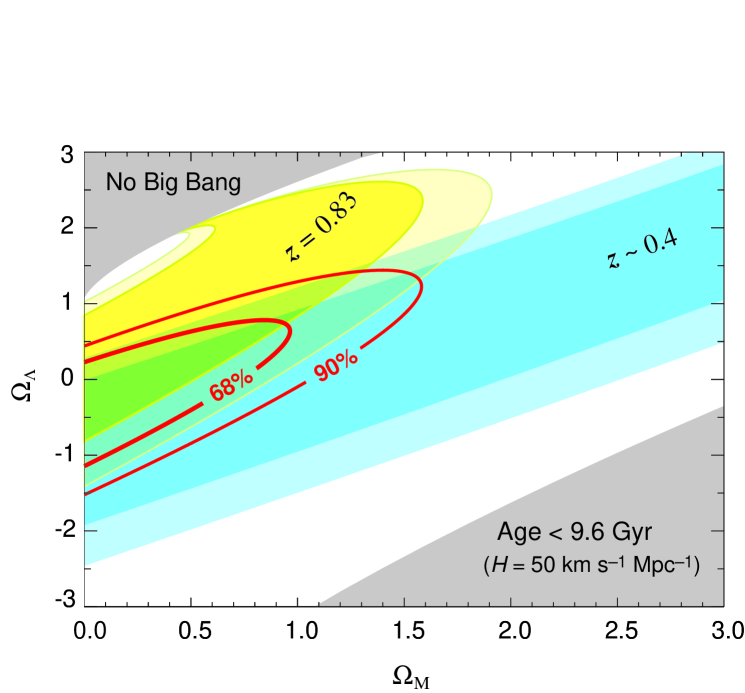
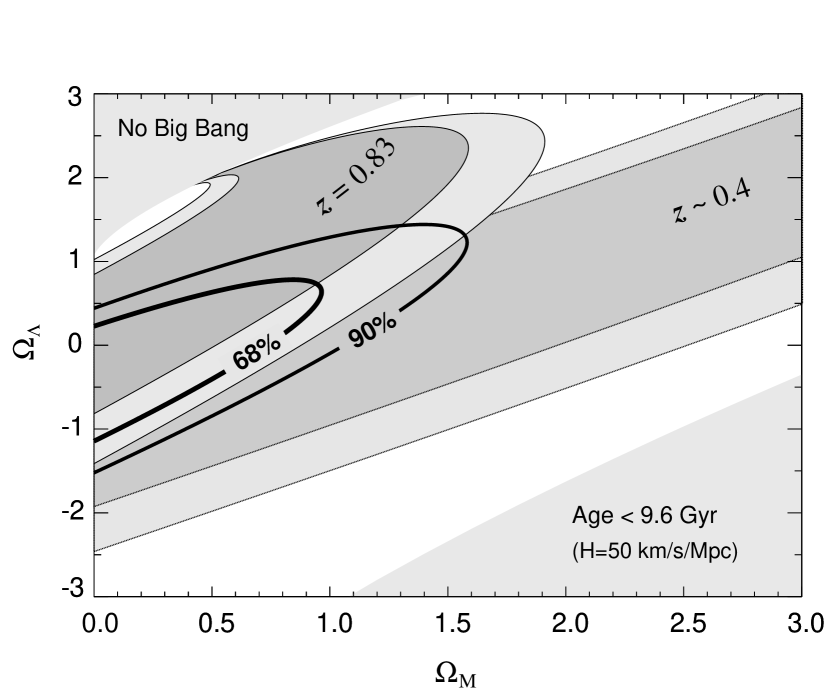
By combining such data spanning a large range of redshift, it is also possible to distinguish between the effects of mass density and cosmological constant on the Hubble diagram8. The blue contours of Figure 4 show the allowed confidence region on the ()) versus plane for the supernovae5. The yellow contours show the confidence region from SN 1997ap by itself, demonstrating the change in slope of the confidence region at higher redshift. The red contours show the result of the combined fit, which yields a closed confidence region in the - plane. This fit corresponds to a value of if we constrain the result to a flat universe ( + ), or if we constrain the result to a universe. These results are preliminary evidence for a relatively low-mass-density universe. The addition of SN 1997ap to the previous sample of lower redshift supernovae decreases the best fit by approximately one standard deviation compared to the earlier results5.
Our data for SN 1997ap demonstrate (1) that SNe Ia at exist, (2) that they can be compared spectroscopically with nearby supernovae to determine SNe ages and luminosities and check for indications of supernova evolution, and (3) that calibrated peak magnitudes with precision better than the intrinsic dispersion of SNe Ia can be obtained at these high redshifts. The width of the confidence regions in Figure 4 and the size of the corresponding projected measurement uncertainties show that with additional SNe Ia having data of quality comparable to SN1997ap a simultaneous measurement of and is possible. It is important to note that this measurement is based on only one supernova at the highest () redshifts, and that a larger sample size is required to find a statistical peak and identify any “outliers.” In particular, SN 1997ap was discovered near the search detection threshold and thus may be drawn from the brighter tail of a distribution (“Malmquist bias”). There is similar potential bias in the lower-redshift supernovae of the Calán/Tololo survey, making it unclear which direction such a bias would change .
Several more supernovae at comparably high redshift have already been discovered by the Supernova Cosmology Project, including SN 1996cl, also at . SN 1996cl can be identified as a very probable SN Ia, since a serendipitous HST observation (Donahue et al., private communication) shows its host galaxy to be an elliptical or S0. Its magnitude and color, although much more poorly constrained by photometry data, agree within uncertainty with those of SN 1997ap. The next most distant spectroscopically confirmed SNe Ia are at and 16 (these supernovae are awaiting final calibration data). In the redshift range – 0.7, we have discovered over 30 additional spectroscopically confirmed SNe Ia, and followed them with two-filter photometry. (The first sample of SNe were not all spectroscopically confirmed and observed with two-filter photometry5.) These new supernovae will improve both the statistical and systematic uncertainties in our measurement of and in combination. A matching sample of 6 SNe Ia at is to be observed in two filters with upcoming Hubble Space Telescope observations. SN1997ap demonstrates the efficacy of these complementary higher redshift measurements in separating the contribution of and .
References
- [1] Phillips, M. M. The absolute magnitudes of Type Ia supernovae. Astrophys. J. 413, L105-L108 (1993).
- [2] Hamuy, M., et al. The Absolute Luminosities of the Calan/Tololo Type Ia Supernovae. Astron. J. 112, 2391-2397 (1996).
- [3] Riess, A. G., Press, W. H., and Kirshner, R. P. Using Type Ia supernova light curve shapes to measure the Hubble constant. Astrophys. J. 438, L17-L20 (1995).
- [4] Perlmutter, S. et al. Scheduled Discoveries of 7+ High-Redshift Supernovae: First Cosmology Results and Bounds on . in Thermonuclear Supernovae (eds P. Ruiz-Lapuente et al.,) 749-763 (Dordrecht: Kluwer, 1997).
- [5] Perlmutter, S., et al. Measurements of the Cosmological Parameters and from the First Seven Supernovae at . Astrophys. J. 483, 565-581 (1997).
- [6] Perlmutter, S. et al. (1997a). International Astronomical Union Circular, no. 6621 and references therein.
- [7] Schmidt, B. et al. (1997). International Astronomical Union Circular, no. 6646 and references therein.
- [8] Goobar, A. and Perlmutter, S. Feasibility of Measuring the Cosmological Constant and Mass Density Using Type Ia Supernovae. Astrophys. J. 450, 14-18 (1995).
- [9] Riess, A. G., et al. Time dilation from spectral feature age measurements of Type Ia supernovae. Astron. J. 114, 722-729 (1997).
- [10] Nugent, P. et al. Evidence for a Spectroscopic Sequence among Type Ia Supernovae. Astrophys. J. 455, L147-L150 (1993).
- [11] Goldhaber, G. et al. Observation of cosmological time dilation using Type Ia supernovae as clocks. in Thermonuclear Supernovae (eds P. Ruiz-Lapuente et al.,) 777-784 (Dordrecht: Kluwer, 1997).
- [12] Leibundgut, B. et al. Time dilation in the light curve of the distant Type Ia supernova SN 1995K. Astrophys. J. 466, L21-L44 (1996).
- [13] Bessell, M. S. UBVRI passbands. Pub. Astr. Soc. Pacific 102, 1181-1199 (1990).
- [14] Branch, D., Nugent, P. and Fisher, A. Type Ia supernovae as extragalactic distance indicators. in Thermonuclear Supernovae (eds P. Ruiz-Lapuente et al.,) 715-734 (Dordrecht: Kluwer, 1997).
- [15] Burstein, D. and Heiles, C. Reddenings derived from H I and galaxy counts - Accuracy and maps Astron. J. 87, 1165-1189 (1982).
- [16] Perlmutter, S. et al. (1997c). International Astronomical Union Circular, no. 6540.
- [17] Leibundgut, B., et al. Premaximum observations of the Type Ia SN 1990N. Astrophys. J. 371, L23-L26 (1991).
- [18] Wells, L. A. et al. The Type Ia supernova 1989B in NGC 3627 (M66). Astron. J. 108, 2233-2250 (1994).
- [19] Branch, D. et al.The Type I supernova 1981b in NGC 4536: the first 100 days. Astrophys. J. 270, 123-139 (1983).
- [20] Patat, F. et al. The Type Ia supernova 1994D in NGC 4526: the early phases. Mon. Not. R. Astron. Soc. 278, 111-124 (1996).
- [21] Cappellaro, E., Turatto M., and Fernley J., in IUE - ULDA Access Guide No. 6: Supernovae (eds Cappellaro, E., Turatto M., and Fernley J.) (ESA, Noordwijk, The Netherlands, 1995).
- [22] Leibundgut, B., Tammann, G., Cadonau, R., and Cerrito, D. Supernova studies. VII. An atlas of light curves of supernovae type I. Astro. Astrophys. Suppl. Ser. 89, 537-579 (1991).
- [23] Holtzman, J. et al. The photometric performance and calibration of WFPC2. Pub. Astr. Soc. Pacific 107, 1065-1093 (1995).
- [24] Whitmore, B. and Heyer, I. New Results on Charge Transfer Efficiency and Constraints on Flat-Field Accuracy. Instrument Science Report WFPC2 97-08, (1997).
- [25] Kim, A., Goobar, A., and Perlmutter, S. A generalized K-corrections For Type Ia supernovae: comparing R-band photometry beyond z=0.2 with B, V, and R-band nearby photometry. Pub. Astr. Soc. Pacific 108, 190-201 (1996).
- [26] Stiavelli, M. and Mutchler, M. WFPC2 Electronics Verification. Instrument Science Report WFPC2 97-07, (1997).
- [27] Carrol, S., Press, W., and Turner, E. The cosmological constant. Ann. Rev. Astron. Astrophys., 30, 499-542 (1992).
- [28] Schramm, D. in Astrophysical Ages and Dating Methods (eds E. Vangioni-Flam et al.,) Gif sur Yvette: Editions Frontières, 1990)
Acknowledgements: We would like to thank CTIO, Keck, HST, WYIN, ESO and the ORM – La Palma observatories for a generous allocation of time and the support of dedicated staff in pursuit of this project. Dianne Harmer, Paul Smith and Daryl Willmarth were extraordinarily helpful as WIYN queue observers. We would especially like to thank Gary Bernstein and Tony Tyson for developing and supporting the Big Throughput Camera which was instrumental in the discovery of this supernova.
Correspondence and requests for materials should be addressed to Saul Perlmutter (e-mail: saul@lbl.gov).