X-Ray Emission from Early-Type Galaxies:
A Complete Sample Observed
by ROSAT
Abstract
To test the cooling flow model of early-type galaxies, we obtained a complete magnitude-limited sample of 34 early-type galaxies, observed with the PSPC and HRI on ROSAT. The X-ray to optical distribution of galaxies implies a lower envelope that is consistent with the stellar emission inferred from Cen A. When this stellar component is removed, the gaseous emission is related to the optical luminosity by , where = 3.0-3.5, significantly steeper than the standard theory ( = 1.7). The dispersion about the correlation is large, with a full range of 30-100 in for fixed . The X-ray temperature is related to the velocity dispersion temperature as , where = 1.430.21, although for several galaxies, is about twice . The excessively hot galaxies are generally the most luminous and are associated with the richest environments. We suggest a model whereby environment influences the X-ray behavior of these galaxies: early-type galaxies attempt to drive partial or total galactic winds, which can be stifled by the pressure of their environment. Stifled winds should lead to hotter and higher luminosity systems, which would occur most commonly in the richest environments, as observed.
1 Introduction
The Einstein Observatory discovered that some early-type galaxies are powerful emitters of X-rays, and that their X-ray luminosity is correlated with their optical luminosity (Forman, Jones, & Tucker 1985; Canizares, Fabbiano, & Trinchieri 1987). It also showed that the temperature of the hot gas is approximately that expected for gas that is gravitationally bound to the system. For the more luminous X-ray-emitting ellipticals, where we are confident that the X-ray emission is dominated by the hot gas, the current model posits that gas is lost by stars through normal stellar evolution and is subsequently thermalized in the potential well of the galaxy (e.g., Sarazin 1990). Radiative cooling is thought to exceed any heat sources (e.g., SNe), so that there is a net cooling, and the gas slowly flows into the center of the galaxy.
The existing picture makes certain predictions, such as that the X-ray luminosity should be proportional to the mass loss rate of stars and the depth of the potential well (approximately ), with modest dispersion, and that the temperature of the hot gas should be proportional to the velocity dispersion squared. Studies with the Einstein Observatory led to relationships that were either consistent with or steeper than the expected - slope, but with considerable dispersion about the best-fit line (Canizares, Fabbiano, & Trinchieri 1987; Donnelly, Faber & O’Connell 1990; White & Sarazin 1991; Bregman et al. 1992; Kim et al. 1992). The Einstein Observatory did not provide accurate temperature information for comparison with the velocity dispersion. ROSAT, with a factor of two improvement in spectral resolution, does permit accurate determinations of gas temperature. The first published ROSAT sample is that of Davis and White (1996), who found a correlation between X-ray temperature and stellar velocity dispersion, with temperatures greater than anticipated. Here we present X-ray luminosities from our complete survey of optically selected elliptical galaxies, and temperatures for a subset of the sample. An extensive discussion of the sample, data processing techniques, and additional statistical analysis of the sample will appear elsewhere (Brown & Bregman 1998).
2 Sample Selection and Observations
The primary goal was to define an unbiased sample of early type galaxies for which a complete set of X-ray data could be obtained. We chose an optically-selected flux-limited sample of galaxies based upon the work of Faber et al. (1989), who obtained a consistent set of distances for these galaxies. This is essential for accurately establishing the - relationship and defining the scatter about the relationship.
The number of galaxies in the sample is a compromise between the desire to have many targets while avoiding many upper limits in the sample. Based upon the - relationship from the Einstein Observatory, we estimated that the percentage of detectable galaxies decreases significantly beyond the 30–40 optically brightest galaxies, for sensible exposure times with the PSPC or HRI on ROSAT. With 30–40 objects, our Monte-Carlo calculations showed that we should be able to define the - relationship with sufficient accuracy to discriminate between competing models. Our final sample (Table 1) is comprised of the 34 optically brightest early-type galaxies in Faber et al. (1989) with , while avoiding dwarf galaxies (NGC 185, NGC 205, NGC 221) and X-ray bright quasars (e.g., M87).
Most sample galaxies are well-known elliptical galaxies that were the primary targets of studies by other ROSAT observers, so the data products for these were obtained from the archive. About one-third of the sample was observed for this project, completing the sample. Most observations were obtained with the PSPC, but the last few sources were observed with the HRI. Every galaxy is detected, unlike earlier samples. The event lists are screened for periods of high background, eliminating times for which the background count rate is greater than two times the modal value. This leads to the removal of typically 5% of the data (further details in Pildis et al. 1995). Point sources in the field of the galaxies were masked if their detection was above the surrounding regions. Flat-fielding corrections used the exposure maps provided by the SASS processing.
It is unclear how to best choose the region within which to define the X-ray emission from ellipticals because the flux increases logarithmically with radius for a typical X-ray surface brightness distribution that decreases as (=0.5; at radii large compared to the core radius). We have chosen to define the flux within an optically-defined radius since we are trying to test models related to the galaxy (e.g., mass loss from the stars). We extract our signal within a radius of 4 ( is de Vaucouleurs half-light radius), within which 85% of the optical light is contained. The background is taken between 4–6.3 for all galaxies, which removes the X-ray emission surrounding the galaxy, while maximizing the signal-to-noise. This method creates a very well defined for this sample, although we recoginize there may be an underestimation of the flux in some galaxies (discussed further in Brown & Bregman 1998). For a few galaxies, such as the weakest sources observed with the HRI, the signal is defined within 1 and extrapolated to 4 (for a =0.5 model, the correction factor is 1.57) to maintain consistency within the sample.
Raymond-Smith thermal plasma models were fit to the spectra, under the assumption of a fixed cosmic abundance of 50% (80% for NGC 4472) and adopting the Galactic (fixed for each galaxy), which is accurate to about 5% (Hartmann & Burton 1997) in the northern hemisphere and to about 10% in the southern hemisphere (Dickey & Lockman 1990). In all cases, all PI channels were utilized except for NGC 3585, NGC 4621, and NGC 5102 where the softest channels were neglected. For the 19 PSPC galaxies with enough counts to constrain the temperature (generally, 300 counts), a single-temperature model was fit. If the resulting was unacceptable, a two-temperature model was subsequently fit, with a “hard”component whose temperature was fixed at 2 keV (presumably, reflecting the stellar binary contribution); the softer component is assumed to be from the hot gas. There are no significant differences in the values determined using a 2 keV component or a 5 keV component.
Several of our galaxies have been observed by ASCA, so a comparison is worthwhile, although there are quantitative differences in the spectra. The ASCA spectra are not extracted with the same background subtraction, partly due to limitations in the point spread function, so some cluster or group emission may be included in the ASCA spectra. Also, the low-energy cutoff in the ASCA response (near 0.5 keV) makes it difficult to fit spectra cooler than 0.6 keV, and there is some concern about the calibration at low energies (e.g., Sarazin, Wise, and Markevitch 1998). Nevertheless, for single-temperature spectral fits the derived temperatures from ASCA agree with the ROSAT results to typically 5-10%. Two-temperature or multiple temperature fits are favored for nearly every early-type galaxy examined by Buote and Fabian (1997), and in the cases where NH and the hot component are similar to our values (e.g., NGC 1404), they obtain the same temperature for the cooler, gaseous component.
| Name | D | log | log | Name | D | log | log | |||||
|---|---|---|---|---|---|---|---|---|---|---|---|---|
| (Mpc) | () | erg s-1 | (keV) | (Mpc) | () | erg s-1 | (keV) | |||||
| N 0720 | 41.00 | 10.95 | 41.10 | 0.387 | 0.436* | N 4278 | 29.40 | 10.72 | 40.55 | 0.450 | ||
| N 1316 | 28.44 | 11.34 | 41.08 | 0.403 | 0.351* | N 4365 | 26.66 | 10.79 | 40.48 | 0.390 | 0.200 | |
| N 1344 | 28.44 | 10.66 | 39.47 | 0.163 | N 4374 | 26.66 | 10.99 | 41.09 | 0.524 | |||
| N 1395 | 39.80 | 11.02 | 41.04 | 0.424 | 0.437* | N 4406 | 26.66 | 11.10 | 41.80 | 0.397 | 0.823 | |
| N 1399 | 28.44 | 10.88 | 41.44 | 0.610 | 0.944 | N 4472 | 26.66 | 11.32 | 41.77 | 0.524 | 0.936 | |
| N 1404 | 28.44 | 10.74 | 41.27 | 0.323 | 0.557* | N 4494 | 13.90 | 10.20 | 39.28 | 0.300 aaAdopted value for . | ||
| N 1407 | 39.80 | 11.16 | 41.34 | 0.517 | 0.913 | N 4552 | 26.66 | 10.71 | 40.92 | 0.434 | 0.405* | |
| N 1549 | 24.26 | 10.73 | 40.04 | 0.267 | 0.186 | N 4621 | 26.66 | 10.78 | 39.79 | 0.367 | ||
| N 2768 | 30.64 | 10.79 | 40.41 | 0.248 | N 4636 | 26.66 | 10.96 | 41.81 | 0.232 | 0.717 | ||
| N 3115 | 20.42 | 10.83 | 39.74 | 0.450 | N 4649 | 26.66 | 11.14 | 41.48 | 0.740 | 0.823 | ||
| N 3377 | 17.14 | 10.21 | 39.42 | 0.108 | N 4697 | 15.88 | 10.58 | 40.13 | 0.173 | 0.206* | ||
| N 3379 | 17.14 | 10.49 | 39.78 | 0.257 | N 5061 | 23.92 | 10.53 | 39.54 | 0.233 | |||
| N 3557 | 47.98 | 11.10 | 40.61 | 0.541 | N 5102 | 3.10 | 8.95 | 37.70 | 0.500 aaAdopted value for . | |||
| N 3585 | 23.54 | 10.72 | 39.84 | 0.308 | N 5322 | 33.22 | 10.80 | 40.11 | 0.319 | 0.205 | ||
| N 3607 | 39.82 | 11.18 | 40.82 | 0.390 | 0.372 | N 5846 | 46.72 | 11.26 | 42.01 | 0.491 | 0.733 | |
| N 3923 | 31.66 | 10.99 | 40.90 | 0.297 | 0.549 | I 1459 | 44.50 | 11.14 | 41.19 | 0.601 | 0.414* | |
| N 4125 | 39.72 | 11.16 | 41.01 | 0.332 | 0.283 | N 7507 | 35.00 | 10.82 | 40.13 | 0.361 | ||
For the extraction of the flux, we used either the fitted temperatures or, for objects with few counts, we usually assumed = 1.5. For a few objects with very low values of 1.5, a minimum temperature of 0.3 keV was assumed, since lower temperatures were clearly a poor fit, even for objects with only 100 counts. We note that the luminosities are nearly independent of the metallicity assumed, and the temperatures have a modest dependence on the metallicity (for a metallicity that differs by a factor of two from our adopted value, the temperature changes by 10% or less).
3 Analysis and Interpretation of the Observations
In this analysis of the X-ray luminosities, we consider the picture by which the X-ray emission is due to a combination of hot gas and stellar X-ray sources. The stellar X-ray contribution is expected to be proportional to the optical luminosity, while the hot gas component seems to increase more rapidly with the (e.g., ). Consequently, at low optical luminosities, this would lead to a minimum , and there does appear to be a lower envelope to the - distribution (seen first by Canizares, Fabbiano, & Trinchieri 1987), bounded by a line that is linearly proportional to (Fig.1). This lower envelope can be compared to the estimate of the stellar component inferred from Cen A, the nearest non-dwarf elliptical galaxy. It was not included in our sample because it has an AGN that contributes to the X-ray emission. Cen A was studied by Turner et al. (1997), who identify a hard component, attributed to the stellar sources, and a soft component ( = 0.29 keV), attributed to emission from diffuse hot gas. These components have luminosities of 1.71039 erg s-1 (hard) and 1.81039 erg s-1 (soft) in the 0.5-2.0 keV band (d=3.5 Mpc). The optical luminosity is inferred from the spatial analysis of van den Bergh (1976), leading to a value of = 3.810. The X-ray-to-optical luminosity ratio for the hard component corresponds to the lower envelope of the - distribution, supporting the inference that it is due to stellar X-ray emission. If one attributes both the soft and hard components to stellar emission in Cen A (e.g., Irwin and Sarazin 1997), the resulting “stellar” line is higher in the - plane by a factor of two, but still consistent with the bottom of the - distribution.
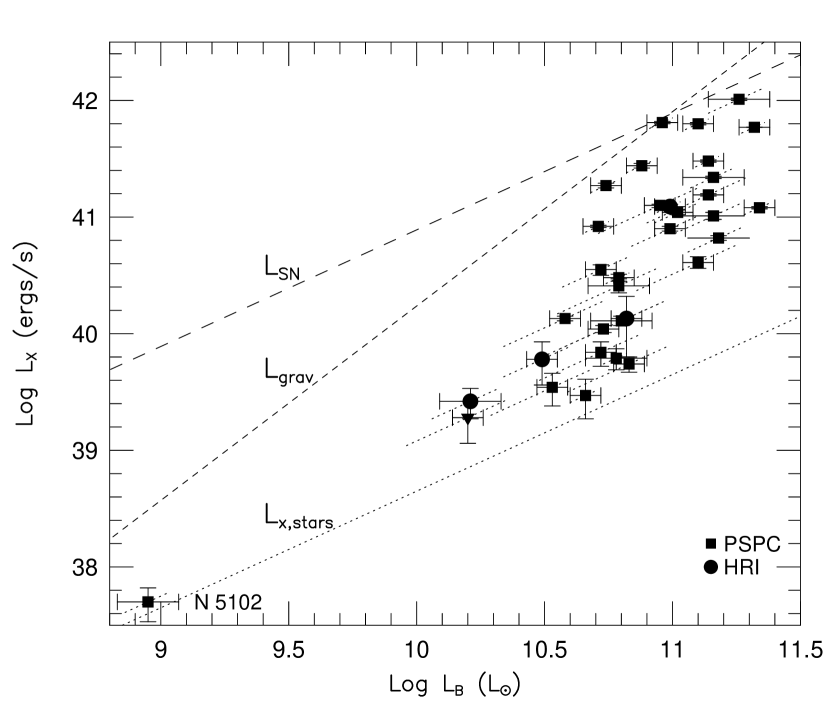
The X-ray luminosity of the brightest galaxies can be compared to the maximum amount of energy expected from gravitational energy release and supernovae. For the supernova rate, we use the mean values given by van den Bergh & Tammann (1991) and a mean energy release per supernova of 1051 ergs, which leads to log = log + 30.89. This supernova energy line bounds the distribution of X-ray emitting galaxies (Fig. 1), which indicates that supernova could provide sufficient energy to account for the hot X-ray emitting atmospheres of early-type galaxies. We note that the rate of supernova energy input is probably uncertain by a factor of two or more due to the poor determination of the energy release per supernova and to the uncertainty in the supernova rate.
The other main energy reservoir for the hot gas is the energy released as the mass loss from stars is thermalized and subsequently falls in the potential well of the galaxy. If the gas falls nearly to the center before cooling, then for an isothermal atmosphere (we use fA=1, after Canizares, Fabbiano, & Trinchieri 1987), and using the - relationship from Dressler (1984) for Virgo (), we find that log = 23.57 + (5/3)log, which also lies along the upper bound of the - distribution of the galaxies (Fig. 1). Although there may be a factor of a few uncertainty in , this estimate shows that thermalization and gravitational release could be responsible for the observed .
The slope of the relationship between and is potentially quite important and has been the subject of much previous discussion. If we exclude NGC 5102 (where the X-ray emission is consistent with a stellar origin), the log-log relationship has a slope of 2.680.25, using the orthogonal linear regression bisector method (OLS bisector; Feigelson & Babu 1992); there is considerable scatter, approximately 1.5 dex in for a fixed . When the hard, “stellar” component from Cen A is subtracted so that is only from the hot gas, the relationship becomes steeper, with a slope of 2.960.30, or 3.510.41 (hard and soft components from Cen A removed). This is much steeper than the slope of approximately 5/3 that is expected from the model where gas is thermalized, remains bound to the galaxy, and falls inward.
The wide range of for a given and the steepness of the - relationship for the gaseous emission are inconsistent with the standard cooling flow model. We suggest a modification of the model that may help to resolve these problems. In this revised picture, environment plays a central role in determining the luminosity – galaxies are trying to drive galaxtic winds, but the visibility of the X-ray emission depends on whether the wind is stifled (pressure confined) by the ambient cluster or group medium. Observations support this in that the most X-ray luminous galaxies are generally associated with the richest environments, such as the Virgo cluster (NGC 4406, NGC 4472, NGC 4636, NGC 4649), the Fornax cluster (NGC 1399, NGC 1404), or in the centers of moderate richness groups (e.g., NGC 5846).
We find that many of these luminous galaxies are significantly hotter than , another inconsistency with the basic model. There is a correlation between the X-ray temperature, , and the velocity dispersion temperature, , as is expected from theoretical arguments (Fig. 2), among the 19 galaxies for which temperatures were determined. However, the slope of the log-log relationship is 1.430.21, which is steeper than the nominal theoretical expectation ( = ). This is also significantly steeper than the slope of 0.730.10 reported by Davis & White (1996). Also, Davis & White never find = , which occurs for several of our galaxies. We have determined that the difference between our slope with that of Davis & White results partly from a difference in fitting procedures: we used the OLS bisector method, whereas Davis and White used y-on-x fitting (which yields a slope of 0.900.28 for our data). In addition, we find some galaxies systematically cooler than Davis & White primarily because we allowed for a second hard component (a less important difference is that we fixed the metal abundance at 50% solar rather than allowing it to be fit).
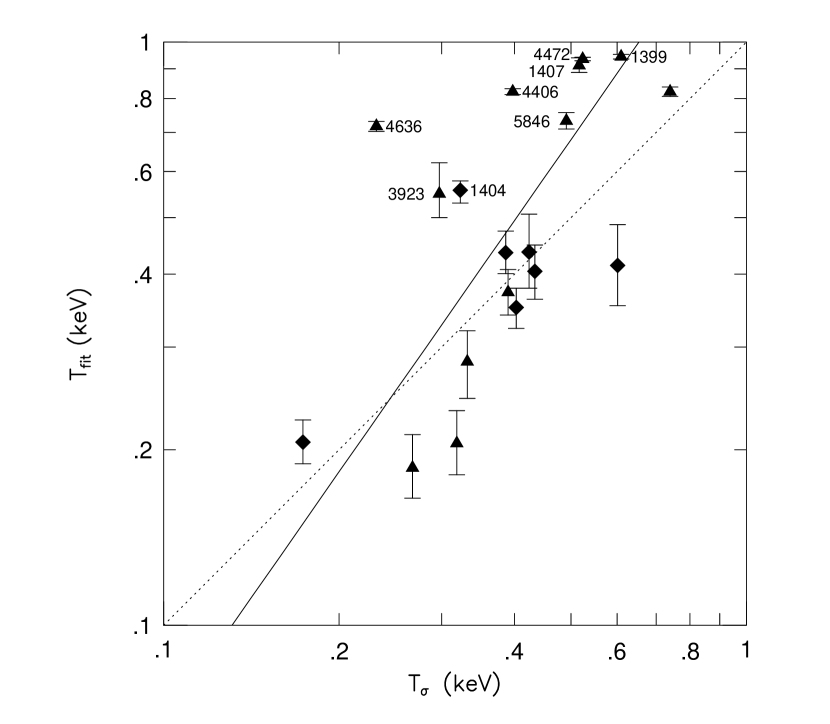
Two important features of the temperature distribution is that there is a substantial range in about either the best fit or the linear line, and that many of the galaxies have temperatures significantly above . Eight galaxies that are “too hot” relative to are NGC 1399, NGC 1404, NGC 1407, NGC 3923, NGC 4406, NGC 4472, NGC 4636, and NGC 5846. Six have X-ray temperatures that are about twice , and one galaxy, NGC 4636, is about three times hotter than its velocity dispersion temperature. This list is nearly identical, with an overlap of 7/8 galaxies, to a list of the eight most X-ray luminous galaxies: NGC 1399, NGC 1404, NGC 1407, NGC 4406, NGC 4472, NGC 4636, NGC 4649, and NGC 5846 (in increasing NGC number).
In our revised picture, the energy from supernovae is sufficient to heat the gas significantly above , thereby driving a partial galactic wind in the most massive galaxies and a more complete wind in less massive galaxies. Galactic winds that extend to very large distances transport most of the energy away as kinetic energy, so their X-ray luminosities can be very low, which would be consistent with the low values of for many of the galaxies in poor environments. Systems with partial galactic winds have a higher X-ray luminosity because the bound gas radiates its energy in the usual manner of a cooling flow; this would be common in the more massive galaxies. However, if there is a high-pressure ambient medium, as is found in a cluster, a terminal shock will occur near the galaxy, converting the kinetic energy to thermal energy, permitting the gas to accumulate, and creating a substantial emission measure (under some conditions, a galactic “breeze” solution may occur, which also should permit significant radiative losses). The published supernova rates are sufficient to heat the gas to 1 keV (or greater) and drive a wind (using either the rates of van den Bergh & Tammann 1991 or Cappellaro et al. 1997). Also, the ambient pressure in environments such as the Virgo cluster (Nulsen & Bohringer 1995) are adequate to balance the pressure in the hot galactic medium (Brighenti & Mathews 1997) in the 10-100 kpc range.
Environment may have several effects on the hot gas content of a galaxy. In a very dilute surrounding medium, a galactic wind would occur, but in a poor cluster, such as Virgo, the ambient medium may be adequate to pressure confine a wind, enhancing the X-ray luminosity of a galaxy. A competing process is ram-pressure stripping, which would remove hot galactic gas, ultimately reducing its X-ray luminosity (Takeda, Nulsen, & Fabian 1984; Gaetz, Salpeter, & Shaviv 1987; Sarazin & White 1988). In very rich clusters, ram-pressure stripping should be the dominant process, so X-ray emission from hot galactic gas may be unimportant.
The primary weakness of our suggestion lies with the metallicity, which is expected to be above the solar value given the observed supernova rates (Sarazin 1997). The X-ray metallicities would suggest that the true supernova rate is 3-10 times lower than the published rates. An alternative explanation is that the observed supernova rates are accurate but that the metals are not mixed effectively into the hot galactic gas (see also Ciotti et al. 1991). Ineffective mixing of the metals would be necessary for our picture to remain viable. We look forward to the results of the ongoing supernova searches with CCD detectors, which should determine the observed rate to much higher accuracy.
References
- (1)
- (2) Bauer, F., & Bregman, J. N. 1996, ApJ, 457, 382
- (3) Bregman, J. N., Roberts, M. S., & Hogg, D. E. 1992, ApJ, 387, 484
- (4) Brighenti, F., & Mathews, W.G. 1997, ApJ, in press
- (5) Buote, D. A., & Fabian, A. C. 1997, MNRAS, in press
- (6) Canizares, C. R., Fabbiano, G., & Trinchieri, G. 1987, ApJ, 312, 503
- (7) Cappellaro, E., Turatto, M., Tsvetkov, D.Y., Bartunov, O.S., Pollas, C., Evans, R., & Hamuy, M. 1997, A&A, 322, 431
- (8) Ciotti, L., D’Ercole, A., Pellegrini, S., & Renzini, A. 1991, ApJ, 376, 380
- (9) Davis, D. S., & White, R. E. 1996, ApJ, 470, L35
- (10) Dickey, J. M., & Lockman, F. J. 1990, ARA&A, 28, 215
- (11) Donnelly, R. H., Faber, S. M. & O’Connell, R. M. 1990, ApJ, 354, 52
- (12) Dressler, A., 1984, ApJ, 281, 512
- (13) Faber, S. M., Wegner, G., Burstein, D., Davies, R. L., Dressler, A., Lynden-Bell, D., & Terlevich, R. J. 1989, ApJS, 69, 763
- (14) Feigelson, E. D., & Babu, G. J. 1992, ApJ, 397, 55
- (15) Forman, W., Jones, C., & Tucker, W. 1985, ApJ, 293, 102
- (16) Gaetz, T. J., Salpeter, E. E., & Shaviv, G. 1987, ApJ, 316, 530
- (17) Hartmann, D., & Burton, W. B. 1997, “Atlas of Galactic Neutral Hydrogen”, Cambridge University Press
- (18) Irwin, J. A., & Sarazin, C. L. 1997, ApJ, in press
- (19) Kim, D. W., Fabbiano, G., & Trinchieri, G. 1992, ApJ, 393, 134
- (20) Loewenstein, M., & Mathews, W. G. 1991, ApJ, 373, 445
- (21) Loewenstein, M., Mushotzky, R. F., Tamura, T., Ikebe, Y., Makishima, K., Matsushita, K, Asaki, H., & Serlemitsos, P. J. 1994, ApJ, 436, L75
- (22) Nulsen, P. E. J., & Bohringer, H. 1995, MNRAS, 274, 1093
- (23) Pildis, R. A., Bregman, J. N., & Evard, A. E. 1995, ApJ, 443, 514
- (24) Sarazin, C. L. 1997, in The Nature of Elliptical Galaxies, ed. M. Amobili, G. DaCosta & P. Saha (San Francisco: PASP), in press
- (25) Sarazin, C. L. 1990, in The Interstellar Medium in Galaxies, ed. H. A. Thronson, Jr. & J. M. Shull (Dordrecht: Kluwer), p. 201
- (26) Sarazin, C. L. & White, R. E. 1988, ApJ, 331, 102
- (27) Sarazin, C. L., Wise, M. W., and Markevitch, M. L. 1998, ApJ, in press.
- (28) Takeda, H., Nulsen, P. E. J., & Fabian, A. C. 1984, MNRAS, 208, 261
- (29) Turner, T. J., George, I. M., Mushotzky, R. F., & Nandra, K. 1997, ApJ, 475, 118
- (30) van den Bergh, S. 1976, ApJ, 208, 673
- (31) van den Bergh, S., & Tammann, G. A. 1991, ARA&A, 29, 363
- (32) White, R. E., & Sarazin, C. L. 1991, ApJ, 367, 476