WINDS IN OB-TYPE STARS
Abstract
The International Ultraviolet Explorer satellite has made a tremendous
contribution to the study of hot-star winds. Its long lifetime has
resulted in the collection of ultraviolet spectra for a large sample
of OB stars. Its unique monitoring capability has enabled detailed
time-series analyses to investigate the stellar-wind variability for
individual objects. IUE has also been a major driver for the
development of the radiation-driven-wind theory; the synergy between
theory and observations is one of the main reasons for the large
progress that has been made in our understanding of hot-star winds and
their impact on the atmospheres and evolution of massive stars.
Key words: hot stars; stellar winds; variability.
1. INTRODUCTION
OB-type stars, with masses ranging from about 8 to up to more than 100 M⊙, are hot ( K) and luminous ( L⊙). The brightest supergiants with an absolute visual magnitude M are visible up to the Virgo cluster (m) and thus potential candidates for the study of stellar populations in external galaxies. Because of their high luminosity, OB-type stars do not grow old (lifetime years) and thus trace star-forming regions.
From the shape of several strong spectral lines in their spectrum (like, e.g., the ultraviolet resonance lines of N v, Si iv, and C iv), it becomes immediately clear that OB stars lose a vast amount of material through a stellar wind. The blue edges of these so-called P Cygni-type profiles indicate maximum outflow velocities (few km/s) exceeding the surface escape velocity by a factor between 1 and 3 (Abbott ??, Prinja et al. ??). The associated mass-loss rates, most reliably measured from the stellar wind’s free-free emission observed at radio wavelengths (Bieging et al. 1989), strongly depend on the OB-star’s luminosity (ṀL1.6) and range from about to more than M⊙/yr. Thus, during their lifetime OB stars lose a significant fraction of their initial mass, making mass loss a key ingredient in the description of their evolution (cf. Maeder & Conti ??, Chiosi ??). Furthermore, hot-star winds play a dominant role in providing momentum, energy, and nuclearly processed material to the interstellar medium (Abbott ??, Castor ??).


In the following we will concentrate on the contribution of IUE to the study of hot-star winds. Why was the IUE satellite so important for this field of research? First of all, the main part of the OB-star spectrum is emitted in the far-UV, and, due to atomic physics, that is also the region where most of the important lines are situated. The UV resonance lines provide excellent diagnostics of the stellar-wind structure. Knowledge of the wind structure is essential if one wants to derive the stellar atmospheric parameters (cf. Kudritzki ??), since practically all spectral lines are affected by the presence of a stellar wind. An important point we want to stress in this paper is that the success of IUE in this field of astronomy is for a substantial part based on the rapid and parallel progress made by theory. Each time a new IUE proposal had to be written we could report on the recent theoretical developments and predictions which could be tested with new observations.
The IUE archive contains high-resolution spectra () for a large sample of OB stars (), which has enabled the study of stellar-wind properties as a function of spectral type. Several atlases have been constructed showing the IUE spectra of O stars (Walborn et al. ??), B stars (Rountree & Sonneborn ??), and the UV P Cygni profiles of stars with spectral types between O3 and F8 (Snow et al. ??). The “zoo” of OB stars contains many different species: “normal” OB main sequence stars, giants, supergiants; subdwarf OB stars (Heber); Wolf-Rayet stars (Willis); Luminous Blue Variables (Shore, Wolf); Central Stars of Planetary Nebulae; Be stars (Smith); B[e] stars; Cep stars; magnetic B stars; hot binaries (Stickland); etcetera. Within brackets reference is made to the author of a contribution in these proceedings covering the respective type of stars; we will focus on the “normal” OB stars.
The second part of this paper deals with the variability aspect of hot-star winds, a topic that could be studied because of the unique monitoring capacity of IUE. Mainly on the basis of IUE observations it could be demonstrated that variability is a fundamental property of radiation-driven winds, that it is not chaotic, but systematic, and that its characteristic timescale is determined by the stellar rotation period.
2. THE PHYSICS OF HOT-STAR WINDS
That the driving of hot-star winds is based on the interplay between gravity and the stellar radiation field becomes already apparent from the observed relation between the terminal velocity of the wind, , and the escape velocity (Abbott ??), and the relation between the mass-loss rate and stellar luminosity (Garmany & Conti ??). In principle, one should be able to inverse the latter relation in order to derive the luminosity, and thus the distance, from the observed mass-loss rate, were it not for the relatively large scatter in this relation.
Radiation-driven winds work on the principle that momentum contained in the stellar radiation field is transferred to gas particles in the wind via the scattering of photons. The main point is that momentum is a vector quantity and that the photons before scattering are all moving in one direction, i.e. away from the star, while they move in a “random” direction after the first scattering. The result is that the associated radiative force is directed away from the star. The scattering process takes place via spectral lines of the gas particles in the outer atmosphere. Lucy & Solomon (??) were among the first to realize that the scattering of photons over a few strong (resonance) lines would result in a strong enough force to drive a wind. An essential ingredient is that the wind on its way out reaches velocities which are about a 100 times larger than the typical thermal width of the spectral lines, so that due to the doppler shift of the lines many more photons can be “tapped” compared to the static case. Castor, Abbott, and Klein (CAK, ??) improved upon this result by incorporating also weak stellar lines, and were able to qualitatively reproduce the observed relations between and , and between Ṁ and L.

This was the state of the theory in the pre-IUE era. After the collection of ultraviolet spectra of many OB stars and measuring and Ṁ for a large sample of stars, it became clear that CAK theory had to be modified to quantitatively explain the observations. Independently, Friend & Abbott (??) and Pauldrach, Puls, and Kudritzki (??) improved on CAK theory by dropping some of the assumptions, the most important one being that the star is extended instead of a point source. Since then, radiation-driven wind theory has been further refined, in parallel with the development of non-LTE atmosphere models for hot stars; more than a million of different lines from over a hundred different ionic species are taken into account to calculate the radiative force (e.g. Pauldrach et al. ??) and the resulting hydrodynamic structure of the stellar wind. It is now possible to model OB-star spectra quantitatively, consistently treating the photospheric and wind lines using so-called unified model atmospheres (cf. Kudritzki & Hummer ??, Kudritzki ??).
Figure 1 shows model fits to the UV resonance lines of the O9 Iab supergiant HD210809 (Haser ??). An improvement with respect to the SEI method (Lamers et al. ??, Groenewegen & Lamers ??) is that Haser’s method allows a dependence of the turbulent velocity on velocity, which is predicted by theory (see below). The fits can be used to determine Ṁ, , and the -parameter (which defines the steepness of the velocity law). Although can be derived very accurately (typically 5% accuracy), the determination of Ṁ is very difficult, mainly because of the large uncertainty in the degree of ionization . Instead, the mass-loss rate can be much more precisely obtained from the H profile (Puls et al. ??). An example is given in Figure 2 for the O5 Iaf+ supergiant HD14947. A nice demonstration of the present state of the art is presented by Taresch et al. (1997), who model the most luminous and most massive star in our galaxy, HD93129A. One of their conclusions is that modelling of the far-UV spectrum is only possible when taking the interstellar absorption spectrum properly into account.

2.1. The Wind Momentum Luminosity Relation
As discussed in the previous section, the physics of hot-star winds strongly depend on the stellar radiation field. Would it be possible to determine the OB-star luminosity from its stellar-wind properties? In a recent review, Kudritzki (??) argues that the observed relation between wind momentum (Ṁ) and luminosity is very tight and can be used to derive distances to OB stars (see also Lamers & Leitherer ??, Puls et al. ??). Leaving out some terms with only a weak dependence on (other) stellar parameters, one obtains from theory a wind-momentum luminosity (WML) relation of the following form (Kudritzki ??):
where is a parameter which depends on the shape of the line strength distribution and the ionization structure of the stellar wind. This already indicates that the WML relation should depend on metallicity.
Using the techniques described above, an empirical WML relation can be constructed by deriving Ṁ and from the spectra of a number of stars with known luminosity (and radius!). The result based on a sample of galactic supergiants of type A, B, and O is shown in Figure 3 (Puls et al. ??, Kudritzki ??). Indeed, a tight WML relation is observed, with possibly a slightly different slope for the O supergiants with respect to the A and B supergiants (filled circles). The empirical WML relation can be calibrated as a function of metallicity by observing blue supergiants in nearby galaxies with a different metallicity (e.g. LMC, SMC). When this has been done, the WML relation can be used to determine distances to blue supergiants beyond the local group, out to the Virgo and Fornax clusters of galaxies. Kudritzki (??) argues that the uncertainties in distance modulus obtained with the WML method are comparable to those for individual Cepheids in galaxies if the period-luminosity relation is applied. The advantage of the WML method is that an individual reddening (and therefore extinction) can be derived for every object by comparing its observed colors with the model predictions. However, the possible impact of spectral variability (see section 3) on these results has to be investigated.
2.2. Instability of Radiation-Driven Winds
Radiation-driven winds are excellent laboratories for the study of radiation hydrodynamics; fundamental contributions to this field of physics stem from the observations of hot-star winds. Hydrodynamical, time-dependent (1-dimensional) simulations of radiation-driven winds have shown that the acceleration mechanism contains a potent instability. In their seminal paper, Lucy & Solomon (??) already remarked that radiation-driven flows are unlikely to be steady. A small perturbation in velocity of a fluid element with respect to the surrounding gas will result in a strong increase (or decrease) of the acceleration of the ions in this element, because they are suddenly exposed to the unattenuated stellar continuum flux (or “shadowed” by the low-velocity wind closer to the star). This instability leads to the formation of shocks caused by high-velocity, low-density material running into low-velocity, high-density regions in front (Owocki et al. ??, Owocki ??). Thus, a radiation-driven wind is expected to be highly structured on relatively small scales.
The non-monotonic velocity and density structure of radiation-driven winds and the predicted formation of shocks provide a solution to a number of important observational facts: (i) the saturation of strong UV resonance lines; (ii) the observed soft X-ray emission of hot stars; and (iii) the observation of ions (e.g. O vi, N v) in the wind that cannot be explained by the temperature of the radiation field (so-called super ionization). Lucy (??) showed that in a shocked stellar wind a photon has to penetrate several (in stead of one) “resonance zones” before it can escape. This explains the formation of P Cygni profiles with black absorption troughs (as in Figure 1, see Puls et al. ??). The observed soft X-ray emission from hot stars (Chlebowski et al. ??, Berghöfer et al. ??) cannot be due to the star itself or a hypothetical corona since the stellar wind is optically thick at soft X-ray wavelengths. The X-ray emission has to originate in the outer wind regions. The existence (and interaction) of shocks in the wind could provide a natural explanation (Lucy ??, Feldmeier ??). The super ionization might as well be the result of the produced X-ray flux in the wind (Pauldrach et al. ??).
3. VARIABILITY IN HOT-STAR WINDS
IUE has proven to be a powerful tool for the study of variability in the supersonically expanding winds of hot stars. In particular, the blue-shifted absorption parts of the UV P Cygni lines show dramatic changes with time. Some of these profiles contain “narrow” absorption components, first recognized in Copernicaus spectra of OB-type stars, at velocities close to the terminal velocity of the wind (e.g. Underhill ??, Snow & Morton ??). Lamers et al. (??) reported the presence of narrow components in 17 out of 26 OB stars at a typical velocity of 0.75 and a mean width of about 0.18 . Later time-resolved studies with IUE (e.g. Henrichs ??, Prinja & Howarth ??, Henrichs ??) showed that these narrow components are variable in velocity and profile. Continuous time series of UV spectra revealed that narrow components evolve from broad absorption features, which appear at low velocity and accelerate to higher wind velocities while narrowing (Prinja et al. ??, Prinja & Howarth ??, Henrichs et al. ??). The current name of these variable absorption features is discrete absorption components (DACs), which are the most prominent features of variability in hot-star winds. Because of their specific shape, DACs are readily recognized in single “snapshot” spectra. Howarth & Prinja (??) detected DACs in more than 80% of the IUE spectra in a sample of 203 galactic O stars. Grady et al. (??) and Henrichs (??) also found DACs in many Be stars, although not in non-supergiant B stars. Thus, the occurrence of DACs is a fundamental property of hot-star winds, and knowing how DACs develop is considered essential for our understanding of stellar-wind physics.
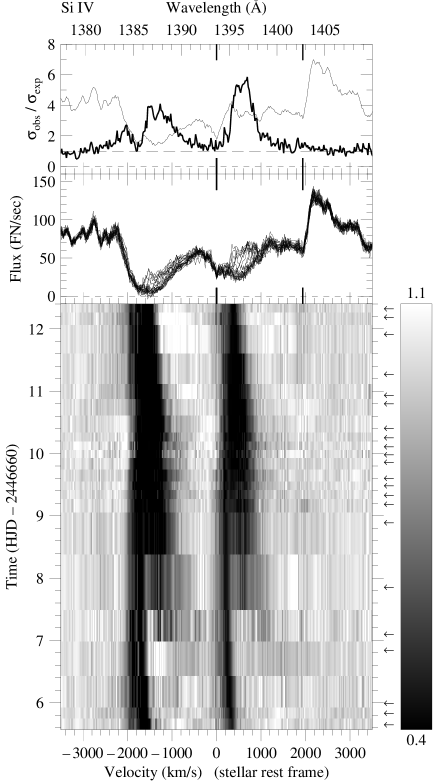
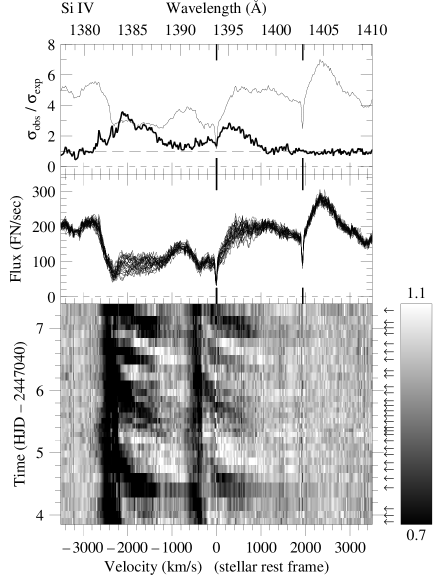
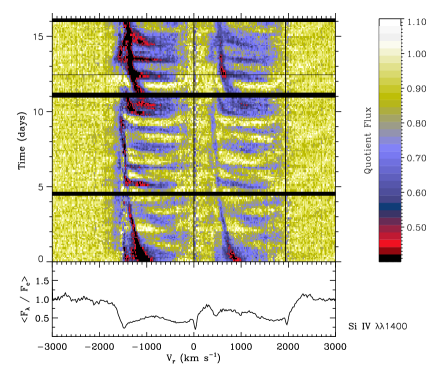
In search for the origin of stellar-wind variability, several monitoring campaigns have been organized with IUE. Since the typical timescale of variability is on the order of hours to days, continuous monitoring over a period of several days is essential. For this reason, dozens of NASA and ESA “shifts” had to be scheduled in sequence to the same observing program. On the basis of these observing campaigns it became clear that wind variability is systematic. Figures 4 and 5 show examples of the DAC behaviour in the Si iv resonance doublet of the O9.5 Ib supergiant 19 Cep and the O7.5 III giant 68 Cyg. The bottom panel gives a grey-scale representation of the evolution of DACs as a function of time (running upwards). The DACs start at low velocity ( ) as broad absorption features and, while narrowing, move towards the blue until they reach an asymptotical velocity. This velocity is systematically lower (by 10-20%) than the maximum “blue edge” velocity observed in saturated P Cygni lines. The proposed solution is that the asymptotic DAC velocity has to be identified with the “real” of the stellar wind and that the additional blue-shift in saturated P Cygni lines is caused by turbulence (i.e. the local spread in velocity due to the shocked wind structure, see section 2.2). Thus, DACs provide a diagnostic to measure ; fortunately, Prinja et al. (??) demonstrated that the so-called , the last saturated point in a P Cygni profile measured in the direction of increasing blue-shift, shows a tight correlation with the corresponding asymptotic DAC velocity, so that it is still possible to obtain from a single UV spectrum.
Obviously, in saturated resonance lines DACs cannot be observed; the steep blue edge of these profiles, however, often shows regular shifts of up to 10% in velocity, on a timescale comparable to that of the DACs. This edge variability is presumable related to the DAC behaviour; the observed differences in the asymptotic velocities of the DACs combined with optical depth effects might cause the less regular behaviour of the high-velocity edges (cf. Kaper et al. ??).
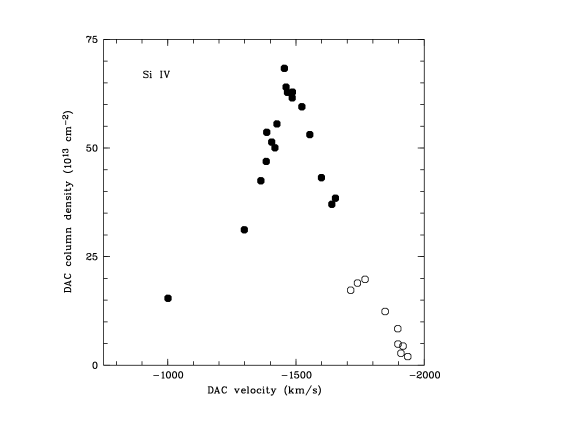
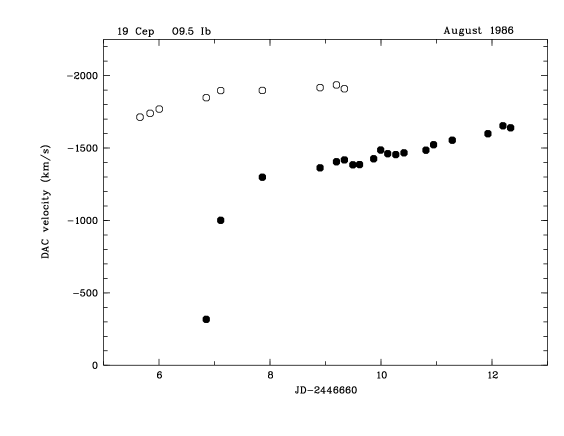
Figures 6 and 7 show the results of a quantitative analysis of the DAC behaviour in the Si iv resonance lines of 19 Cep (see also Figure 4). The migrating DACs were modelled in the way described by Henrichs et al. (??) after division of the spectrum by a minimum-absorption template (Kaper et al. ??). The central velocity, central optical depth, width, and column density was measured for each pair of DACs in the UV resonance doublets. In Figure 6 a newly formed DAC accelerates towards the asymptotic velocity already reached by the narrow absorption component present from the beginning of the observing campaign. The acceleration is much slower than expected for a “normal” velocity law; the acceleration timescale appears to be longer for stars with a longer DAC recurrence timescale (see below). The corresponding change in column density is displayed in Figure 7. As is also found to be true in general, the DACs reach a maximum at a velocity of about 0.75 and subsequently fade in strength. In cases where more than one resonance doublet was available to measure DACs, consistent results were obtained, supporting the interpretation that DACs correspond to changes in wind density and/or velocity rather than changes in the ionization structure of the stellar wind. It turns out that the DAC “pattern” is characteristic for a given star, but differences are found from year to year (e.g. the strength of the individual DACs, see Kaper et al. ??, ??).
| Name | Sp. Type | (days) | Reference | ||||
|---|---|---|---|---|---|---|---|
| (Walborn) | (km s-1) | () | (days) | UV | H | ||
| Oph (R) | O9.5 V | 351 | |||||