KiloHertz Quasi-Periodic Oscillations in the Z sources GX 3400, Cygnus X-2, GX 172, GX 51, and Scorpius X-1
Abstract
We have discovered kiloHertz quasi-periodic oscillations (kHz QPOs) in five Z sources: GX 3400, Cygnus X-2, GX 172, GX 51, and Scorpius X-1. In all sources the properties of these kHz QPOs are very similar and closely related to the position of the sources on the Z track traced out in the X-ray color-color diagram and the hardness-intensity diagram. The frequencies of the kHz QPOs increase when the sources move from the left end of the horizontal branch to horizontal/normal branch vertex, thus with inferred mass accretion rate. Only for Scorpius X-1 the kHz QPOs have been observed down the normal branch unto the flaring branch. The strength and the FWHM of the higher-frequency kHz QPOs decrease with mass accretion rate, but when the lower-frequency kHz QPOs are detected the strength and the FWHM of this QPO stay approximately constant with mass accretion rate. In Scorpius X-1 the frequency separation between the kHz QPOs decreases with mass accretion rate, but in the other Z sources the separation remains approximately constant, although a similar decrease in peak separation as found in Scorpius X-1 can not be excluded.
Introduction
KiloHertz quasi-periodic oscillations (kHz QPOs) have been observed for more then a dozen low-mass X-ray binaries (LMXBs) with the Rossi X-ray Timing Explorer (RXTE). Five of those LMXBs are part of the subclass called Z sources hk89 . Z sources trace out a Z like shape in the X-ray color-color diagram (CD) and hardness-intensity diagram (HID). The branches are called horizontal branch (HB), normal branch (NB), and flaring branch (FB). The mass accretion rate is thought to increase from the HB, via the NB, to the FB hk89 . The timing behavior below 100 Hz is closely related to the position of the source on this Z track (see van der Klis 1995 klis95 for a review). In this paper we summarize the results of the properties of the kHz QPOs in Z sources and we will show that the properties of these kHz QPOs are also related to the position of the sources on the Z track.
Observations and analysis
We observed all Z sources on several occasions with the proportional counter array (PCA) onboard RXTE. For the details of the observations we refer to van der Klis et al. (1996 klis96 ; 1997 klis97 ; Scorpius X-1), Wijnands et al. (1997 wijnands97 ; 1998a wijnands98a ; 1998b wijnands98b ; GX 172, Cygnus X-2, and GX 51), and Jonker et al. (1998 jonker ; GX 3400). On several occasions only 3 or 4 out of the five PCA detectors were on. For constructing the CDs and HIDs we used only the data of the three detectors which were always on. In our power spectrum analysis we used all data available. Power spectra were selected by the position of the sources on the their Z tracks.
Results and discussion
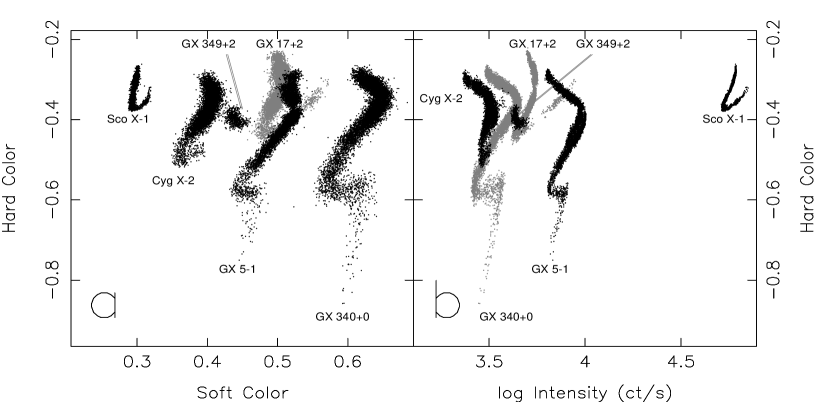
The X-ray color-color diagrams and hardness-intensity diagrams of the Z sources are shown in Figures 1a and 1b, respectively. Also the data of the Z source GX 3492, which has only been observed for a short period of time (see Kuulkers & van der Klis 1997 kuulkers ), has been included. For Scorpius X-1 we have only plotted a very small part of the total available data. The spectral data of Scorpius X-1 are affected by instrumental effects mainly due to different offset angles used at the time of the observations. We only plotted data with similar offset angles.
We observe a clear Z track for all the Z sources, except for GX 3492, showing all three branches. The Z tracks of the two Z sources GX 51 and GX 3400 are very similar in shape. Both sources trace out a clear Z track and an extra branch is available at the end of the FB. Such behavior has already been reported before in GX 51 kuulkers94 and GX 3400 penninx91 .
In all the Z sources, except GX 349+2 kuulkers , we discovered kHz QPOs with frequencies between 300 and 1100 Hz on the horizontal branch klis96 ; klis97 ; wijnands97 ; wijnands98a ; wijnands98b ; jonker . Typical power density spectra of GX 51 and GX 3400 showing the kHz QPOs in these sources are shown in Figure 2. Figures of the kHz QPOs in the other sources can be found elsewhere (Scorpius X-1: klis96 ; klis97 ; GX 172: wijnands97 ; Cygnus X-2: wijnands98a ). The only source for which the kHz QPOs are also observed on the (lower) normal branch and the flaring branch is Scorpius X-1 klis96 ; klis97 .

In all the Z sources for which kHz QPOs have been discovered, the properties of the kHz QPOs as a function of the position of the sources on the Z track are very similar and are strongly related to the position of the source on the Z track. Both kHz QPOs increase in frequency when the inferred mass accretion rate increases. The rms amplitude and the FWHM of the higher-frequency kHz QPO decreases with mass accretion rate, but the rms amplitude and FWHM of the lower-frequency kHz QPO stays approximately constant when this QPO is detected. Typically the rms amplitude of the higher-frequency kHz QPO decreases from 5–6% (in the energy range 5.0–60 keV) at the left end of the HB to 2% at the HB/NB vertex, whereas the lower-frequency kHz QPOs remains approximately constant at 2–4% (depending on the source). In Scorpius X-1 the frequency separation between the kHz QPOs decreases with mass accretion rate klis97 , but in the other Z sources the separation remains approximately constant (although a similar decrease in peak separation as found in Scorpius X-1 can not be excluded).
Simultaneous with the kHz QPOs in all the Z sources displaying kHz QPO behavior, the horizontal branch QPO and its second harmonic are observed. This rules out the possibility that both types of QPOs are caused by the same physical mechanism. Recently, Stella & Vietri (1998 stella ) proposed that the low frequency QPOs observed in several less luminous LMXBs are due to a precession of the innermost disk region, dominated by the Lense-Thirring effect. Following their reasoning and assumptions, and assuming that the neutron star spin frequency is the kHz QPO separation (290–360 Hz, depending on the source), we derive maximum precession frequency significantly (about a factor 2) below the observed frequencies of the HBOs in the Z sources. For Lense-Thirring precession to explain the HBO one would have to postulate that the observed HBO frequencies are those of the second harmonic of the precession frequency, or that the neutron star spin frequency is twice the peak separation.
References
- (1) Hasinger, G., & van der klis, M. 1989, A&A, 225, 79
- (2) van der Klis, M., 1995, In: X-ray binaries, eds. W. H. G. Lewin, J. van Paradijs, E. P. J. van den Heuvel (Cambridge University Press), p252
- (3) van der Klis, M., Swank, J. H., Zhang, W., Jahoda, K., Morgan, E. H., Lewin, W. H. G., Vauhgan, B., & van Paradijs, J. 1996, ApJ, 469, L1
- (4) van der Klis, M., Wijnands, R. A. D., Horne, K., & Chen, W. 1997, ApJ, 481, L97
- (5) Wijnands, R. A. D., Homan, J., van der Klis, M., Méndez, M., Kuulkers, E., van Paradijs, J., Lewin, W. H. G., Lamb, F. K., Psaltis, D., & Vaughan, B. 1997, ApJ Letters, in press
- (6) Wijnands, R., Homan, J, van der Klis, M., Kuulkers, E., van Paradijs, J., Lewin, W. H. G., Lamb, F. K., Psaltis, D., Vaughan, B. 1998a, ApJ Letters, in press
- (7) Wijnands, R., et al. 1998b, ApJL, in preparation
- (8) Jonker, P., et al. 1998, ApJL, in preparation
- (9) Kuulkers, E., & van der Klis, M. 1997, A&A, in preparation
- (10) Kuulkers, E., van der Klis, M., Asai, K., Dotani, T., van Paradijs, J., & Lewin, W. H. G. 1994, A&A, 289, 795
- (11) Penninx, W., Lewin, W. H. G., Tan, J., Mitsuda, K., van der Klis, M., & van Paradijs, J 1991, MNRAS, 249, 113
- (12) Stella, L., & Vietri, M. 1998, ApJ, 492, L59