Abstract
The numerous extragalactic and cosmological motivations of the DENIS and 2MASS near infrared surveys are outlined. The performance of the DENIS survey is estimated from of high galactic latitude data (). Simple star/galaxy separation methods are presented and comparison with 300 visually classified objects as well as COSMOS and APM classifications. We find that the peak intensity over isophotal area is an excellent star/galaxy separation algorithm, fairly robust to variations of the PSF within the frames, achieving 98.5% completeness and 92.5% reliability for , in comparison with visual classification. A new estimate of the photometric accuracy for galaxies is presented. The limiting factors for homogeneous galaxy extraction at high galactic latitudes are completeness and photometric accuracy in , photometric accuracy in and star/galaxy separation in (also used for classification in and ). Galaxy counts are presented on . The counts are in excellent agreement with a Euclidean extrapolation of the published counts around (more so than in all previous studies), and thus point to a high normalization at the bright end, in contrast with the counts published from the APM and COSMOS plate scans. The -band differential galaxy counts follow the relation . Extrapolation of these high latitude counts suggest that DENIS will produce highly homogeneous catalogs of (), () and, () galaxies, respectively with photometric accuracy of in and in and . Larger highly homogeneous samples are expected with improvements to the camera and the algorithms.
1 Introduction
The DENIS consortium has been imaging the southern sky in the , and wavebands since December 1995. When the survey is complete, around 2000–2001, we expect to have extracted tens of thousands of galaxies in , roughly one million in , and a few million in (see § 7 below for our estimated sizes of homogeneous, highly complete, reliable and photometrically accurate galaxy catalogs).
Much of the information in this review has been given elsewhere (Mamon et al. 1997b). The notable improvements here are improved reliability estimates from a much larger visually classified sample, a first-order optimization of star/galaxy separation yielding a one-half magnitude improvement in the high completeness/reliability magnitude limit and a more accurate estimate of the photometric accuracy.
2 Prospective scientific impact
Wide-angle near infrared (hereafter NIR) galaxy surveys, such as DENIS and 2MASS (see Schneider, Jarrett, Rosenberg and Cutri, all in these proceedings) will have a wide array of scientific prospects, of which a few are listed below. The two important advantages of NIR selection are 1) the near transparency of interstellar dust in our foreground Galaxy and within external galaxies, and 2) the low sensitivity of NIR light to recent star formation in galaxies (see Mamon et al. 1997b), hence a better estimation of the stellar mass content of galaxies in the NIR.
Statistics of NIR properties of galaxies:
DENIS and 2MASS will provide the first very large galaxy databases with NIR photometry. Photometry of the brighter galaxies will be coupled with redshift measurements, either already made, or performed during spectroscopic followups (see, e.g., Mamon 1996; Paturel, in these proceedings) to be used for distance estimates and computation of precise parameters of the fundamental plane and Tully-Fisher relations (see Vauglin et al. 1997; Rosenberg, in these proceedings).
Cross-identification with other wavelengths:
The extragalactic objects extracted by DENIS and 2MASS will be cross-identified with analogous samples at other wavelengths, such as optical galaxy samples, for example in the Zone of Avoidance (see Kraan-Korteweg et al., in these proceedings), IRAS galaxies (Saunders et al. 1997), quasars (see Cutri, in these proceedings), radio-galaxies, galaxies found in blind HI surveys (see Kraan-Korteweg et al., in these proceedings), etc. The NIR properties (mainly their location in color-color diagrams) of such objects will be targeted for discovering new large samples of such objects. One should expect followups at non-NIR wavelengths of DENIS and 2MASS galaxies.
Galaxy counts:
There has been a debate on the level of galaxy counts at the bright end, as first estimates (Heydon-Dumbleton et al. 1989; Maddox et al. 1990) found a depletion relative to the extrapolation of the faint-end counts, while later work (e.g. Bertin & Dennefeld 1997) disputed this. This debate has consequences on galaxy evolution and on whether the environment of the Local Group is underdense on very large scales ().
Zone of avoidance
There are two main applications for studying galaxies behind the Galactic Plane (see Kraan-Korteweg et al., in these proceedings): 1) Mapping the large-scale distribution of galaxies in this still poorly known region. Indeed, the Zone of Avoidance contains interesting structures such as the largest large-scale concentration of matter in the local Universe, the Great Attractor (at the intersection of the Supergalactic Plane and the Galactic Plane, Kolatt, Dekel & Lahav 1995) and within the Great Attractor, the Norma cluster, Abell 3627, richer and closer than the Coma cluster (Kraan-Korteweg et al. 1995). 2) The fluxes and angular sizes of galaxies are affected by extinction from dust in the Galactic Plane, and one can measure this extinction from galaxy counts (Burstein & Heiles 1982), colors (Mamon et al. 1997a), and color-color diagrams (Schröder et al. 1997, and Kraan-Korteweg et al., in these proceedings).
Small-scale structures of galaxies
Only a few catalogs of clusters (Lumsden et al. 1992; Dalton et al. 1997; Escalera & MacGillivray 1995, 1996) and compact groups (Prandoni, Iovino & MacGillivray 1994) are based upon automatically selected galaxy samples, which happen to be optical and photographic (hence subject to photometric non-linearities). Because star formation is probably enhanced by galaxy interactions, one expects that the statistical properties of pairs, groups and clusters of galaxies built from NIR selected galaxy catalogs will be different from those built from optical catalogs. DENIS and 2MASS will thus have the double advantage of using a NIR galaxy sampled based upon linear (non-photographic) photometry. The applications of such NIR-based samples of structures of galaxies are numerous (e.g. Mamon 1994) and include understanding the dynamics of these structures, their bias to projection effects, their constraints on and the primordial density fluctuation spectrum, their use as distance indicators, and the environmental influences on galaxies.
Large-scale structure of the Universe:
The NIR selection and the linear photometry will also benefit the measurement of statistics (two-point and higher-order angular correlation functions, counts in cells, topological genus, etc.) of the large-scale distribution of galaxies in the Universe. For example, the (3D) primordial density fluctuation spectrum of galaxy clustering can be obtained from the two-point angular correlation function (Baugh & Efstathiou 1993) or from the 2D power spectrum (Baugh & Efstathiou 1994). Moreover, by the end of DENIS and 2MASS, large-scale cosmological simulations with gas dynamics incorporated (thanks to which galaxies are properly identified) will provide adequate galaxy statistics in projection that will be compared with those obtained from the surveys, iterating over the cosmological input parameters of the simulations.
3 Galaxy extraction and current galaxy pipeline
The current galaxy pipeline consists of the following steps:
1) Bias subtraction, flat-fielding, bad pixel mapping and astrometric calibration (standard DENIS Paris Data Analysis Center pipeline, Borsenberger 1997); 2) Cosmic ray removal; 3) Extraction of photometric zero-points and airmasses from relevant files; 4) Galaxy extraction using the SExtractor (Bertin & Arnouts 1996) object extraction software, version 1.2b6a (which includes a neural-network star/galaxy separator, Bertin 1996, whose input parameters are 8 isophotal areas, the maximum intensity and as a control parameter, the FWHM of the PSF), with detection and Kron (1980) photometry parameters optimized from simulated images.
4 Star/galaxy separation
Nevertheless, star/galaxy separation is intrinsically difficult because, at the galaxy extraction limits (see below), DENIS will extract roughly 5.5 times as many stars as galaxies in , at very high galactic latitude (, see Lidman & Peterson 1996), and the ratio worsens considerably at lower galactic latitudes and at brighter magnitudes.
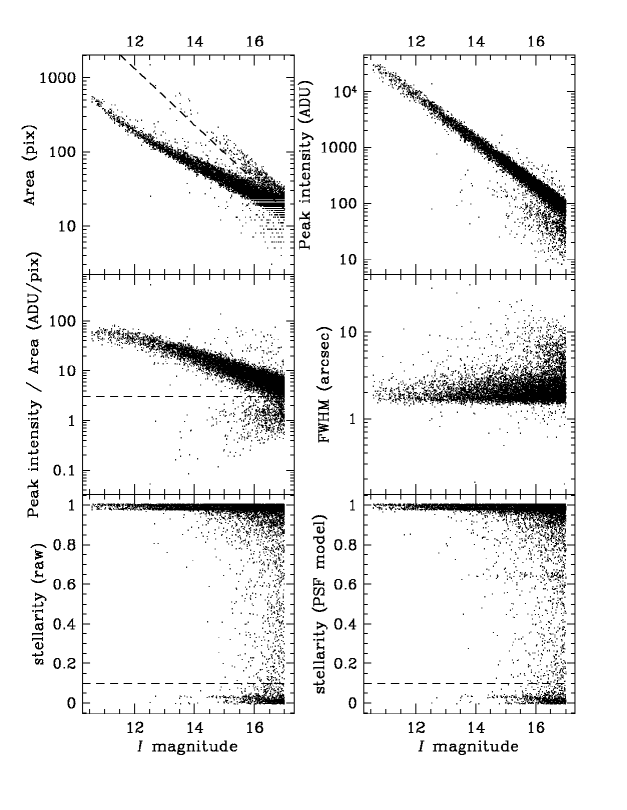
We discuss below the steps towards an efficient star/galaxy separation method. For this, we extracted in the band (which has the best angular resolution) classical star/galaxy separation diagnostics such as isophotal area, peak intensity, and FWHM, as well as the neural-network based stellarity parameter, in a direct fashion, or using a suitably modified version of SExtractor that includes a two-dimensional modeling of the PSF that is used as input to the neural network.
Figure 1 shows how these quantities vary with magnitude for all objects at least 20 pixels from the frame edges on a high latitude strip.
4.1 Tests of automatic star/galaxy separation
One of us (G.A.M.) has classified by eye a set of 329 galaxy candidates on 109 DENIS band images (of which 33 appeared on consecutive images, leaving 296 unique candidates). These candidates were chosen with , centers at least 20 pixels from the image borders. Furthermore, they met at least one of the following loose (to ensure completeness) galaxy criteria (dashed lines in Fig. 1):
-
Isophotal area: pixels
-
Pseudo surface brightness: ADU/pixels
-
Neural-network stellarity before PSF modeling:
-
Neural-network stellarity after PSF modeling:
We’ve used 5 sets of truth tables:
-
Visual DENIS (see above)
-
COSMOS
-
APM
-
APM
-
A mix of the previous 4
The COSMOS and APM lists were obtained through the World Wide Web (telnet://cataloguesapm3.ast.cam.ac.uk for the APM and
telnet://cosmoscosmos.aao.gov.au for COSMOS).
We’ve optimized each of the 6 algorithms plotted in Figure 1 for a linear star/galaxy separator in these plots (slope and normalization, except that we forced a zero slope for the two neural network algorithms). The results are showed in Figure 2, which plots the completeness-reliability plots for 4 of the 5 truth tables.

The different points in Figure 2 for a given algorithm correspond to different cuts through the algorithm versus magnitude diagram and we only plotted the optimal slope, varying the normalization.
Figure 2 shows that the pseudo-surface brightness criterion is slightly superior to the peak intensity, which, in turn, is slightly superior to the isophotal area (except for the COSMOS-based truth table, for which isophotal area does best). The other three algorithms (FWHM, and neural network stellarity before and after PSF modeling), are far inferior to the first three algorithms. For the visually classified DENIS sample, we achieve 92.5% reliability at 98% completeness, and for the global sample we obtain 96% reliability at 96% completeness. The poor results of the neural networks is probably due to the variations of the PSF across the frames, and for this particular DENIS strip (number 5570), PSF modeling worsened the results!
4.2 COSMOS and APM versus visual star/galaxy separation
Table 1 shows the comparison between the visual classification and the classification obtained from the COSMOS and APM lists.
| Visual DENIS | COSMOS | APM | ||||||
|---|---|---|---|---|---|---|---|---|
| Type | Total | Galaxy | Star | Notfound | Galaxy | Star | Faint | Notfound |
| Galaxy | 203 | 193 | 10 | 0 | 193 | 5 | 3 | 2 |
| Star | 53 | 6 | 46 | 1 | 9 | 42 | 1 | 1 |
| Star+Star | 8 | 4 | 3 | 1 | 4 | 3 | 0 | 1 |
| Faint | 21 | 7 | 11 | 3 | 10 | 10 | 0 | 1 |
| Junk | 11 | 0 | 2 | 9 | 2 | 3 | 3 | 3 |
| Total | 296 | 210 | 72 | 14 | 218 | 63 | 7 | 8 |
Of the 11 objects termed as junk, 3 were fragments of a bright galaxy, two were deemed optical flaws, but according to both APM and COSMOS, one of those was a star.
The numbers in Table 1 do not permit to establish which star/galaxy separation is best between visual DENIS, APM or COSMOS. However, if one assumes that visual DENIS star/galaxy separation is perfect, one would then conclude that APM and COSMOS both have a completeness of at (this also assumes that the DENIS extraction is 100% complete, which remains to be proven). The reliability of the extraction would then be for COSMOS and for APM.
If one assumes that APM or COSMOS are complete, than the incompleteness of the DENIS galaxy extraction can be estimated from the objects too faint for DENIS visual classification but called galaxies by the optical surveys. One obtains completeness levels of 95% or 97% at using APM or COSMOS, respectively. Of course, if the visual classification were imperfect and that objects classified as stars or double stars are in fact galaxies, the completeness of DENIS visual classification would decrease to levels of 90% or 92% using APM or COSMOS, respectively. Moreover, DENIS may not have detected objects at that are seen in the optical surveys, and this issue will be addressed in a forthcoming publication.
4.3 Quick and dirty automatic star/galaxy separation
Since the pseudo-surface brightness criterion seems to produce the best star/galaxy separation, we have adopted the following preliminary algorithm for each DENIS strip:
We adopt a constant critical pseudo surface brightness (independent of magnitude — the optimal slope with respect to the visual DENIS , COSMOS , APM , and global classifications was 0.05), by fitting with a cubic polynomial the histogram of the values of for , in a range chosen to exclude the peak due to the stars. Although curves down from the stellar locus have negative slope, the higher slope of the galaxy counts relative to the star counts leads us to believe that a given reliability will be achieved with a cut of that decreases with magnitude, i.e., with a lower slope for . This may explain why the optimal slope is non-negative.
For the and bands, we rely on the star/galaxy separation performed in the band. Because the band has better angular resolution and is more sensitive than or (except at very low galactic latitudes, corresponding to visual extinction , see Kraan-Korteweg et al., in these proceedings), using -band star/galaxy separation is superior to doing star/galaxy separation directly in or in .
Our star/galaxy separation, relying only on pseudo surface brightness is simpler than in our previous work (Mamon et al. 1997b), where we required out galaxies to satisfy both neural network stellarity (after PSF modeling) and isophotal area algorithms, and our former star/galaxy separation method had the disadvantage of using a fixed critical isophotal area line, whereas strip to strip variations of the PSF lead to variations of this critical line from one strip to another.
We have thus analyzed a little over of DENIS data, restricting ourselves here to .
5 Photometry
We estimate below the accuracy of DENIS galaxy photometry using objects within image overlaps and comparing with APM and COSMOS, and we use color-magnitude diagnostics as an additional test on the reliability of star/galaxy separation.
5.1 Photometric accuracy from overlaps
Figure 3 shows the magnitude differences on unflagged overlap objects extracted from 50 deg2 of high galactic latitude data.

Contrary to the analogous figure in Mamon et al. (1997b), we have high certainty on the extragalactic nature of the -band and -band overlap objects (since again, we rely on -band star/galaxy separation). For this reason, the photometric accuracy is worse than given in Mamon et al. (1997b): The rms error on a single measure is 0.05 at , 0.10 at , 0.10 at , and 0.20 at . There are too few overlaps to conclude strongly, but indications (based upon only 4 points!) are that the rms photometric accuracy for a single measure is roughly 0.20 at . The -band photometric accuracy was considerably better in our previous study (Mamon et al. 1997b), but unreliable direct (using neural network stellarity in lower than 0.2) star/galaxy separation had been used for the photometric accuracy study of that work, and the inclusion of stars tends to improve the photometric accuracy.
5.2 Comparison of DENIS galaxy photometry with COSMOS
For the region in which we visually classified our extracted objects, we plot in Figure 4 the color-magnitude relation obtained with COSMOS photometry, taken from the World Wide Web.

This figure shows the difficulties in star/galaxy separation, as a number of points lie far off the region. Part of this difficulty lies in poor star/galaxy separation from COSMOS. Moreover, there is a trend for bluer galaxy colors at brighter magnitudes, which we interpret as poor photometry on the COSMOS side, because of inaccurate compensation for plate saturation.
We also attempted the same with APM data from the World Wide Web, but that photometry suffers from unusually strong systematic errors at the bright end (up to 6 mag difference with COSMOS!), as the photometric calibration has been optimized for stars that saturate at these magnitudes (Maddox, private communication).
5.3 Colors of DENIS galaxies

Figure 5 shows the color-magnitude diagram for the galaxies. The bluest two points turn out to be galaxies! Visual inspection shows that they are low surface brightness galaxies that are barely visible in (and invisible in ). The use of adaptive aperture photometry to define colors makes such objects appear very blue. We checked that their central colors are normal.
Figure 5 shows that at the limit for mag photometric accuracy, the star/galaxy separation performed in should be roughly as reliable as at , and could be made even more reliable by culling out the reddest objects for which .
In Figure 6, we plot the color-color diagram for extracted galaxies.

The galaxy colors cluster around , , but there are indications for fairly bright objects with red colors, which upon visual inspection are confirmed as galaxies. An important fraction of the points off the central cluster lie near the frame edges where the PSF is larger. The large open circle refers to an object too faint in for reliable star/galaxy separation, and indeed, visual inspection shows it to be a star blended with a faint galaxy.
6 Galaxy counts
Figure 7 illustrates our galaxy counts.

The -band counts become incomplete at , in comparison to both published counts by Gardner et al. (1996) and to the expected Euclidean 0.6 slope (the completeness is still roughly 50% at ).
The band counts match well the published data, although Lidman and Peterson (1996) find fewer counts at the bright end, while Gardner et al. find more counts at the bright end (the two sets of published data differ by a factor of 3 at ). Note that DENIS, Gardner et al. and Lidman & Peterson all work with the Cousins band, so no conversion was made from another filter. Also, our survey has smaller error bars at the bright end as it covers 4 to 5 times the solid angle of the two cited surveys. Our bright-end -band counts are more consistent with the extrapolation of the faint counts with a Euclidean slope than either two sets of published data (our high value at is caused by important stellar contamination in the fainter half of the bin; also, at , the published counts become lower than the Euclidean line because of significant -correction at these magnitudes). In this sense, although not as high as Gardner et al.’s counts, the DENIS -band counts argue for a high bright-end normalization, consistent with little galaxy evolution at the bright end, in line with analogous findings by Bertin and Dennefeld (1997) using blue counts.
The counts are new (although they were already shown in Mamon et al. 1997b). They are highly complete to , follow very well the Euclidean slope of 0.6, and are well described by the relation .
7 Discussion
From the results of the preceding sections, we can establish limits for the homogeneous extraction of galaxies from DENIS, as given in Table 2.
| completeness () | 17.25 | 15.25 | 11 |
| star/galaxy separation (90% reliability, from ) | 16.5 | 14.8 | 13.5 |
| photometry (0.20 mag accuracy) | 18? | 14.8 | 12.2? |
| photometry (0.10 mag accuracy) | 17.4 | 13.7 | 11? |
The limiting factors turn out to be star/galaxy separation in , photometry and star/galaxy separation in , and detection in (assuming that -band star/galaxy separation is used to classify objects detected in the other bands).
Using the counts from Figure 7 to extrapolate to the entire survey area (roughly a hemisphere), we infer that our homogeneous catalogs will have sizes of at (0.2 mag photometry), to at and 14.8 (with 0.2 and 0.1 mag photometry, respectively), and galaxies at (0.1 mag photometry). The recent installation of an air conditioning system on the band optics has decreased the instrumental background by 0.7 magnitude, which should bring the extraction limit to , and thus increase the size of the homogeneous sample to roughly galaxies.
Moreover, there is still room for progress on star/galaxy separation. C. Alard has devised a new algorithm to accurately model the variations of the PSF across the frame, which need no longer be an elliptical gaussian (fitting the asymmetric coma of the images), and tests on visually classified data are about to be performed.
Acknowledgements
We thank Emmanuel Bertin for supplying recent updates of his SExtractor software package, Steve Maddox for useful comments on the APM data, Nicolas Epchtein for a careful reading of the manuscript, and Pascal Fouqué and the DENIS operations team.
References
- Baugh C.M. & Efstathiou G. (1993) MNRAS, Vol. no. 265, pp. 145–332
- Baugh C.M. & Efstathiou G. (1994) MNRAS, Vol. no. 267, pp. 323–332
- Bertin E. (1996) PhD thesis, University of Paris 6
- Bertin E. & Arnouts S. (1996) A&AS, Vol. no. 117, pp. 398–404
- Bertin E. & Dennefeld M. (1997) A&A, Vol. no. 317, pp. 43–53
- Borsenberger J. (1997) in The Impact of Large-Scale Near-IR Surveys, eds F. Garzón et al., Kluwer, pp. 181–186
- Burstein D. & Heiles C. (1982) AJ, Vol. no. 87, pp. 1165–1189
- Dalton G.B., Maddox S.J., Sutherland W.J. & Efstathiou G. (1997) MNRAS, Vol. no. 289, pp. 263–284
- Epchtein N. et al. (48 authors) (1997) ESO Messenger, Vol. no. 87, pp. 27–34
- Escalera E. & MacGillivray H.T. (1995) A&A, Vol. no. 298, pp. 1–21
- Escalera E. & MacGillivray H.T. (1996) A&AS, Vol. no. 117, pp. 519–555
- Gardner J.P., Sharples R.M., Carrasco B.E. & Frenk C.S. (1996) MNRAS, Vol. no. 282, pp. L1–L6
- Heydon-Dumbleton N.H., Collins C.A. & MacGillivray H.T. (1989) MNRAS, Vol. no. 238, pp. 379–406
- Kolatt T., Dekel A. & Lahav, O. (1995) MNRAS, Vol. no. 275, pp. 797–811
- Kraan-Korteweg R.C., Woudt P.A., Cayatte V., Fairall A.P., Balkowski C. & Henning P.A. (1995) Nature, Vol. no. 379, pp. 519–521
- Kron R.G. (1980) ApJS, Vol. no. 43, pp. 305–325
- Lidman C.E. & Peterson B.A. (1996) MNRAS, Vol. no. 279, pp. 1357–1379
- Lumsden S.L., Nichol R.C., Collins C.A. & Guzzo L. (1992) MNRAS, Vol. no. 258, pp. 1–22
- Maddox S.J., Sutherland W.J., Efstathiou G., Loveday J. & Peterson B.A. (1990) MNRAS, Vol. no. 247, pp. 1P–5P
- Mamon G.A. (1994) Astrophys. & Sp. Sci., Vol. no. 217, pp. 237–242
- Mamon G.A. (1996) in Dark Matter in Cosmology, Quantum Measurements, Experimental Gravitation, eds. R. Ansari, Y. Giraud-Héraud & J. Trân Thanh Vân, Frontières, pp. 225-232 (astro-ph/9608076)
- Mamon G.A., Banchet V., Tricottet M. & Katz D. (1997a) in The Impact of Large-Scale Near-IR Surveys eds. F. Garzón et al., Kluwer, pp. 239–248 (astro-ph/9608077)
- Mamon G.A., Tricottet, M., Bonin, W. & Banchet, V. (1997b) in Extragalactic Astronomy in the Infrared, eds. G.A. Mamon, T.X. Thuan & J. Trân Thanh Vân, Frontières, pp. 369–380 (astro-ph/9711281)
- Monet D. (1997) Bull. A.A.S., Vol. no. 188, 54.04
- Prandoni I., Iovino A. & MacGillivray H.T. (1994) AJ, Vol. no. 107, pp. 1235–1244
- Saunders W. et al. (15 authors) (1997), in Extragalactic Astronomy in the Infrared, eds. G.A. Mamon, T.X. Thuan & J. Trân Thanh Vân, Frontières, pp. 415–424
- Schröder A., Kraan-Korteweg R.C., Mamon G.A. & Ruphy S., (1997) in Extragalactic Astronomy in the Infrared, eds. G.A. Mamon, T.X. Thuan & J. Trân Thanh Vân, Frontières, pp. 381–386 (astro-ph/9706093)
- Vauglin I., Paturel G., Marthinet M.C., Petit C. & Borsenberger J. in Extragalactic Astronomy in the Infrared, eds. G.A. Mamon, T.X. Thuan & J. Trân Thanh Vân, Frontières, pp. 387–392