The Pulsar in GRO J174428
at Low Flux
Abstract
The Bursting Pulsar, GRO J174428, has been observed with the Rossi X-ray Timing Explorer (RXTE) regularly since the launch of the satellite in December 1995 giles . This accretion driven pulsar has undergone two outbursts which have been accompanied by significant spin-up of the pulsar. Between these two outbursts, the pulsar was detectable during each observation down to fluxes perhaps one thousandth of the persistent flux at the peak of the first outburst. We observe evidence of a change in the sign of the frequency derivative during the faintest period but the relationship between the observed luminosity and the frequency derivative is complex.
Introduction
The instruments aboard RXTE are well suited to the study of GRO J174428. The large area and high throughput of the RXTE Proportional Counter Array (PCA) have allowed the study of this source over a wide dynamic range in luminosity. The source has already been invoked as a test of the standard theory of accretion onto magnetized neutron stars ghoshlamb . Data from the Burst and Transient Source Experiment on the Compton Gamma Ray Observatory have shown that there is relatively good agreement between the theoretical dependence of the accretion torque on the source luminosity and observation when the source is bright finger1 ; finger2 . This theory also predicts that at sufficiently low source luminosity the accretion torque should become negative. It has been argued elsewhere cui that GRO J174428 has undergone the transition to negative accretion torque during the period studied here. This argument is based on observational parameters other than changes in the spin period, however. The magnetic field strength of the neutron star determines the theoretical form of the dependence of the accretion torque on the source luminosity. Knowing the luminosity at which the transition from positive to negative accretion torque occurs allows a determination of the magnetic field strength.
Analysis
We have searched for evidence of negative accretion torque in the pulsar signal from GRO J174428. In addition, we have determined the source’s luminosity and present here the magnetic field strength implied by the luminosity when the accretion torque changes sign.
Torque
Observations were made of GRO J174428 every one to two days during 1996. Sinusoidal 2.1 Hz pulsation was detectable during each of these observations. The period which best describes the pulsation in each observation was determined by epoch-folding and maximization. Accounting for the binary motion of the sourcefinger1 , an arrival time was also calculated for each observation. Since the pulsar light-curve is nearly sinusoidal, the arrival time of the pulsation is taken to be the zero time of the cosine function which best describes the folded data.
Combining the best-fit period and arrival times of consecutive observations, the number of pulses between successive observations can be counted unambiguously. The pulse numbers and arrival times can be fit to a quadratic expression where the coefficient of the quadratic term is , half the product of the initial period and period derivative of the pulsation. The data from all the observations can be fit to this expression at once under the assumption that is constant. Since we expect that is changing, we have fit the data in such a way that a relatively independent is found for each day. The arrival times for five consecutive observations were fit to determine for the middle observation. In this way, the for each observation is dependent only on nearby observations. The result of this analysis is shown in Figure 1.

Flux
The data taken on 26 June 1996 using the RXTE PCA are divisible into two categories: quiet stretches in which the flux was relatively constant and no pulsation is detected; and rumbly stretches in which the flux is highly variable and 2.1 Hz pulsation is detected. For this analysis, the quiet stretches are taken to be emission from background sources absent any emission from GRO J174428. The rumbly stretches are taken to be emission from both background sources and GRO J174428. Under these assumptions, source and background contamination can be unambiguously separated. The energy spectra of the separated components of these data are fit by typical power-law pulsar spectra with indices of and respectively.
Only the data on 26 June 1996 were unambiguously separable in this way so data on other days are separated into background and source components by assuming that the spectra of these two components are invariant. Each day’s data are then fit by a sum of the spectra described above where only the total flux from each component is allowed to vary. The results of applying this analysis are shown in Figure 2.
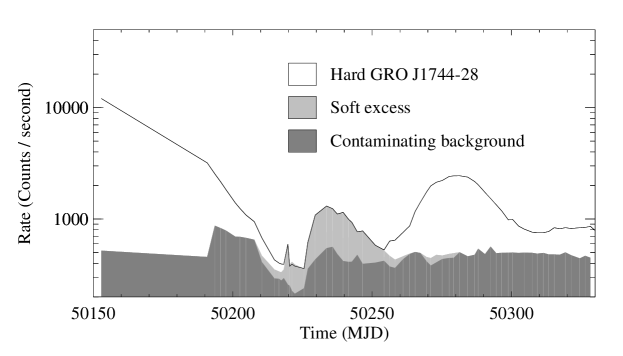
During outburst, this analysis suggests a background source which varies slowly, independent of the large changes in the flux from GRO J174428. During the quietest period, decomposing the data into two sources is confounded by additional soft emission from GRO J174428 which is incompatible with the assumption of spectral invariance. There is an increase in the amplitude of the 2.1 Hz pulsation which is correlated with the appearance of this soft emission which suggests that this emission is from GRO J174428 and, thus, that its spectrum varies. For this analysis, we have added an additional soft component to reflect the spectral change in the source emission. The detected counts from this component is shown in Figure 2 with the two components which describe the 26 June data.
Results
Figure 1 shows a period of spin-down between MJD 50217 and MJD 50236. Discounting MJD 50220 when the flux was high and the period derivative, , was negative for a single observation and confining analysis to the period when the detected flux was the lowest, the average for this period was . This corresponds to a frequency derivative of s-2.
Taking the average flux from GRO J174428 between MJD 50231 and MJD 50236 and a distance of 8 kpc, the 2–60 keV luminosity of the source is erg/s. We can derive the magnetic field implied by this luminosity by equating the radius of the orbit with a Keplerian frequency of 2.1 Hz to the radius of the magnetosphere given by Lamb et al. lamb . This yields the expression
where is the polar surface magnetic field. For typical neutron star mass and radius, the magnetic field implied by the luminosity we observe is Gauss. This value is consistent with upper-limits based on other observational considerations finger1 ; bildsten and lower than the value derived by Cuicui who assumed all counts above background to be from GRO J174428.
References
- (1) Giles, A. B., Swank, J. H., Jahoda, K., Zhang, W., Strohmayer, T., Stark, M. J., & Morgan, E. H. 1996, ApJ, 469, L25
- (2) Ghosh, P. & Lamb, F. K. 1979, ApJ, 234, 296
- (3) Finger, M. H., Koh, D. T., Nelson, R. W., Prince, T. A., Vaughan, B. A., & Wilson, R. B. 1996, Nature, 381, 291
- (4) Finger, M. H., Wilson, R. B., & Chakrabarty, D. 1996, A&AS, 120, C209
- (5) Cui, W. 1997, ApJ, 482, L163, astro-ph/9704084
- (6) Lamb, F. K., Pethick, C. J., & Pines, D. 1973, ApJ, 184, 271
- (7) Bildsten, L. & Brown, E. F. 1997, ApJ, 477, 897, astro-ph/9609155