Molecular Absorption Lines at High Redshift
Abstract
The four known molecular absorption line systems at redshifts z0.25–0.89 are discussed. Two of the systems originate in the galaxy hosting the ‘background’ AGN, while in two cases the absorption occurs in truely intervening galaxies. Indirect evidence for the existence of very small scale structure in the molecular ISM is presented. A new absorption line at z0.89 towards PKS1830–211 opens up interesting possibilities to accurately derive the mass of the lensing galaxy.
keywords:
Interstellar medium, molecular clouds, chemical abundances, gravitational lenses, cosmic background temperature1 Introduction
Galaxy evolution in general and star formation in particular are
directly associated with molecular gas. The study of this dense and cold
component of the interstellar medium (ISM) in distant galaxies
gives important information about the conditions for star formation at
different epochs during the evolution of the universe.
In this respect, molecular absorption and emission lines are
complementary to each other. Whereas emission lines give information
about global properties, such as the total gas content and rotational
velocity, the absorption lines probe the molecular ISM in greater detail,
with more sensitivity and on spatial scales limited only by the angular
extent of the background source.
In addition, emission and absorption lines probe different types of
molecular gas.
Emission.
The observed property for molecular emission is the
velocity integrated line intensity, which for a galaxy at redshift
z can be expressed as . The ratio of the solid angle of the source,
, and the telescope beam, , represents
the beam filling factor (valid as long as ).
is the intrinsic brightness
temperature, where the observed intensity is diminished by
and is the width of the profile.
For optically thick emission, the brightness temperature is
, where
.
and are the excitation temperature and the temperature
of the cosmic background radiation, respectively.
For somewhat higher than , the brightness
temperature is approximately proportional to , while it
vanishes when .
For a fixed–size galaxy, the observed integrated line intensity
, where is the luminosity
distance.
Absorption.
The observed property of a molecular absorption line is the
velocity integrated opacity. Assuming that the population of
rotational levels can be described by a single temperature , not necessarily equal to the kinetic temperature, the
integated opacity can be expressed as:
where is the total column density of the molecule in question and the permanent dipole moment. This expression is strictly speaking true only for linear molecules and transitions from the ground state for which , but is similar for more complex species and higher order transitions.
This different dependence on the excitation temperature for absorption and emission lines illustrates how absorption measurements are sensitive to excitationally cold gas, whereas emission lines probe the warm gas. Under normal circumstances the excitation of molecular rotational transitions is dominated by collisions. An excitationally cold gas therefore corresponds to a diffuse gas component and warm gas to dense gas. The inverse quadratic dependence on for absorption line observations can have profound influences on the estimates of total column densitites, which will be discussed below. Furthermore, the observed integrated opacity does not include a distance dependence for the absorption line measurements. Instead the sensitivity only depends on the strength of the background continuum source. This means that the same kind of data that can be obtained in the Milky Way (e.g. Lucas & Liszt 1994, 1996), in Cen A at a distance of 4 Mpc (e.g. Wiklind & Combes 1997a) can be obtained towards PKS1830–211 at a luminosity distance 4 Gpc (Wiklind & Combes 1996a, 1997c).
| \tablelineSource | za\tablenotemarka | ze\tablenotemarkb | A\tablenotemarkc | ||||
| cm-2 | cm-2 | cm-2 | |||||
| \tableline | |||||||
| Cen A | 0.00184 | 0.0018 | 50 | 0.5 | |||
| PKS1413+357 | 0.24671 | 0.247 | 2.0 | 2.8 | |||
| B3 1504+377A | 0.67335 | 0.673 | 5.0 | 2.0 | |||
| B3 1504+377B | 0.67150 | 0.673 | 2 | 1.4 | |||
| B 0218+357 | 0.68466 | 0.94 | 850 | ||||
| PKS1830–211A | 0.88582 | ? | 100 | ||||
| PKS1830–211B | 0.88489 | ? | \tablenotemarkd | 1.8 | 5.0 | ||
| PKS1830–211C | 0.19267 | ? | 0.2 | 2.5 | |||
| \tableline |
aRedshift of absorption line \tablenotetextbRedshift of background source \tablenotetextcExtinction corrected for redshift using a Galactic extinction law \tablenotetextdEstimated from the HCO+ column density of cm-2 \tablenotetexte21cm HI data taken from Carilli et al. 1992, 1993, 1997a,b. A spin–temperature of 100 K and a area covering factor of 1 was assumed
2 Known Molecular Absorption Line Systems
There are four known molecular absorption line systems at high redshift: z0.25–0.89. These are listed in Table 1 together with data for the low redshift absorption system seen toward the radio core of Cen A. For the high redshift ones, a total of 15 different molecules have been detected, in a total of 29 different transitions. This includes several isotopic species: C13O, C18O, H13CO, H13CN. As can be seen from Table 1, the inferred H2 column densities varies by . The isotopic species are only detectable towards the systems with the highest column densitites: B0218+357 and PKS1830–211. The large dispersion in column densities is reflected in the large spread in optical extinction as well as the atomic to molecular ratio. Systems with high extinction have 10–100 times higher molecular gas fraction than those of low extinction. However, as discussed by Combes & Wiklind (these proceedings), the relation between HI and molecular gas along sightlines to background QSOs can be ambiguous.
2.0.1 Absorption in the host galaxy.
Two of the four known molecular absorption line systems are situated within the host galaxy to the ‘background’ continuum source: PKS1413+135 and B3 1504+377. The latter exhibits two absorption line systems with similar redshifts, z0.67150 and 0.67335 (Wiklind & Combes 1996b). The separation in restframe velocity is 330 km s-1. This is the type of signature one would expect from absorption occuring in a galaxy acting as a gravitational lens. However, in this case, as well as for PKS1413+135, high angular resolution VLBI images show no image multiplicity, despite impact parameters less than 0.1” (e.g. Perlman et al. 1996; Xu et al. 1995). The continuum source must therefore be situated within or near the obscuring galaxy. The small impact parameters make the latter situation highly unlikely.
2.0.2 Absorption in gravitational lenses.
The two absorption line systems with the highest column densities occur in galaxies which are truely intervening and each acts as a gravitational lens to the background source: B0218+357 and PKS1830–211. In these two systems we have detected several isotopic species, showing that the main lines (at least) are saturated. Nevertheless, the absorption lines do not reach the zero level, indicating that only part of the continuum source is covered by obscuring molecular gas, but that this gas is optically thick (e.g. Combes & Wiklind 1995, Wiklind & Combes 1996a, 1997c). The lensed images of B0218+357 and PKS1830–211 consist of two main components. By comparing the depths of the saturated lines with fluxes of the individual lensed components, as derived from long radio wavelength interferometer observations, we identified the obscuration to only one of two main lensed components (Wiklind & Combes 1995; 1996a). This has subsequently been verified through mm–wave interferometer data (Menten & Reid 1996; Wiklind & Combes 1997c; Frye et al. 1997).
3 Small scale structure
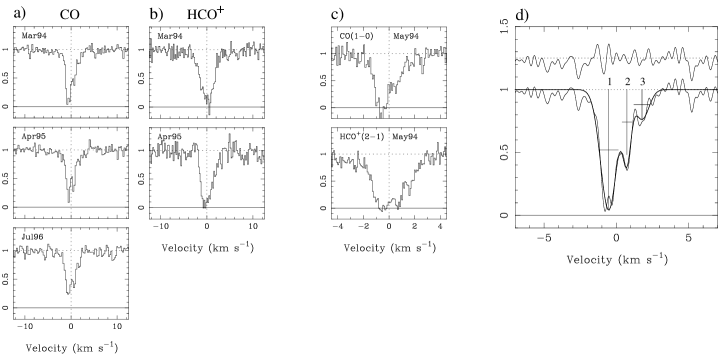
The angular resolution of the molecular absorption line observations is set by the small, but finite, extent of the background continuum source. The size of this region decreases with increasing frequency and is located closer to the central engine than emission at lower frequencies. VLBI observations at mm–wavelengths of the flat–spectrum radio source 3C446 indicates a size 30 arcseconds (Lerner et al. 1993), corresponding to less than 0.15 pc. The width of the absorption lines varies from less than 1 km s-1 (PKS1413+135) to 30 km s-1 (PKS1830–211). The absorption profiles are likely to consist of a superposition of several components (cf. Fig. 1a). The widths implies that each sight line samples molecular gas on parsec scales. The observed absorption line is therefore an average over 0.1 pc in extent and 1 pc in depth. If the molecular gas is structured (density and/or temperature) on these scales, it can lead to observable changes in the absorption profiles on relatively short time scales.
3.0.1 PKS1413+134:
Variations have been seen in the CO(1–0) absorption line towards PKS1413+135 on a time scale of a few months (Wiklind & Combes 1997b). In Fig. 2 we show the CO(1–0) and HCO+(2–1) profiles from several epochs. Whereas the HCO+ profiles remain constant to within the noise, the CO profiles exhibit changes in the depth with time. A close look reveals that it is only one of three components in the absorption profile that shows significant changes. By fitting three Gauss components to the profiles (see Fig. 2d), we found that the ratio of the integrated opacities of component 1 and 2 has changed by a factor between May 1994 and July 1996, in the sense that component 1 had a higher opacity relative to component 2 in May 1994. The continuum flux of PKS1413+135 decreased by a factor of 3 between May 1994 and July 1996. This apparent correlation between variations and the continuum flux suggests that the variations in opacity are likely to be associated with structural changes in the AGN during an outburst. The scale of such a structural change is unknown, but likely to be very small.
There are additional features in PKS1413+135 which suggest the presence of small scale density structures in the molecular ISM. The total column density observed towards PKS1413+135 is cm-2, corresponding to an extinction mag111Corrected for the redshift to correspond to using a Galactic extinction law.. This is 25 times lower than the column inferred from the deficiency of low energy X–ray photons, which implies mag (Stocke et al. 1992). Could this discrepancy be caused by an underestimate of the column density derived from the absorption lines?
When deriving the column density it is necessary to estimate the rotation temperature, i.e. the temperature governing the level population of a molecule. If it is possible to observe two transitions of the same molecule, which is usually the case, the ratio of the integrated opacities allows a derivation of the excitation temperature for these two levels. With the assumption of LTE conditions this temperature is equal to the rotation temperature. If an additional transition of the same molecule can be observed, the set of two opacity ratios should give the same excitation temperature. Towards PKS1413+135 we have observed the J1–0, 2–1 and 3–2 transitions of HCO+. Whereas the J2–1/1–0 ratio gives K, the J2–1/3–2 ratio gives K Although this discrepancy suggests that the assumption of LTE conditions does not hold, it is also compatible with LTE conditions and a multi–component gas along the line of sight, where the different components are characterized by different excitation temperatures (Wiklind & Combes 1997c). For instance, expressing the observed opacity as the sum of two components, characterized by two excitation temperatures :
where is the total column density along the line of sight, is a function of the excitation temperature (e.g. Wiklind & Combes 1997b) and is the fraction of ‘cold’ gas (i.e. ), a solution for the discrepant of HCO+ in PKS1413+135 is compatible with two gas components characterisized by K and K, where 20% of the total column density originates in the cold component and the remaining 80% in the warm component. The total column density can be 10 times higher than the one estimated assuming a one component gas, making it more compatible with the column estimated from the deficiency of soft X–ray photons. Since the excitation of molecular gas is dominated by collisions between the molecule in question and H2, a low excitation temperature corresponds to diffuse gas, while a high excitation temperature corresponds to dense gas. This means that a two component gas as described above corresponds to a gas consisting of a dense and a diffuse part, implying structures with a large density contrast on the scales probed by the line of sight, i.e. of the order pc3.
3.0.2 B0218+357
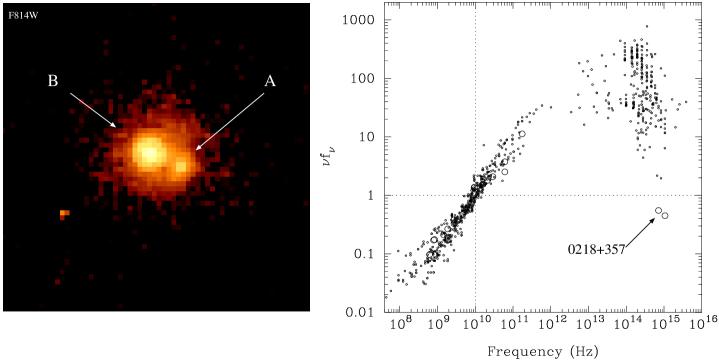
The molecular gas seen towards B0218+357 covers only one of the two lensed images of the background source (Wiklind & Combes 1995; Menten & Reid 1996). Saturated lines of both 13CO and C18O have been detected, while the C17O transition remains undetected (Combes & Wiklind 1995). This gives a lower limit to the CO column density which transforms to cm-2 and an mag. The absorption occurs in front of the A–component, which is then expected to be completely invisible at optical wavelengths. Nevertheless, analysis of archival HST data obtained with the WFPC2 in broad V– and I–band, show both components (Fig 2a). While the intensity ratio A/B of the two lensed images is 3.6 at radio wavelengths (c.f. Patnaik et al. 1996), A/B0.15 at optical wavelengths. The VI values show no difference in reddening for the A– and B–component. Hence, there are no indications of excess extinction in front of the A–component. The B–component is situated close to the center of the lensing galaxy and the optical flux from B–component is the sum of the lensed image and the nucleus of the lensing galaxy. Is the A–component an unobscured view of the background QSO, with the molecular absorption occuring elsewhere? To answer this question we compared the optical flux of the A–component (multiplied by a factor 1.3 to compensate for the B–component using the magnification ratio of 3.6) with that of similar flat–spectrum radio sources. Fluxes where taken from the literature, corrected for the redshift of the source and then normalized at the restframe frequency of 10 GHz. In Fig. 2b we plot the observed luminosities (normalized units). Despite a very large dispersion of optical luminosities for the flat–spectrum sources, the optical luminosity of B0218+357, as derived from the measured flux of the A–component, is clearly sub–luminous. This implies that, unless B0218+357 is a very peculiar source, a significant part of the optical emission region in component A is totally obscured, with being very high, while a small part of it remains unobscured. Since the extent of the optical emission region is very small, this suggests the presence of very small scale structure with large density contrasts in the molecular ISM of the lensing galaxy.
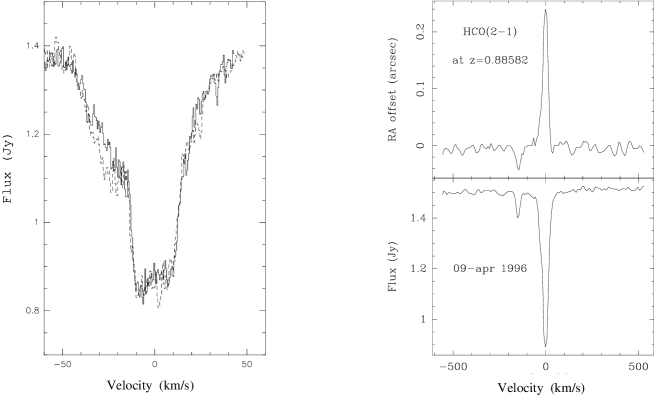
4 The complex absorption line system towards PKS1830–211
The radio loud QSO PKS1830–211 is lensed by an intervening galaxy and consists of two main images, designated the NE and SW images. The lensing galaxy was detected through absorption of molecular rotational lines, at a redshift z0.88582 (Wiklind & Combes 1996a). The absorption only occurs in front of the SW component. This was inferred from the depth of saturated lines and has been confirmed through mm–wave interferometric observations (Wiklind & Combes 1997c; Frye et al. 1997). A second absorbing system (designated as C in Table 1) has been identified as a 21cm HI absorption occuring at z0.19 (Lovell et al. 1996). This latter system is not seen in either molecular absorption nor emission (Wiklind & Combes 1997c). This HI absorption only occurs in front of the NE component.
A second molecular absorption system has been detected at z0.88489 (Wiklind & Combes 1997c). The new absorption line is separated by 147 km s-1 from the previously detected absorption (Fig. 1b) and occurs towards the NE component, in contrast to the main line which obscures the SW component. This is clearly seen in Fig. 1b, which shows the HCO+(2–1) absorption observed with the IRAM Plateau de Bure interferometer. The spectrum is centered on the main line. The top panel shows the shift of the phase–center along the –coordinate as a function of velocity. At velocities where the continuum of the SW component is obscured by the main HCO+ absorption, the phase–center shifts towards the NE component (positive ), while the opposite is true for velocities corresponding to the weaker absorption. Hence, the HCO+ absorption probes two sight lines through the intervening galaxy. Since the center of the lensing potential must be situated between the two lensed images, the velocity separation of the two absorption lines measures the rotational velocity of the gas. In order to interpret the observed velocity separation in terms of rotation, it is necessary to know where in the galaxy the sight lines occur. This can be done using existing lens models (cf. Wiklind & Combes 1997c), or through direct imaging of the lensing galaxy (see Frye, these proceedings). The second absorption system at z0.885 has also been seen in the line of HCN(1–0) and in 21cm HI absorption (Carilli et al. 1997b). The atomic fraction is higher in the NE component (weaker molecular absorption) than in the SW component, in line with the apparent correlation previously mentioned between the atomic and molecular fraction and total extinction (See Table 1).
References
- [1] arilli, C.L., Perlman E.S., Stocke J.T. 1992, ApJ 400, L13
- [2] arilli, C.L., Rupen, M.P., Yanny, B. 1993, ApJ 412, L59
- [3] arilli, C.L., Menten, K.M., Reid, M.J., Rupen M.P.: 1997a, ApJ 474, L89
- [4] arilli, C.L., Menten, K.M., Reid, M.J., Rupen, M.P., Claussen, M. 1997b, 13th IAP Colloqium: Structure and Evolution of the IGM from QSO Absorption Line Systems, eds. P. Petitjean, S. Charlot
- [5] ombes, F., Wiklind T. 1995, A&A 303, L61
- [6] ombes F., Wiklind T., 1996, in Cold Gas at High Redshift, eds. M.N. Bremer, P. van der Werf, H.J.A. Röttgering, C.L. Carilli, Kluwer Academic Pub., p. 215
- [7] ombes, F., Wiklind T. 1997, ApJ 486, L59
- [8] rye B., Welch W. J., Broadhurst T. 1997, ApJ 478, L25
- [9] erner M., Båth L., Inoue M. et al. 1993, A&A 280, 117
- [10] ovell, J.E.J., Reynolds, J.E., Jauncey D.L., et al. 1996, ApJ 472, L5
- [11] ucas R., Liszt H.S.: 1994, A&A 282, L5
- [12] ucas R., Liszt H.S.: 1996, A&A 307, 237
- [13] enten K.M., Reid M.J.: 1996, ApJ 465, L99
- [14] erlman E.S., Carilli C.L., Stocke J.T., Conway, J.S. 1996, AJ 111, 1839
- [15] iklind, T., Combes, F. 1994, A&A 286, L9
- [16] iklind, T., Combes, F. 1995, A&A 299, 382
- [17] iklind, T., Combes, F. 1996a, Nature, 379, 139
- [18] iklind, T., Combes, F. 1996b, A&A 315, 86
- [19] iklind, T., Combes, F. 1997a, A&A 324, 51
- [20] iklind, T., Combes, F. 1997b, A&A 328, 48
- [21] iklind, T., Combes, F. 1997c, ApJ in press (astro–ph/9709141)
- [22] u W., Readhead A.C.S., Pearson T.J., Polatidis A.G., Wilkinson P.N. 1995, ApJS 99, 297