13.18.1, 11.10.1, 11.17.3, 11.17.4 Cygnus A, 11.17.4 3C 309.1, 11.17.4 3C 345
A.P. Lobanov
Ultracompact jets in AGN
Abstract
We study the properties of ultracompact jets in several prominent radio sources (Cygnus A, 3C 309.1, 3C 345, 3C 395, 4C 39.25, and 1038+528 A), using the frequency dependence of observed position of the optically thick jet core. Frequency dependent offsets of the core positions are used for calculating the luminosities, magnetic fields, and geometrical properties of the jets. Opacity effects are studied, for both synchrotron self–absorption and external free–free absorption. Pressure and density gradients in the jets and in surrounding ambient medium are shown to be a primary factor determining the observed properties of ultracompact jets. We discuss possible applications of opacity effects to studying the conditions existing in central regions of active galactic nuclei.
keywords:
galaxies: jets – quasars: general – quasars: individual: Cygnus A, 3C 309.1, 3C 3451 Introduction
Extragalactic jets are believed to be formed in the vicinity of an accretion disk around a supermassive black hole in the center of active galactic nuclei (AGN). Pressure and density gradients, as well as a toroidally shaped magnetic field produced by the rotation of the disk, may collimate the outflowing material into two bipolar streams, and accelerate it up to relativistic speeds (see reviews by Begelman, Blandford, & Rees, 1984; Begelman 1995). Physical conditions in the immediate proximity of an accretion disk determine many aspects of jet evolution at larger spatial scales. The extent of this ultracompact fraction of the jet is estimated to be pc. Roland et al. (1994) model it as a turbulent region of pc in size. Marscher & Gear (1985) estimate the projected size of ultracompact jet to be pc, based on VLBI observations of a radio flare in 3C 273. Königl (1981) and Zensus, Cohen, & Unwin (1995) regard an unresolved core as an ultracompact jet.
In images obtained with Very Long Baseline Interferometry (VLBI), the core is usually identified with the most compact (often unresolved) feature exhibiting a substantial flux and flat spectrum across the radio band. At any given frequency, the core is believed to be located in the region of the jet where the optical depth is . The core absolute position, , should therefore depend on the observing frequency, . Königl (1981) gives . The power index depends on the shape of electron energy spectrum and on the magnetic field and particle density distributions in the ultracompact jet. Observed offsets of the core position at different frequencies have been reported for several sources including 1038+528 A (Marcaide Shapiro 1984), 4C 39.25 (Guirado et al. 1995), 3C 395 (Lara et al. 1996), and 3C 309.1 (Aaron 1996). Several studies of the core position offset have been undertaken for 3C 345 (Biretta, Moore, & Cohen. 1986; Unwin et al. 1994; Zensus et al. 1995).
In this paper, we discuss synchrotron self–absorption and free–free absorption in the nuclear regions of AGN. We use the frequency dependence of the VLBI core position as a tool for determining the physical conditions of ultracompact jets. In section 2, we describe a model adopted for ultracompact jets, and outline the relations between core shift and physical properties of the jets. Measurements of the shift of VLBI core in radio sources are discussed in section 3. In section 4, the measured core offsets are applied to deriving the magnetic field distribution and physical conditions in the central regions of Cygnus A, 3C 309.1, 3C 345, 3C 395, 4C 39.25, and 1038+528 A.
Throughout the paper, we use a Hubble constant km s-1 Mpc-1 and deceleration parameter . Unless defined otherwise, all quantities are in the cgs units, except for distances which are given in parsecs.
2 Ultracompact jets
A region of significant particle acceleration is assumed to exist at the very center of an AGN. The accelerated particles are confined by an ambient plasma with steep pressure and density gradients along the rotational axis of the central engine. A highly collimated relativistic outflow (jet) can be formed in result. The jet can contain both protons and electron–positron pairs (Sol et al. 1989). Interactions between the jet and the ambient medium are usually ignored, and the jet itself is assumed to have no transverse velocity gradient. The jet hydrodynamics is then given by a stationary adiabatic flow satisfying Bernoulli’s equation [(Daly & Marscher 1988)]. A nozzle is formed at a distance where the pressure drops below 4/9 of its initial value, and the flow becomes supersonic, with bulk Lorentz factor . Beyond the nozzle, the flow is accelerated by the conversion of internal relativistic particle energy to bulk kinetic energy , so that (const). The resulting particle energy distribution can be approximated by a power law: for , where is the particle energy spectral index. The jet radiation is then described by the inhomogeneous synchrotron spectrum with spectral index . Unless otherwise specified, the jet bulk Lorentz factor , and viewing angle are assumed constant. The jet geometry can be approximated by a conical or paraboloidal expansion, with the transverse radius (), for , where can be taken –, for most of parsec-scale jets. The jet opening angle is constant for . The magnetic field and particle density decrease with , and can be approximated as: and , where , are the magnetic field and the electron density at pc. Königl (1981) shows that the combination , can be used to describe the observed X-ray and synchrotron emission from the most compact regions of VLBI jets.
2.1 VLBI core and ultracompact jet
In the scheme described above, the protons become subrelativistic in the rest frame of the flow outside a characteristic radius , and the bulk Lorentz factor freezes at the value . This location in the jet is most likely to be observed as the VLBI core [(Marscher 1995)]. It is also referred to as the “injection point” (at which the relativistic plasma is assumed to be injected into the jet at ) in most of the models dealing with parsec-scale relativistic jets.
At any given frequency, the VLBI core is observed at the location where the optical depth of synchrotron self–absorption is . For given and , the corresponding is (e.g. Rybicki & Lightman 1979):
| (1) |
Here is the electron mass and . The observed jet opening angle . is described in Blumenthal & Gould (1970), and . Setting to unity gives for the distance from the central engine to the core observed at frequency
| (2) |
with
| (3) |
From (1), and . For the equipartition value of , the choice of , appears to be the most reasonable. The corresponding in this case does not depend on spectral index, and both and decline (taking , for instance, would result in , which is unrealistic: would then remain nearly constant, or even grow, with increasing ).
If the apparent core positions measured at two frequencies differ by , one can introduce a measure of core position offset
| (4) |
where is the luminosity distance to the source, and frequencies are given in Hz. can be used for assessing the quality of core position measurements. For ideal measurements, , for all frequency pairs. A dispersion in the values of derived from different frequency pairs reflects the inaccuracy of core position data. If has been determined inaccurately, or if it varies along the jet, then will exhibit a systematic trend. The variations of can occur when the jet crosses a region with rapidly changing absorption properties (e.g. the broad line region). In this case, can be used to estimate the change of . If two values (measured between frequencies and ) and (between and ) are different, the relation between the corresponding ’s is:
| (5) |
With a measured , equation (2) can be applied to determine the magnetic field in the jet at pc
| (6) |
and the absolute distance of the core from the central engine:
| (7) |
Formally, refers to the distance between the core and the sonic point, . However, since , in most cases, can be taken as a fair approximation for the distance to central engine. It should also be stressed that in (7) depends only on measured quantities ( and ) and on the jet viewing angle that can be determined from observations. Therefore can be used as a reliable estimate of core position, or at least of the projected distance from the central engine (if is poorly known). From (6) and (7), the magnetic field in the VLBI core observed at frequency is given by
| (8) |
where . For a typical , we have .
2.2 Equipartition regime
We now consider the equipartition between jet particle and magnetic field energy densities, with the magnetic field energy density given by [(Blandford & Königl 1979)], where , . In this case, (with , ), and the core position offsets can also be used to determine the total (kinetic + magnetic field) power of the jet
| (9) |
where . The can be further used to derive the magnetic field at 1 pc
| (10) |
The magnetic field in the core can be obtained, similarly to derived in (8). The equipartition can also be used for predicting the core offset in a source with known synchrotron luminosity . In this case, the expected shift of the core position between two frequencies and is
| (11) |
with , and assuming . Table 1 contains first order predictions of the core shift between 5 and 22 GHz, for several prominent radio sources.
| Name | Type | ||
|---|---|---|---|
| [mas] | [erg s-1] | ||
| 3C 273 | LPQ | 0.78 | |
| 3C 216 | HPQ | 0.70 | |
| 3C 120 | LPQ | 0.61 | |
| 4C 39.25 | LPQ | 0.57 | |
| 3C 345 | HPQ | 0.37 | |
| 1807+698 | BL | 0.26 | |
| BL Lac | BL | 0.11 |
The synchrotron luminosities in Table 1 are calculated from a database compiled by Ghisellini et al. (1992), using the model of Blandford & Königl (1979) with , . The jet opening angle was used for all sources. The synchrotron self–Compton Doppler factors from the database are used for estimating the jet viewing angles and Lorentz factors, assuming the minimum jet kinetic power condition . This gives lower limits for synchrotron luminosities, and upper limits for the shifts. One can see, from Table 1, that the core shifts may be noticeably large, and can be measured from VLBI data.
2.3 External pressure gradients
In the vicinity of an accretion disk, physical conditions in the jet become sensitive to the gradients of the pressure of the ambient medium. Since , to satisfy Bernoulli’s equation, the jet Lorentz factor and opening angle vary. Consequently, the corresponding gradients in and should also change along the jet in this region [(Georganopoulos & Marscher 1996)]. The dependences of magnetic field and particle density distributions on pressure gradients are shown in Fig. 1. If and spectral index are measured, one can find, from Fig. 1, the particle density and magnetic field distribution satisfying the conditions of stationary adiabatic flow. The magnetic field at is , . The particle density distribution can be approximated by .


If the jet is confined by gaseous clouds supported by thermal pressure from the central source and the stellar population with star density , the ambient medium density can be modelled by an exponential decrease , with the characteristic size of the cloud system [(Blandford & Rees 1974)]. Here is the protom mass, and is the ambient plasma temperature. Such a distribution reflects the likely conditions in the broad line region (BLR) surrounding the nucleus of an AGN. The jet properties in this case are shown in Fig. 2, for , , and . The parameters are chosen so as to approach the equipartition at . The jet opacity to synchrotron self–absorption increases significantly in the region of steepest pressure gradients. This implies that confinement effects may influence the observed frequency dependence of the VLBI core position in some radio sources. If and are known, the core position measurements can be used for estimating the size of nuclear cloud system.
2.4 Free–free absorption
Foreground free–free absorption in a hydrogen plasma is expected to affect the VLBI–scale radio emission propagating through a dense nuclear environment. The existence of absorbing, circumnuclear plasma has been suggested in 3C 84 (Vermeulen et al. 1994; Walker et al. 1994), Cen A (Jones et al. 1996), and Cyg A (Krichbaum et al. 1997). In all three sources, only the counter–jet emission is believed to be absorbed. One can also expect to find absorption in the jet–side emission, if the jet viewing angle is relatively large, and the absorbing medium extends sufficiently high above the accretion disk plane. One possibility would be the broad line region formed by hydrogen plasma clouds entrained from the disk [(Cassidy & Raine 1993)]. The optical depth of free–free absorption is given by (e.g. Levinson et al. 1995)
| (12) |
where is the size of absorbing region. Assuming a pure hydrogen plasma with uniform density, we can take . The hydrogenic free–free Gaunt factor, , can be evaluated numerically (Hummer 1988). An analytical long–wave approximation of given by Scheuer (1960) can also be used.
The typical sizes of BLR inferred from reverberation mapping and modelling the optical broad line emission of AGN vary between 0.01 and 1 pc (e.g. Kaspi et al. 1996; Baldwin et al. 1996). The corresponding densities of hydrogen plasma are cm-3. The disk–wind model [(Cassidy & Raine 1993)] predicts the BLR sizes of up to pc, with between and cm-3. There is evidence that weaker emission lines may originate from a very extended ( pc) thermal component with densities cm-3 and electron temperatures K [(Ferguson et al. 1997)]. Most of these plasmas can alter significantly the GHz–range emission from VLBI jets (for instance, at 10 GHz, for cm-3, K, ). Udomprasert et al. (1997) report very high rotation measures, rad m-2 in the VLBI core of the quasar OQ 172, which further supports the presence of high–density thermal medium around the ultracompact jets.
For a spherical distribution of BLR clouds, we can take ( is the volume filling factor of the cloud distribution). Then, from (12), . A crude estimate can be adopted (remembering that refers essentially to plasma density variations along the jet axis). Then , and the corresponding core shift is roughly 10 times smaller than that due to synchrotron self–absorption at typical VLBI observing frequencies.
3 Measuring the core position offsets
High-precision measurements of radio source absolute positions which are required for alignment of VLBI images at different frequencies are not readily available in most cases. Extensive absolute astrometry (see Fomalont 1995) observations are necessary, in order to establish a reliable link between VLBI data at different frequencies. In quasi–simultaneous multifrequency observations, the phase–referencing technique [(Beasley & Conway 1995)] can be sufficient for the purpose of image alignment. If neither of the abovementioned techniques is available, the frequency dependent shift of the core position can be deduced from comparison of observations made at close epochs, assuming that the moving features observed in parsec–scale jets are optically thin and therefore should have their positions unchanged. In this case, the offsets between the component locations measured at different frequencies will reflect the frequency dependent shift of the position of the source core.
3.1 Core shift in 3C 345
An extensive long–term VLBI monitoring database is available for 3C 345 (Zensus et al. 1995, 1997; Lobanov 1996). In the data for 3C 345, there are three close pairs of VLBI observations: (1989.24 at 22.2 GHz)–(1989.26 at 10.6 GHz), (1992.44 at 22.2 GHz)–(1992.45 at 5 GHz), (1993.69 at 5 GHz)–(1993.72 at 22.2 GHz). In these pairs, the separations between the observations in these pairs do not exceed 10 days. We also use two other close pairs with separations of 51 days: (1992.71 at 8.4 GHz)–(1992.86 at 22.2 GHz), and 70 days: (1993.69 at 5 GHz)–(1993.88 at 8.4 GHz). We measure the offsets in the closest and brightest components which have most reliably measured positions. For the pairs with 51 and 70 days separation, the positions of jet components have been corrected for the proper motions measured from the polynomial fits to the components trajectories (Lobanov 1996).
| 1 | 2 | 3 | 4 | 5 |
|---|---|---|---|---|
| Frequency pair | ||||
| [mas] | [deg] | [pc] | ||
| 5.0– 8.4 GHz | 5% | 0.1 | ||
| 10.6–22.2 GHz | 20% | 0.6 | ||
| 8.4–22.2 GHz | 20% | 0.8 | ||
| 5.0–22.2 GHz | 28% | 1.2 |
Notes: 2 – offset radius in mas; 3 – corresponding fraction of restoring beam; 4 – position angle of the offset direction; 5 – projected linear distance corresponding to the offset.
The average angular offsets are compared in Table 2 with the restoring beam sizes of spectral index maps made from the corresponding frequency pairs. The direction of the core shift () is similar to the position angle of the innermost part of the jet observed at 43 GHz (Krichbaum & Witzel 1992). Between 5 and 8.4 GHz, the position shift cannot be measured reliably because of the insufficient resolution and errors due to the proper motion corrections. The measured shift constitutes only about 5% of the restoring beam. With increasing frequency separation, the position shift becomes a prominent fraction of beamsize (up to 27% for spectral index maps between 5 and 22.2 GHz). Fig. 3 shows the measured offsets with respect to the reference frequency (22.2 GHz). The 5–8.4 GHz measurements are not included. The dashed line in Fig. 3 represents the best fit: .

| A. Model parameters | |||||||
| Name | Refs. | ||||||
| [deg] | [deg] | [cm-3] | |||||
| Cyg A | 0.0562 | 5.0 | 80.0 | 7.0 | 0.5 | 8000 | 1,2 |
| 3C309.1 | 0.905 | 5.0 | 20.0 | 2.0 | 17000† | 3 | |
| 3C345 | 0.594 | 5.6 | 7.6 | 2.4 | 0.6 | 1300† | 4,5 |
| 3C395 | 0.635 | 7.1 | 8.7 | 0.5 | 1800† | 6 | |
| 4C39.25 | 0.699 | 11.0 | 30.0 | 4.0 | 1000† | 7 | |
| 1038+528A | 0.678 | 4.0 | 20.0 | 5.0 | 1900† | 8 | |
References: 1 – Krichbaum et al. 1997; 2 – Carilli & Barthel 1996; 3 – Kus 1993; 4 – Zensus et al. 1997; 5 – Lobanov 1996; 6 – Lara et al. 1994; 7 – Alberdi et al. 1993; 8 – Marcaide et al. 1994.
| B. Measured and derived parameters§ | ||||||||
| Name | ||||||||
| [GHz] | [pc GHz-1] | [G] | [G] | [pc] | [1046 erg s-1] | [1046 erg s-1] | [1011K] | |
| Cyg A | 22/43 | |||||||
| 3C309.1 | 1.5/2.3 | |||||||
| 1.6/2.3 | ||||||||
| 2.3/5.0 | ||||||||
| 5.0/8.4 | ||||||||
| 8.4/15.1 | ||||||||
| 3C345 | 10.6/22.2 | |||||||
| 8.4/22.2 | ||||||||
| 5.0/22.2 | ||||||||
| 3C395 | 2.3/8.4 | 22.2 | ||||||
| 4C39.25 | 2.3/8.4 | 2.4 | ||||||
| 1038+528A | 2.3/8.4 | 7.4 | ||||||
| 8.4/15.1 | ||||||||
Notes: § – only the errors due to uncertainties of the core offset measurements are considered; – derived by equating to its equipartition value; – and are given for GHz.
3.2 Effect of the reference point offset on spectral imaging
Whenever an offset constitutes a significant fraction of restoring beam, it can influence substantially the derived spectral properties. An example of this effect is shown in Fig. 4.

The 5–22 GHz spectral index profiles shown in Fig. 4 are measured along the jet ridge line in the nuclear region of 3C 345. The core extends from to mas. The profile obtained by aligning the images on their respective core positions shows a strong gradient, with optically thin spectral index across a significant fraction of the core. Applying the measured core position offset between 5 and 22.2 GHz levels the spectral index across the entire core, with . Similar corrections applied to several other spectral index maps of 3C 345 have resulted in decreased peak values, and smoother spectral index distributions across the nuclear region.
4 Properties of ultracompact jets
To illustrate the implications of frequency dependence of VLBI core position, we calculate physical properties of ultracompact jets in 3C 345 and 5 other AGN with reported core position offsets. Table 3 summarizes the model parameters (panel A), and gives the measured and derived quantities (panel B). For all sources, we assume , , and use crude estimates , and (since only the logarithms of these ratios affect the calculated luminosities). The value of is determined in most cases, by setting to its equipartition value given by (10). Synchrotron luminosity, , and maximum brightness temperature, , are calculated using the model of Blandford and Königl (1979). For the purpose of comparison between different sources, the offset measures, are given, rather than the angular offsets cited in the original publications.
4.1 Cygnus A
We adopt the component identification made by Krichbaum et al. (1997), and use their position measurements to derive the offset of the core in Cygnus A between 22.2 and 43.2 GHz (observation epochs 1992.44 and 1990.40, respectively). Krichbaum et al. (1997) give Gaussian model fits describing the compact structure of the source. We use these models to calculate the shifts of the total of four features situated both in the jet (components J3, J4) and counter–jet (components C1, C2). The two closest jet–side components, J1 and J2, are blended together in the model at 22 GHz. The averaged shifts are: as for J3 and J4, and as for C1 and C2. The negative sign for the shift on the counter–jet side indicates that the component separations from the core are shorter at 43.2 GHz. This fact further supports the identification, as well as frequency dependence, of the core location in Cygnus A. We then estimate that the shift of the core position amounts to as, and use this value for calculating the physical properties of the jet.
The estimated G is consistent with the field strength ( G, for ) in a Poynting flux jet [(Lovelace & Romanova 1996)] driven by a M black hole. Carilli & Barthel (1996, CR96 hereafter) use the unresolved core flux density of Cygnus A at 43 GHz, and apply the minimum energy equation, to arrive at G in a nuclear region of 0.15 mas (0.11 pc) in size. We have pc, for the distance from the jet origin to the core observed at 43 GHz. With these values, G.
The total jet power, , can be related to the luminosity of extended radio lobe, : (CR96), with 0.01–0.1 (Leahy 1991) describing the efficiency of converting bulk kinetic energy into radio luminosity. In Cygnus A, the lobe radio luminosity erg s-1 (CR96), which results in , for our derived .
The predicted location, , of the central engine in Cygnus A is offset by about 0.14 mas from the core. Comparison between the 22 GHz flux densities of two bright features (J2 on the jet side, and C1 on the counter–jet side) evenly separated from gives for the jet–to–counter–jet ratio (this figure should be viewed as an upper limit, if a foregorund absorbing medium is present). The calculated ratio results in for the adopted . Conversely, for used in the model, the corresponding .
4.2 3C 309.1
We use the position measurements of Aaron (1996 and priv. comm.), and adopt the jet geometry as modelled by Kus (1993). Only upper limits are available for the core offset at frequencies higher than 5 GHz, as the separation between the core and closest optically thin feature remains constant. The derived decrease substantially towards higher frequencies. We take it as evidence for larger due to increasing opacity at shorter distances from the jet origin. Between 1.5 and 2.3 GHz, is likely to be close to unity, so we take the corresponding derived quantities as best estimates of physical conditions in the jet. The estimated is larger than in the other objects listed in Table 3, possibly implying a stronger pressure confinement in 3C 309.1. The latter can be reconciled with the results from optical spectroscopy (Forbes et al. 1990) suggesting that 3C 309.1 may have a massive ( Myr-1) cooling flow within a radius of 11.5 kpc.
The variations of necessary to account for the difference in measured are compared in Fig. 5 with changes due to the pressure gradients described in section 2.3.
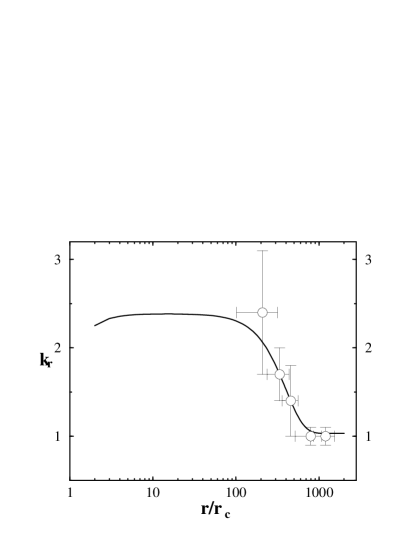
Here we assign , treat upper limits of as measured points, and use the same model parameters as in Fig. 2. The behavior of jet opacity displayed in Fig. 5 is in agreement with the measurements of Aaron et al. (1997), who report a moderately high rotation measure with strong gradients across a nuclear region of pc in size. It should be stressed however that the model shown in Fig 5 is used for purely illustrative purposes, and we do not attempt to make quantitative conclusions or rule out other explanations for the observed core offsets in 3C 309.1. For instance, external free–free absorption in the BLR clouds may result in similar changes of .
4.3 3C 345
Properties of the ultracompact jet in 3C 345 have been discussed recently in several papers, based on X–ray (Unwin et al. 1994, 1997), VLBI (Zensus et al. 1995), and multifrequency observations of the source (Bregman et al. 1986; Webb et al. 1994; Stevens et al. 1996). We adopt a spectral index (Unwin et al. 1994), and derive the geometric parameters for our model from the statistical properties of superluminal features embedded in the extended jet (Zensus et al. 1995; Lobanov 1996).
To obtain a plausible estimate of , one can assume that the jet carries the least kinetic power, so that (the assumption is valid only if the observed speeds are those of bulk motions in the jet). Under this assumption, the variations of viewing angle are derived for the jet components in the immediate vicinity of the core (Lobanov 1996); and we estimate and for the Lorentz factor and viewing angle of the ultracompact jet in 3C 345. These values are close to the fitted values from the synchrotron self–Compton (SSC) models applied to 3C 345 (Unwin et al. 1994; Webb et al. 1994).
The jet opening angle, , is calculated from measuring the jet size within 1 mas distance from the core. The particle density cm-3 is almost 20 times smaller than the value given in Unwin et al. (1994) for an SSC model of the VLBI core. Zensus et al. (1995) have indicated that the SSC value of might be roughly 10 times smaller, to accommodate the magnetic field and particle density found in the jet superluminal features. The latter prediction is consistent with our estimate of within a factor of 2.
| 5.0 | |||
|---|---|---|---|
| 8.4 | |||
| 10.6 | |||
| 22.2 |
Notes: the angular offsets are given for a jet with .
The calculated offset measures in 3C 345 given in Table 3 decrease at lower frequencies. The corresponding must decrease by about 20%, between 5 and 11 GHz (which is within the errors of the fit given in Fig. 3). Assuming that , the decrease in corresponds to . This implies that the optical depth in the jet also becomes smaller at higher frequencies — a situation that does not have a simple explanation in the frameworks of both synchrotron self–absorption and external free–free absorption. With this argument in mind, and also considering the magnitude of errors in the derived offset measures, it appears more likely that the decrease of results from blending effects due to the limited resolution. With decreased angular resolution at lower frequencies, the blending between the core and a nearest jet feature (remaining unidentified in the VLBI maps) should become progressively stronger, resulting in a systematic trend in . However, we cannot entirely exclude an explanation involving peculiar physical conditions in the source. We therefore take the average as the reference value for 3C 345.
The corresponding average characteristic magnetic field, G, is lower than most of the values obtained by Webb et al. (1994), but can be reconciled with the results from Unwin et al. (1994), considering the difference of the adopted particle densities.
The average total power of the jet is erg s-1, and we find erg s-1. With the derived magnetic field, the maximum brightness temperature is K. The obtained value is consistent with the K inverse Compton limit, similarly to the mean values of the maximum brightness temperature in a sample of superluminal sources [(Vermeulen & Cohen 1994)]. Arguments based on the hypothesis of equipartition between relativistic particle and magnetic energy density () predict a lower value of maximum brightness temperature K, Readhead 1994). The relativistic particle energy density, , and the energy density in the magnetic field, . This gives for the ultracompact jet, and therefore the jet must lose its energy through X-ray emission due to inverse Compton scattering. Unwin et al. (1994) argue that physical conditions in the extended jet may as well deviate significantly from the equipartition. According to Unwin et al. (1994), at – pc, which can be a natural consequence of evolution and radiation losses in a plasma with original .
4.4 Magnetic field in the jet of 3C 345
Table 4 summarizes the derived positions and magnetic fields in the VLBI core of 3C 345 at different frequencies. According to the derived positions, the location of the core observed at 22 GHz should be about 4 pc away from the jet origin. The angular offsets are all smaller than the VLBI beam size at corresponding frequency; therefore, the central engine is likely to be blended with the VLBI core even if the opacity is low enough for the emission from the innermost regions of the jet to be observed. Under such circumstances, evidence for emission from the inner jet can only be found in the spectral index or turnover frequency maps (Lobanov et al. 1997).
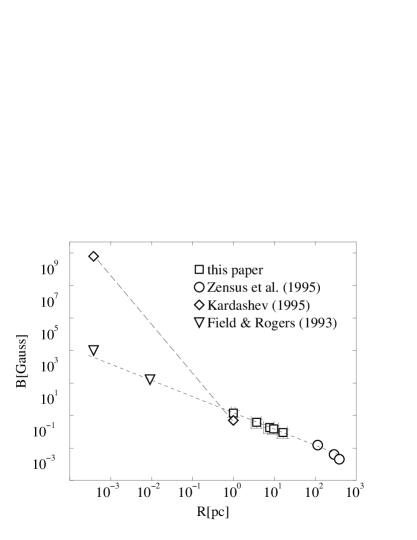
In Fig. 6, the derived magnetic field is compared with the values obtained from synchrotron emission calculations for the extended jet (Zensus et al. 1995), as well as with model predictions for the central engine in 3C 345. The theoretical values of magnetic field in the close vicinity of central engine are calculated from a model of thin, magnetically driven accretion disk (Field and Rogers 1993), and from a model of supermassive black hole surrounded by a strong magnetic field [(Kardashev 1995)]. The accretion disk model predicts at , and G at ( is the Schwarzschild radius of the central black hole). The mass of central black hole can be related to , so that M; and in 3C345: M. Kardashev (1995) suggests that a strong dipole magnetic field may exist in the vicinity of a supermassive black hole. The maximum field strength can be estimated from the equilibrium relations , where , , are masses of black hole, its disk, and its magnetic field respectively. Then . This gives for 3C 345: G. For a dipole magnetic field, one obtains ), so that G at 1 pc, slightly lower than our estimate in Table 3. To match the derived , the mass of central black hole in Kardashev’s model must be .
4.5 3C 395 and 4C 39.25
The core offsets are known from geodetic VLBI measurements between 2.3 and 8.4 GHz (Lara et al. 1996; Guirado et al. 1995). We use the models derived for the parsec–scale jets in these sources (Lara et al. 1994; Alberdi et al. 1993), and adopt the equipartition values of . The resulting are similar to the 2.3–5 GHz offset measure in 3C 309.1. Other derived parameters are also comparable to their counterparts in 3C 345 and 3C 309.1. The derived synchrotron luminosity of 4C 39.25 is quite high, compared to (10–90 GHz) erg s-1 given in Bloom & Marscher (1991), even taking into account the spectral limits.
Recent observations of 4C 39.25 at 22.2 and 43.2 GHz (Alberdi et al. 1997) indicate no detectable position shift in the source. From the measured between 2.3 and 8.4 GHz, the expected shift between 22.2 and 43.2 GHz is less than 0.05 mas. The latter value is below the image resolution at both frequencies ( and mas).
4.6 1038+528 A
Marcaide & Shapiro (1984) reported a 0.7 mas shift between 2.3 and 8.4 GHz in 1038+528 A. Subsequently, Marcaide et al. (1985) derived , based on VLBI data at 1.4, 2.3, 8.4, and 10.6 GHz. Marcaide, Elósegui & Shapiro (1994) applied a relativistic shock model by Gomez et al. (1993) to explain the observed shift. Rioja & Porcas (1997) have made position measurements at 2.3, 8.4, and 15 GHz, and argued that at least a fraction of the observed offset can result from limited resolution and blending at lower frequencies. The (2.3–8.4 GHz) calculated from the data of Rioja et al. (1997) is similar to the values obtained for 4C 39.25 and 3C 395 (although the projection effects should be kept in mind, in view of the different viewing angles in these sources). The upper limit given for the offset between 8.4 and 15 GHz corresponds to , making it rather difficult to be explained by synchrotron self–absorption. Even for free–free absorption, it would require very strong density gradients () in the absorbing medium, in order to reproduce the given limit on .
5 Opacity in the jets
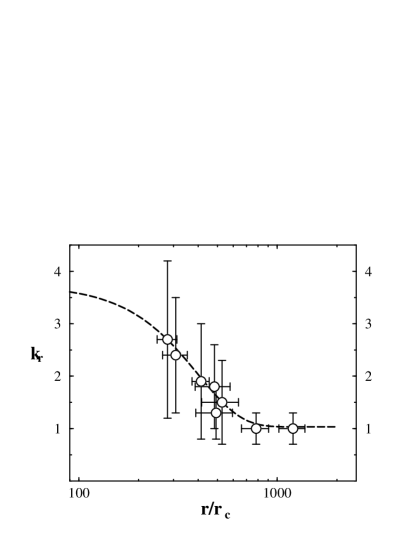
Assuming that the frequency term in (4) dominates core position offsets, the measured can be used for comparing the relative opacity in different sources. To make such a comparison, the offset measures and observing frequencies must be transformed to the respective source rest frames: ; . We then postulate that the largest corresponds to , , and use it as a reference point for calculating the for the rest of the offset measurements. The results are plotted in Fig. 7. In 3C 395, the calculated is very large (), suggesting that the jet viewing angle may be greater than the value cited by Lara et al. (1994). The apparent increase of at shorter radial distances is consistent with the self–absorption scenario described in section 2.3 (the measured become smaller at higher frequencies at which the opacity is larger). The linear scale in Fig. 7 serves only as an illustration, since the intrinsic properties of the sources (reflected by the term) may be different. Detailed studies of each individual object are required for establishing a connection between the jet linear scale and opacity properties. A general prediction is that the position offset should be larger in flat–spectrum cores in which . When increases, the offsets are expected to become smaller, and the core spectrum should be inverted.
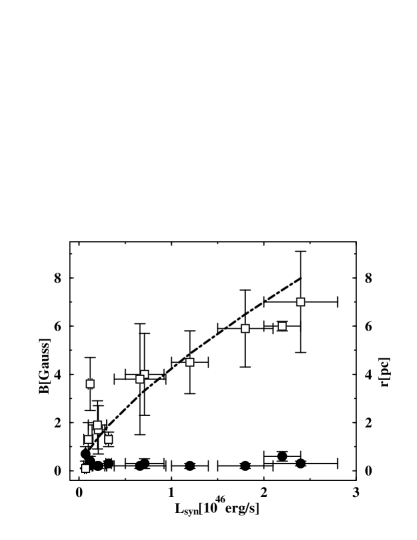
A reasonably good agreement found in Fig. 7 between the derived and model indicates that synchrotron self–absorption may be responsible for the observed properties of optically thick emission from ultracompact jets. One can expect then to find similar physical conditions in the VLBI cores of different sources, if the measurements are done at the same rest frame frequency. To illustrate this, we calculate the magnetic fields and core distances at GHz, and plot them versus jet synchrotron luminosity (Fig. 8). The derived increase, with increasing , and follow roughly the proportionality resulting from (7) and (9). The corresponding magnetic field however remains nearly constant, with an average of [G]. One may expect the values of magnetic field to vary stronger, and exhibit a rather large scatter, if jet emission is affected by external factors such as free–free absorption. The homogeneity of seen in Fig. 8 suggests that the jet plasma is a primary factor determining the location and properties of VLBI cores, and that intrinsic physical conditions in the jets must be fairly similar. If this suggestion holds for other sources, the expected magnetic field in VLBI core should be of the order of [G], for measured in GHz.
6 Conclusions
The frequency dependent position shift of VLBI cores can be used for studying the most compact regions of extragalactic jets, and obtaining quantitative estimates for physical conditions in the immediate vicinity of central engine. In the absence of high–precision position measurements, a more simplistic approach can be employed, assuming that positions of optically thin features in the jet remain the same at all frequencies. Then, the position offsets of optically thin features can be interpreted as a frequency dependent shift of the self–absorbed core of the jet. In some sources (1038+528 A, 3C 345, Cygnus A), insufficient resolution and blending at lower frequencies may undermine the offset measurements. A way to detect and, to a certain degree, to correct the errors due to the blending can be found in introduction of an offset measure, , which is supposed to remain constant for the case of ideal measurements and unchanged opacity of the jet. Listed below are the main results from deriving the offset measures in 6 sources with reported position offsets of VLBI core:
1. The jet luminosity, the maximum brightness temperature, the core magnetic field and location with respect to the jet origin can be determined, from offset measures. For the well studied sources (Cygnus A, 3C 345), the derived values are shown to agree well with values determined by other methods. In Cygnus A, the jet–to–counter–jet ratio determined from the estimated location of the central engine results in a self–consistent source geometry. In 3C 345, the derived maximum brightness temperature indicates that the ultracompact jet is strongly particle–dominated, and must release its energy through inverse Compton scattering. The obtained magnetic field distribution in the ultracompact jet of 3C 345 is in a good agreement with the values derived from inhomogeneous synchrotron models applied to the extended jet components. Based on the derived characteristic magnetic field, it appears more likely that the jet is produced by a thin, magnetized accretion disk, rather than by a single supermassive black hole with a strong dipole magnetic field.
2. External pressure and density gradients typical for the broad line region may change the optical depth along the jet via both synchrotron self–absorption and free–free absorption in an ambient medium. The offset measures derived for different frequency pairs and different objects can be used for studying the opacity effects in ultracompact jets. Changes of jet opacity in 3C 309.1 deduced from the variations of appear to be consistent with a self–absorbed jet propagating through a region with strong density gradients. Similar conclusion can be drawn from the variations of determined for all studied objects, although the agreement with the model may in this case be coincidental (one argument for making such a reservation is that the initial pressure gradients required to fit the data for all sources simultaneously are very high: , at ).
3. The distance at which the observed VLBI core is located at a given frequency is scaled with jet luminosity, so that . At the same time the magnetic field in the core appears to be almost unchanged, from one source to another. This can be taken as another evidence for the synchrotron self–absorption to be a primary factor influencing the observed properties of the jet core.
Further, more detailed studies of absorption in ultracompact jets are required for confirming the conclusions stated above, and for constructing better models of individual sources. Nearly simultaneous, multifrequency VLBI data obtained with phase–referencing should be most useful for a reliable determination of the core offsets, and subsequent studies of the most compact regions in active galactic nuclei.
Acknowledgements
We would like to thank S. Aaron, T. Krichbaum, R. Porcas and M. Rioja for fruitful discussions and providing the unpublished data for this study.
References
- [(Aaron 1996)] Aaron, S.E. 1996, Ph.D. Thesis, Brandeis University
- [(Aaron et al. 1997)] Aaron, S.E., Wardle, J.F.C, and Roberts, D.H. 1997, Vistas in Astronomy, 41, 225
- [(Alberdi et al. 1993)] Alberdi, A., Marcaide, J.M., Marscher, A.P. et al. 1993, ApJ, 402, 160
- [(Alberdi et al. 1997)] Alberdi, A., Krichbaum, T.P., Graham, D.A., et al. 1997, A&A (in press)
- [(Baldwin et al. 1996)] Baldwin, J.A., Ferland, G.J., Korista, K.T. et al. 1996, ApJ, 461, 664
- [(Beasley & Conway 1995)] Beasley, A.J. & Conway J.E. 1995, in Very Long Baseline Interferometry and the VLBA, eds. J.A. Zensus, P.J. Diamond, & P.J. Napier (Cambridge, Cambridge University Press), 291
- [(Begelman 1995)] Begelman, M.C. 1995, in Publications of the National Academy of Sciences, Vol.92, Quasars and Active Galactic Nuclei: High Resolution Radio Imaging, eds. M.H. Cohen & K.I. Kellermann (reprint: Charlottesville, NRAO), 11442
- [(Begelman et al. 1984)] Begelman, M.C., Blandford, R.D., & Rees, M.J. 1984, Rev. Mod. Phys., 56, 255
- [(Biretta et al. 1986)] Biretta, J.A., Moore, R.L., & Cohen, M.H. 1986, ApJ, 308, 93
- [(Blandford & Königl 1979)] Blandford, R.D. & Königl, A. 1979, ApJ, 232, 34.
- [(Blandford & Rees 1974)] Blandford, R.D. & Rees, M.J. 1974, MNRAS, 169, 395
- [(Bloom & Marscher 1991)] Bloom, S.D. & Marscher, A.P. 1991, ApJ, 366, 16
- [(Blumenthal & Gould 1970)] Blumenthal, G.R. and Gould, R.J. 1970, Rev. Modern Phys., 4, 237
- [(Bregman et al. 1986)] Bregman, J.N., Glassgold, A.E., Huggins, P.J., et al. 1986, ApJ, 301, 708
- [(Carilli & Barthel)] Carilli, C.L. & Barthel, P.D. 1996, A&A Rev., 7, 1
- [(Cassidy & Raine 1993)] Cassidy, I. & Raine, D.J. 1993, MNRAS, 260, 385
- [(Daly & Marscher 1988)] Daly, R.A., Masrcher, A.P. 1988, ApJ, 334, 539
- [(Ferguson et al. 1997)] Ferguson, J.W., Korista, K.T., & Ferland, G.J. 1997, ApJS, 110, 287
- [(Field & Rogers 1993)] Field, G.B. & Rogers, R.D. 1993, ApJ, 403, 94
- [(Fomalont 1995)] Fomalont, E. 1995, in Very Long Baseline Interferometry and the VLBA, eds. J.A. Zensus, P.J. Diamond, & P.J. Napier (Cambridge, Cambridge University Press), 205
- [(Georganopoulos & Marscher 1996)] Georganopoulos, M. & Marscher, A.P. 1996 in “Energy Transport in Radio Galaxies and Quasars”, eds. P.E. Hardee, A.H. Bridle, J.A. Zensus, ASP Conference Series, v.100, 67
- [(Gomez, Alberdi, & Marcaide 1993)] Gomez, J.L., Alberdi, A., & Marcaide, J.M. 1993 A&A 274, 55
- [(Ghisellini et al. 1992)] Ghisellini, G., Celotti, A., George, I.M., &Fabian, A.C. 1992, MNRAS, 258, 776
- [(Guirado et al. 1995)] Guirado, J.C., Marcaide, J.M., Alberdi, A., et al. 1995, AJ, 110, 2586
- [(Jones et al. 1996)] Jones, D.L., Tingay, S.J., Murphy, D.W., et al. 1996, ApJ, 466, 63
- [(Hummer 1988)] Hummer, D.G. 1988, ApJ, 327, 477
- [(Kaspi et al. 1996)] Kaspi, S., Smith, P.S., Maoz, D., Netzer, H., Januzzi, B.T. 1996, ApJ, 471, L75
- [(Koönigl 1981)] Königl, A. 1981, ApJ, 243, 700
- [(Krichbaum et al. 1997)] Krichbaum, T.P., Alef, W., Witzel, A., Zensus, J.A., Booth, R.S., Greve, A., & Rogers, A.E.E. 1997 A&A, in press
- [(Krichbaum & Witzel 1992)] Krichbaum, T.P. & Witzel, A. 1992, in “Variability of Blazars”, eds. E. Valtaoja & M. Valtonen (Cambridge: CUP), p.205
- [(Kardashev 1995)] Kardashev, N.S. 1995, MNRAS, 276, 515
- [(Kus 1993)] Kus, A.J. 1993, in “Sub–arcsecond Radio Astronomy”, eds. R.J. Davis & R.S. Booth (Cambridge: CUP), p.365
- [(Lara et al. 1994)] Lara, L., Alberdi, A., Marcaide, J.M., & Muxlow, T.W.B. 1994, A&A, 285, 393
- [(Lara et al. 1996)] Lara, L., Marcaide, J.M., Alberdi, A., & Guirado, J.C. 1996, A&A, 314, 672
- [(Leahy 1991)] Leahy, J.P. in “Beams and Jets in Astrophysics”, ed. P.A. Hughes (Cambridge: CUP), p.100
- [(Levinson et al. 1995)] Levinson, A., Laor, A., & Vermeulen, R.C. 1985, ApJ, 448, 589
- [(Lobanov 1996)] Lobanov, A.P. 1996, Ph.D. Thesis (New Mexico Institute of Mining and Technology, Socorro NM)
- [(Lobanov et al. 1997)] Lobanov, A.P., Carrara, E., & Zensus, J.A. 1997, Vistas in Astronomy, 41, 253
- [(Lovelace & Romanova 1996)] Lovelace, R.V.E. & Romanova, M.M. 1996, in “Cygnus A – Study of a Radio Galaxy”, eds. C.L. Carilli & D.E. Harris (Cambridge: CUP), p.98
- [(Marcaide & Shapiro 1984)] Marcaide, J.M. & Shapiro, I.I. 1984, ApJ, 276, 56
- [(Marcaide et al. 1985)] Marcaide, J.M., Shapiro, I.I., Corey, B.E., et al. 1985, A&A, 142, 71
- [(Marcaide et al. 1994)] Marcaide, J.M., Elósegui, P., & Shapiro, I.I. 1994, AJ, 108, 368
- [(Marscher 1980)] Marscher, A.P. 1980, ApJ, 235, 386
- [(Marscher 1995)] Marscher, A.P. 1995, in Publications of the National Academy of Sciences, Vol.92, Quasars and Active Galactic Nuclei: High Resolution Radio Imaging, eds. M.H. Cohen & K.I. Kellermann (reprint: Charlottesville, NRAO), 11442
- [(Readhead 1994)] Readhead, A.C.S. 1994, ApJ, 426, 51
- [(Rioja & Porcas 1997)] Rioja, M.J. & Porcas, R.W. 1997, in Proceedings of IAU Cooloquium No. 164, eds. J.A. Zensus, J.M. Wrobel & G.B. Taylor (Cambridge: CUP)
- [(Rybicki & Lightman 1979)] Rybicki, G.B. & Lightman, A.P. 1979, “Radiative Processes in Astrophysics”, (J.Wiley: New York)
- [(Scheuer 1960)] Scheuer, P.A.G. 1960, MNRAS, 120, 231
- [(Sol et al 1989)] Sol, H., Pelletier, H. & Asséo, E. 1989, MNRAS, 237, 411
- [(Stevens et al. 1996)] Stevens, J.A., Litchfield, S.J., Robson, E.I., et al. 1996, ApJ, 466, 158
- [(Udomprasert et al. 1997)] Udomprasert, P.S., Taylor, G.B., Pearson, T.J., & Roberts, D.H. 1997, ApJ, 483, L1
- [(Unwin et al. 1994)] Unwin, S.C., Wehrle, A.E., Urry, C.M., et al. 1994, ApJ, 432, 103
- [(Unwin, et al. 1997)] Unwin, S.C., Wehrle, A.E., Lobanov, A.P., et al. 1997, ApJ, 480, 596
- [(Vermeulen & Cohen 1994)] Vermeulen, R.C. & Cohen, M.H. 1994, ApJ, 430, 467
- [(Vermeulen, Readhead & Backer 1994)] Vermeulen, R.C., Readhead, A.C.S., & Backer, D.C. 1994, ApJ, L41.
- [(Walker, Romney & Benson)] Walker, R.C., Romney, J.D., & Benson, J.M. 1994, ApJ, 429, L45
- [(Wardle et al. 1994)] Wardle, J.F.C., Cawthorne, T.V., Roberts, D.H., & Brown, L.F. 1994, ApJ, 437, 122
- [(Webb et al. 1994)] Webb, J.R., Shrader, C.R., Balonek, T.J., et al. 1994, ApJ, 422, 570
- [(Zensus, Cohen & Unwin 1995)] Zensus, J.A., Cohen, M.H., & Unwin, S.C. 1995, ApJ, 443, 35
- [(Zensus et al. 1997)] Zensus, J.A. et al. 1997, (in preparation)