A Reverse Monte Carlo study of H+D Lyman alpha absorption from QSO spectra
S. A. Levshakov1,2, W. H. Kegel1, and F. Takahara3
1Institut für Theoretische Physik der Universität Frankfurt
am Main, Postfach 11 19 32,
60054 Frankfurt/Main 11, Germany
2A. F. Ioffe Physico-Technical Institute, 194021
St. Petersburg, Russia
3Department of Physics, Tokyo Metropolitan University,
Hachioji, Tokyo 192-03, Japan
Abstract. A new method based on a Reverse Monte Carlo [RMC] technique and aimed at the inverse problem in the analysis of interstellar (intergalactic) absorption lines is presented. The line formation process in chaotic media with a finite correlation length of the stochastic velocity field (mesoturbulence) is considered. This generalizes the standard assumption of completely uncorrelated bulk motions in the microturbulent approximation which is used for the data analysis up-to-now. It is shown that the RMC method allows to estimate from an observed spectrum the proper physical parameters of the absorbing gas and simultaneously an appropriate structure of the velocity field parallel to the line-of-sight.
The application to the analysis of the H+D Ly profile is demonstrated using Burles & Tytler [B&T] data for QSO 1009+2956 where the DI Ly line is seen at .
The results obtained favor a low D/H ratio in this absorption system, although our upper limit for the hydrogen isotopic ratio of about is slightly higher than that of B&T (D/H = ). We also show that the D/H and N(HI) values are, in general, correlated, i.e. the derived D-abundance may be badly dependent on the assumed hydrogen column density. The corresponding confidence regions for an arbitrary and a fixed stochastic velocity field distribution are calculated.
1 Introduction
The measurement of deuterium abundance at high redshift from absorption spectra of QSOs is the most sensitive test of physical conditions in the early universe just after the era of Big Bang Nucleosynthesis [BBN]. The standard BBN model predicts strong dependence of the primordial ratio of deuterium to hydrogen nuclei D/H on the cosmological baryon-to-photon ratio and the effective number of light neutrino species (e.g. Walker et al. 1991). The accuracy of the theoretically calculated hydrogen isotopic ratio is rather high and for a given value of , D/H is determined with a 15 % precision (Sarkar 1996). Therefore to be comparable with this small uncertainty in the predicted D/H value astronomical measurements of the deuterium and hydrogen column densities should be of a similar precision.
The analysis of interstellar (intergalactic) absorption lines is not, however, an easy and unambiguous task, especially for the case of optically thick lines. As demonstrated in a series of papers (Levshakov & Kegel 1997; Levshakov, Kegel & Mazets 1997; Levshakov, Kegel & Takahara 1997; Papers I, II and III, hereinafter, respectively) the main difficulty is connected with correlation effects between different physical parameters that may occur in chaotic media along the line-of-sight. For instance, if one considers the line formation process in the light of a point source, then the observed spectrum reflects only one realization of the velocity field and, hence, large deviations from the expected average intensity may occur if the correlation length of the velocity field is not very small compared with the cloud size . Paper I clearly demonstrates that in general (i.e. when ) the absorption line profile is asymmetric (skew) and may look like a barely resolved blend whereas homogeneous density and temperature have been adopted in these calculations.
This fact becomes crucial for the analysis of H+D Ly spectra where hydrogen lines are always saturated. An example discussed in Paper II suggests that the apparent scatter of the D/H ratio of more than a factor of 4 revealed in the ISM may be caused by an inadequate analysis.
The study of extragalactic hydrogen spectra may turn out to be more complicated. Two limiting cases should be distinguished :
1. Complete statistical ensemble. If one observes UV-spectra of galaxies when the spectrograph aperture covers an essential part of the galactic surface, then should reasonably correspond to the observations since this case is a good approximation to the mathematical space averaging procedure. An example of the averaged mesoturbulent H+D Ly spectra is considered by Levshakov & Takahara (1996). It has been shown that the standard Voigt-fitting procedure applied to these spectra may yield either higher or lower D/H value (up to a factor of 10) as compared with an adopted one.
2. Poor statistical ensemble. If a hydrogen spectrum is observed in an intervening cloud along a QSO line-of-sight, and the quasar itself may be considered as a point-like source, then the light beam intercepts the absorbing region in only one direction. To obtain an unambiguous result in this case the structure of the stochastic velocity field must be known exactly. The Voigt-fitting procedure may lead in this case to underestimated D/H values as will be shown below.
This report presents a self-consistent method which enables us to evaluate both the physical parameters of the gas cloud and the corresponding velocity field projection to the line-of-sight.
2 The RMC Method and Results
The main aim of the present study is the inverse problem, i.e. the problem to deduce physical parameters from an observed absorption spectrum in the light of a point-like source. For this we use the same mesoturbulent model specified in full detail in Paper II. The inverse problem is always an optimization problem in which an objective function is minimized. We use a method to estimate a goodness of the minimization and a technique to draw confidence regions. Our model is fully defined by specifying the hydrogen column density N(HI), the kinetic temperature Tkin, the ratio of the rms turbulent velocity to the hydrogen thermal velocity , and the ratio. In addition we have to specify the distribution of the velocity component parallel to the line of sight . Here is a continuous random function of the coordinate . In the numerical procedure it is sampled at evenly spaced intervals . The number of intervals depends on the current values of and , being typically (see Paper II, for details). Thus, to solve the inverse problem we have to optimize the objective function in the parameter space of very large and variable (depending on and ) dimension. The RMC method based on the computational scheme invented by Metropolis et al. (1953) proved to be adequate in this case.
Contrary to the standard Monte Carlo procedure in which random configurations of a given physical system are generated to estimate its average characteristics, the RMC takes an experimentally determined set of data and searches for a random parameter configuration which reproduces the observation. Applied to the analysis of absorption spectra, the computational procedure is described in detail in Paper III. Here we only note that the main idea was to divide the parameter space into two parts : (1) the subspace of constant dimension which contains the physical parameters like N(HI), D/H, etc., and (2) the subspace of variable dimension containing the velocity components .
We applied the procedure to the H+D Ly line observed by B&T in the spectrum of QSO 1009+2956 at . This spectrum was selected since (i) it shows a well pronounced DI absorption, and (ii) it was obtained with high spectral resolution and signal-to-noise ratio.
Using a two-cloud microturbulent model B&T derived the following parameters : total hydrogen column density N(HI) = cm-2, D/H = , Tkin = K and K for the blue and red subcomponents, respectively, the corresponding turbulent velocities km s-1 and km s-1, and a difference in the radial velocity of 11 km s-1.

We started with the calculation of a template H+D Ly spectrum based on the parameters listed in Table 1 by B&T. To simulate real data, we added the experimental uncertainties to the template intensities which were sampled in equidistant bins as shown in Fig. 1 by dots and corresponding error bars. We adopted for the redshift the mean value of 2.504 and used a one-component mesoturbulent model with a homogeneous density and temperature.
Adequate profile fits for three different D/H values are shown in Fig. 1 by solid curves. The estimated parameters and corresponding values of (per degree of freedom) are also listed for each solution. The velocity distributions leading to these profiles [where ] are shown by histograms.
Although our model (one cloud with homogeneous density and temperature accounting for a finite correlation length in the stochastic velocity field) is quite different from that of B&T (two clouds, stochastic velocities in each one considered in the microturbulent approximation), we derive with the RMC method in this particular case values for N(HI), D/H, and Tkin which are not significantly different from those of B&T. The rms turbulent velocity , however, is substantially larger. For the additional parameter we found a value of about 5, indicating a substantial variation of the large-scale velocity field along the line-of-sight.
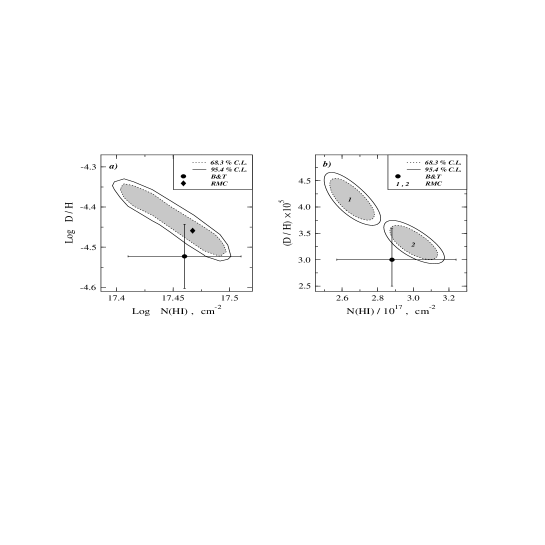
The best RMC solution with the smallest (the middle panel in Fig. 1) is labeled by the filled diamond in Fig. 2a whereas the filled circle is the B&T result. In Fig. 2a, we show confidence regions which are projected onto the plane “log N(HI) – log D/H” under the condition that the parameters Tkin, and are fixed, but the velocity field configuration is free. The elongated and declined shape of these confidence regions reflects a correlation between D/H and N(HI), i.e. the scatter of the D/H values cannot be simply determined by the projection of a given confidence region onto the corresponding axis.
Another important result obtained is the existence of possible multiple solutions with non-overlapping confidence regions. This may be a real problem, if the multiplicity scatters parameters significantly. To illustrate the problem we draw two confidence regions labeled by numbers 1 and 2 (Fig. 2b). These regions correspond to the RMC H+D profiles shown in the lower and upper panels of Fig. 1 which present the limiting D/H values for the mesoturbulent model. The regions 1 and 2 were calculated in this case under the condition that Tkin, , and the corresponding configurations of the velocity field are fixed. Thus, if one succeeds to determine the velocity field distribution by including additional absorption lines in the analysis, the accuracy of the D/H measurements may be improved significantly.
3 Acknowledgments
This work was supported by the Deutsche Forschungsgemeinschaft and by the RFBR grant No. 96-02-16905-a.
References
Burles, S. and Tytler, D. : 1996,
‘Cosmological deuterium abundance and the baryon density of
the Universe’, astro-ph 9603070 [B&T].
Levshakov, S.A. and Takahara, H. : 1996,
‘The effect of spatial correlations in a chaotic velocity
field on the D/H measurements from QSO absorption spectra’,
Monthly Notices Roy.
Astron. Soc. 279, 651–660.
Levshakov, S.A. and Kegel, W.H. : 1997,
‘New aspects of absorption line formation in
intervening turbulent clouds – I. General principles’,
Monthly Notices Roy. Astron. Soc.
288, 787–801, [Paper I].
Levshakov, S.A., Kegel, W.H. and Mazets I.E.: 1997,
‘New aspects of absorption line formation
in intervening turbulent clouds – II. Monte Carlo
simulation of interstellar H+D Ly
absorption profiles’, Monthly Notices Roy. Astron. Soc.
288, 802–816, [Paper II].
Levshakov, S.A., Kegel, W.H. and Takahara F. : 1997,
‘New aspects of absorption line formation
in intervening turbulent clouds – III. The inverse problem in
the study of H+D profiles’,
Monthly Notices Roy. Astron. Soc. (submit.) [Paper III].
Metropolis, N. et al. : 1953,
‘Equation of state calculations by fast computing machines’,
J. Chem. Phys. 21, 1087–1092.
Sarkar, S. : 1996, ‘Big bang nucleosynthesis and physics beyond the
standard model’, Rep. Prog.
Phys. 59, 1493–1609.
Walker, T.P. et al. : 1991, ‘Primordial nucleosynthesis redux’,
Astrophys. J. 351, 51–69.