Absorption dips in GRO J165540: mapping the inner accretion disk
Abstract
Using the RXTE PCA we discovered dips in the X-ray light curves of the black-hole candidate GRO J165540 during outburst. They are short (minute) and deep (down to 8% of the out-of-dip intensity). Similar kind of dips were found in 90 s measurements of the RXTE ASM during the same outburst. The occurrences of the dips are consistent with the optically determined orbital period, and were found between photometric orbital phases 0.72 and 0.86. This constitutes the first evidence for orbital variations in X-rays for GRO J165540. The PCA data indicate that an absorbing medium is responsible for these dips. Using these results we are able constrain the extent of the absorbing medium and the central X-ray source. GRO J165540 was in the canonical high state during our PCA observations.
1 Introduction
The low-mass X-ray binary and soft X-ray transient GRO J165540 was discovered during an outburst in 1994 and since then has shown irregular outburst activity (e.g., Zhang et al. [1]). Radio observations during its 1994 outburst revealed jets moving at relativistic (apparently superluminal) speeds (Tingay et al. [3], Hjellming & Rupen [2]). Dynamical measurements suggest that the compact star in GRO J165540 is a black hole, with a mass of 7 M⊙, while the companion star has a mass of 2 M⊙; its orbital period is 2.62 days and its inclination is 70∘ (Orosz & Bailyn [4], van der Hooft et al. [5]).
X-ray intensity dips caused by an intervening medium have now been found in the light curves of various low-mass and high-mass X-ray binaries (e.g., Parmar & White [6], Marshall et al. [7], Saraswat et al. [8], and references therein). During the majority of these dips the X-ray spectra harden, which is indicative of photo-electric absorption of radiation from the central X-ray source. However, a simple neutral and uniform medium which absorbs the emission does not fit the X-ray spectra. Instead, the spectra reveal an excess flux at low energies (typically 4 keV) compared to that expected from the amount of absorption estimated from data above 4 keV.
In this contribution we report on such dips in the X-ray light curves of GRO J165540 seen with the Rossi X-ray Timing Explorer (RXTE) during its 1996/1997 outburst. A full report can be found in Kuulkers et al. ([9]).
2 Observations
2.1 Periodic drops in the intensity
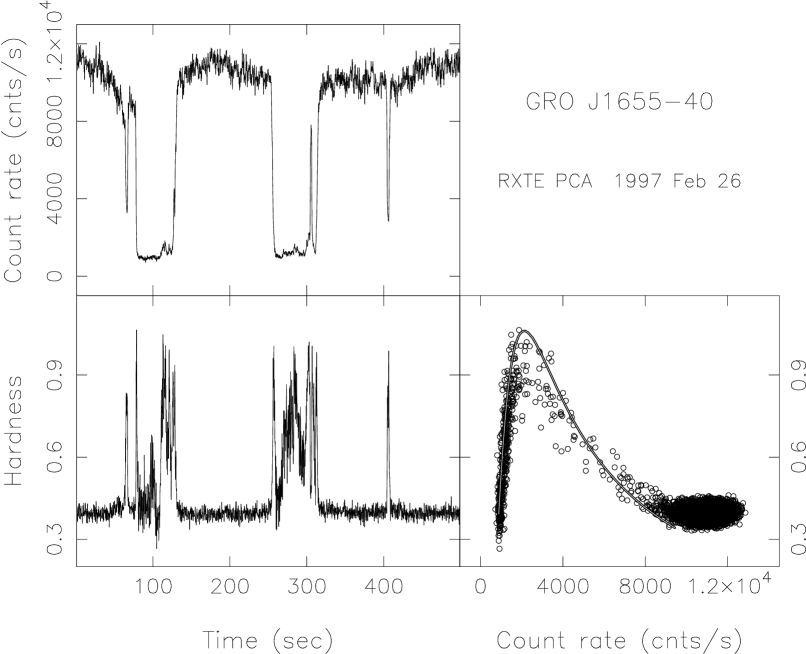
The first public RXTE Target of Opportunity Observations of GRO J165540 were performed on 1997 February 26 19:34–23:30 UTC (JD 2450506). The Proportional Counter Array (PCA) data were collected with a time resolution of 16 s (129 photon energy channels, covering 2.0–60 keV) and 125 s (3 energy channels, covering 2.0–5.0–8.7–13.0 keV). The 2.0–13.0 keV count rate of GRO J165540 was generally 11 500 cts s-1. However, 2 sharp deep drops down to 1000 cts s-1 lasting 50–60 s, preceded and followed by short dips, occurred (Fig. 1, upper panel). The fall time scales of the main dips were 2–4 s, while the rise time scales were 3–5 s.
The All Sky Monitor (ASM) onboard RXTE scans the sky in series of 90 s dwells in three energy bands, 1.5–3, 3–5, and 5–12 keV. Due to satellite motion and a 40% duty cycle, any given source is scanned 5–10 times per day. In Fig. 2 we show the 1996/1997 outburst light curve (2-12 keV) provided by the RXTE ASM team, covering the period from 1996 February 21 to 1997 October 3. Twelve clear drops in the intensity can be seen down by 25–95%, which are indicated by arrows. During these dips the spectral hardness increases (Fig. 1, lower left panel).

The occurrences of the ASM and PCA dips are best fit with a period of 2.62130.0005 days (1). Recently, we became aware of more dips observed by the PCA (JD 2450488; R. Remillard, 1997, private communication) and the ROSAT HRI (JD 2450520; Kuulkers et al. [10]); the dips observed by the PCA and the ROSAT HRI are also indicated in Fig. 2. All the observed dips occurred between photometric orbital phases (Orosz & Bailyn [4], van der Hooft et al. [5]) 0.72 and 0.86. As an example, in Fig. 3 we show a small part of the ASM data during which dips could be seen in every orbital cycle, folded on the orbital ephemeris (Orosz & Bailyn [4], van der Hooft et al. [5]).

2.2 Absorption
The PCA hardness curve (Fig. 1, lower left panel) and corresponding hardness vs. intensity diagram (HID, Fig. 1, lower right panel) show that as the intensity drops the X-ray spectrum becomes much harder, until a certain threshold count rate of 2000 cts s-1 is reached. During the last part of the fall the spectrum softens again to almost the same value as the out-of-dip level. The reverse behaviour is seen during the rise of the dips. In the HID the source always follows the same loop, also during the small pre- and after-dips and during the short spike in the second dip. The spectral hardening between the out-of-dip count rate and the threshold value suggests that absorption is involved in the process giving rise to the dips.
We fitted both the out-of-dip (persistent) and the dips energy spectra. For the fits to the out-of-dip spectrum we used the model usually employed for black-hole candidates, i.e., a disk-black body (DBB) plus a power law. This resulted in: N cm-2, for DBB parameters Tin and Rin keV and km, respectively, and the power-law parameters and normalization Apl and cm-2 s-1 keV-1, respectively (reduced of 1.6 for 54 degrees of freedom [dof]). The out-of-dip X-ray flux (2–30 keV) was 2.510-8 erg cm-2 s-1. This shows that the spectrum was soft.
The dip spectra were not well fitted by homogeneous absorption of the out-of-dip DBB and power-law components by cold material, especially at low energies. The observed flux below 6 keV is much in excess from that expected in this model. We performed simple fits to the spectra by modelling this ‘low energy excess’ either as a separate component (power law or black body), or by partial covering absorption of the persistent components (e.g. Marshall et al. [7]). In all the dip spectral fits the persistent power-law component was found to be absent. The low-energy excess contributes only 6–7% of the out-of-dip flux. Depending on the model we found that the absorption of the DBB component increased up to 25–2001022 at the lowest mean dip intensities, see Kuulkers et al. ([9]).
To see if we can qualitatively reproduce the observed shapes of the HID, we calculated several sequences of X-ray spectra and determined intensity and hardness values. The out-of-dip spectrum was modeled by the persistent DBB component (only subject to interstellar absorption) as given above, plus the low-energy excess contribution modeled by a black body (see Kuulkers et al. ([9]). In the dip we linearly increased the absorption of the persistent DBB component from zero up to 1501022 cm-2, fixing the rest of the parameters to those given by the out-of-dip spectrum. The results are plotted as a line in the lower right panel of Fig. 1, and show that a gradual increase in absorption of the DBB component can reproduce the observed dip behaviour.
2.3 Fast timing behaviour
In order to investigate the state of the source (see e.g. van der Klis [11]) we computed power density spectra (PDS) for 256 s data stretches for the out-of-dip light curves. The mean PDS is shown in Fig. 4, and is well fitted with a single power law (reduced of 202 for 186 dof). The mean fractional rms variations (0.01–1 Hz, 2–13 keV) and power-law index are 2.800.06% and 0.980.01, respectively. We found no energy dependence of the PDS shapes. We also computed PDS during the dips; then we used data stretches of 16 s. No clear noise component could be seen in the power spectra during the dip, with a 2 upper limit of 4.6% and 3.6% (0.01–100 Hz, 2–13 keV), assuming a power-law shaped noise component with index 1. The properties of the out-of-dip PDS and the strong soft DBB component together with a steep power law in the X-ray energy spectra indicate that when the dips occurred GRO J165544 was in the so-called high state.
3 Discussion
3.1 Absorption dips
We have discovered short-term (minutes) X-ray deep dipping behaviour of GRO J165540 in RXTE PCA and ASM data. The best fit period of the occurrence of these dips is consistent with the optical period of the system (2.621680.00014 days; van der Hooft et al. [5]; see also Orosz & Bailyn [4]). This therefore constitutes the first evidence of the orbital period in GRO J165540 in X-rays. All these dips occurred between photometric orbital phases 0.72 and 0.86.
The phasing of the occurrence of the X-ray dips is very similar to that observed in the low-mass X-ray binary dip sources (e.g., Parmar & White [6]). The inclination of such sources which show only dips and no eclipses are in the range 60–75∘ (e.g., Frank et al., [12]). The inclination inferred for GRO J165540 (70∘, Orosz & Bailyn [4], van der Hooft et al. [5]) is in agreement with this. This suggests a similar origin for the cause of the dips in GRO J165540 and the low-mass X-ray binary dip sources. Interaction of the inflowing gas stream from the secondary with the outer edge of the disk may cause a thickening of the outer edge and/or material above or below the disk in the expected 0.6–0.0 phase range (e.g., Parmar & White [6]) and may well cause the observed dipping behaviour. Since the dip durations are rather short compared to the orbital period, we expect that the dips in GRO J165540 are caused by filaments of matter above or below the disk originating from the stream-disk impact region.

3.2 An atlas of GRO J165540
For GRO J165540 the system parameters have been well determined (Orosz & Bailyn [4], Van der Hooft et al. [5]). In this system the time scales of the dips imposes constraints on the sizes of the different emitting and absorbing media. The fall and rise time (3.5 s) constrain the size of the region which is ”obscured”; in fact, this gives an upper limit on the size, because the region over which the column density increases significantly also has a finite width (Leahy, Yoshida, & Matsuoka [18]). The duration of the dips (55 sec) constrains the size of the absorbing medium itself.
Since , we may assume that the absorbed X-ray source is much smaller than the absorbing medium. A medium which crosses a point-like central X-ray source may produce irregular X-ray dips, whereas crossing an extended region such as an accretion disk corona may produce smooth and longer energy independent modulations (e.g., Parmar & White [6]). If the medium corotates in the binary frame and is located at a radius which is smaller than the outer disk radius (0.85 RL [Orosz & Bailyn [4]], where RL is the effective Roche lobe radius of the black hole) the upper limit on the size of the X-ray emitting region is 460 km. If the medium corotates with matter in the accretion disk (i.e., with a Kepler velocity), the upper limit becomes 2000 km. Similar reasoning gives an approximate upper limit on the size of the absorbing medium of 7200 km or 32 000 km, in the case of rotation within the binary frame or corotation in the accretion disk.
We note that the partial covering absorption model to fit the spectra during the dips may impose physical problems. In such a model the absorbing medium consists of blobs of material and an individual blob only partially covers the central X-ray source. This means that the individual blobs must be substantially smaller than the inferred size of the X-ray emitting region. Since the size of the absorbing medium is considerably (15–70 times) larger than the X-ray emitting region there must be many of such blobs in the absorbing medium. Then one would expect many of them along the line of sight, and that they wouldd average out to a more or less uniform density medium, unless the radial extent of the absorbing medium is much smaller than the azimuthal extent.
3.3 4U 163047 and GRS 1915+105
Recently, a dip in the light curve of 4U 163047 during its 1996 outburst has been found in RXTE PCA data (Kuulkers et al. [9]; Tomsick et al. [13]). Kuulkers et al. ([14]; [15]) pointed out similarities in the X-ray behaviour between 4U 163047 and GRO J165540, and postulated that they are similar systems. The nature of the compact star in 4U 163047, however, is unknown. Its X-ray spectral (e.g. Barret et al. [16]) and X-ray timing (Kuulkers et al. [14]) properties during outburst suggest it is a black-hole. The dip spectral behaviour of 4U 163047 is similar to that seen in GRO J165540; it was therefore proposed that 4U 163047 is also seen at a relatively high inclination, i.e. 60–75∘ (Kuulkers et al. [9]). We note that the ‘dipping’ behaviour seen in the other Galactic superluminal jet source, GRS 1915+105, is much more complex than in GRO J165540 and 4U 163047. This dipping behaviour has been proposed to be due to thermal-viscous instabilities in the inner disk (Belloni et al. [17]) and is therefore not due to absorption events.
Acknowledgements
This work was supported in part by the Netherlands Organisation for Scientific Research (NWO) under grant PGS 78-277 and by the Netherlands Foundation for research in astronomy (ASTRON). MM is a fellow of the Consejo Nacional de Investigaciones Científicas y Técnicas de la República Argentina. JvP acknowledges support from the National Aeronautics and Space Administration through contract NAG5-3269. The RXTE ASM data used are quick-look results provided by the ASM/RXTE team.
References
- [1] S.N. Zhang, et al., ApJ 479 (1997), 381
- [2] R.M. Hjellming and M.P. Rupen, Nat 375 (1995), 464
- [3] S.J. Tingay, et al., Nat 374 (1995), 141
- [4] J.A. Orosz and C.D. Bailyn, ApJ 477 (1997), 876 and erratum in ApJ 482 (1997), 1086
- [5] F. van der Hooft, et al., A&A 329 (1998), 538
- [6] A.N. Parmar and N.E. White, Mem. Soc. Astr. It. 59 (1988), 147
- [7] F.E. Marshall, et al., ApJ 419 (1993), 301
- [8] P. Saraswat, et al., ApJ 463 (1996), 726
- [9] E. Kuulkers, et al., ApJ Feb 28 issue (1998), in press (astro-ph/9710024)
- [10] E. Kuulkers, et al., (1997), in preparation
- [11] M. van der Klis, in X-ray Binaries (1995), W.H.G. Lewin, J. van Paradijs and E.P.J. van den Heuvel (eds.), Cambridge, Cambridge University Press, p. 252
- [12] J. Frank, et al., A&A 178 (1987), 137
- [13] J.A. Tomsick, et al., ApJ Feb 28 issue (1998), in press (astro-ph/9709214)
- [14] E. Kuulkers, et al., ApJ 474 (1997), L47
- [15] E. Kuulkers, et al., MNRAS 291 (1997), 81
- [16] D. Barret, et al., ApJ 473 (1996), 963
- [17] T. Belloni, et al., ApJ 488 (1997), L109
- [18] D.A. Leahy, et al., ApJ 434 (1994), 341