02(11.19.3; 11.14.1; 11.01.2; 11.19.7; 09.08.1; 13.09.1)
T. Contini, contini@wise.tau.ac.il
Starbursts in barred spiral galaxies
Abstract
This paper presents optical long-slit spectroscopic observations of 105 barred Markarian IRAS galaxies. These observations are used to determine the spectral type (starburst or Seyfert) of emission-line regions in the nucleus and along the bar of the galaxies, in order to define a homogeneous sample of Starburst Nucleus Galaxies (SBNGs).
Our selection criteria (ultraviolet excess, far infrared emission and barred morphology) have been very efficient for selecting star-forming galaxies, since our sample of 221 emission-line regions includes 82% nuclear or extranuclear starbursts. The contamination by Seyferts is low (9%). The remaining galaxies (9%) are objects with ambiguous classification (Hii or LINER).
The dust content and H luminosity increase towards the nuclei of the galaxies. No significant variation of the electron density is found between nuclear and bar Hii regions. However, the mean H luminosity and electron density in the bar are higher than in typical disk Hii regions.
We investigate different mechanisms for explaining the excess of nitrogen emission observed in our starburst nuclei. There is no evidence for the presence of a weak hidden active galactic nucleus in our starburst galaxies. The cause of this excess is probably a selective enrichment of nitrogen in the nuclei of the galaxies, following a succession of short and intense bursts of star formation.
Our sample of SBNGs, located at a mean redshift of 0.015, has moderate H ( erg s-1) and far infrared ( L⊙) luminosities. The types are distributed equally among early- and late-type giant spirals with a slight preference for Sbc/Sc types because of their barred morphology. The majority (62%) of SBNGs are isolated with no sign of gravitational interaction. In terms of distance, luminosity and level of interaction, SBNGs are intermediate between Hii galaxies and luminous infrared galaxies.
keywords:
galaxies: starburst – galaxies: nuclei – galaxies: active – galaxies: statistics – Hii regions – infrared: galaxies1 Introduction
Our present knowledge of the properties of starburst galaxies, and of the physical conditions in nuclei and in extranuclear Hii regions of spiral galaxies, rests on the analyses of a rather limited number of data sets. The selection criteria for the various samples necessarily introduce biases which influence the derived properties and which might explain why these studies sometimes reach conflicting results, for example on the role of the bar or of gravitational interactions in triggering starbursts. It is thus essential to multiply the observations of starburst galaxies, in order to make available the largest possible dataset for future analyses.
The goal of the present paper is to present a new sample of starburst galaxies which differs markedly in its selection from other samples. We wanted to avoid selecting small metal-poor galaxies (such as blue compact dwarfs) preferentially found in objective prism surveys, monsters (such as mergers or ultraluminous infrared galaxies) selected because of their unusual shape or luminosity, and active galaxies (such as Seyferts), which are probably related to starbursts, but should be considered separately. We thus devised selection criteria that would enable us to catch in our nets galaxies preferably resembling rather “normal” giant spiral galaxies. We believe that we have been fairly successful, and this new sample has been subjected to an extensive multifrequency analysis (Contini 1996), the results of which have been or will be reported separately (see Sect. 7).
2 The original sample
2.1 Selection criteria
We defined three criteria for selecting a sample of galaxies likely to contain the highest number of starburst galaxies. The selected galaxies must possess:
-
1.
an excess of blue and ultraviolet (UV) emission; this would indicate the presence of a large number of young and hot stars.
-
2.
A strong far-infrared (FIR) emission; interstellar dust heated by the UV radiation field from the young and hot stars is likely to give rise to such an emission.
-
3.
A barred morphology; a bar is expected to enhance the gas flow toward the center of galaxies and may provide a mechanism for triggering nuclear starbursts.
The Markarian survey contains 1500 objects selected for their excess of blue and UV emission among which about 1100 are galaxies. The catalog of Markarian galaxies is the largest sample of active galaxies known so far. The excess of blue luminosity and UV emission is the signature of either a high star formation rate or the presence of an Active Galactic Nucleus (AGN) in the central region of the galaxies. We extracted our sample from the extensive compilation of Markarian galaxies by [Mazzarella & Balzano] (1986) which lists valuable data, such as morphology, magnitude, radial velocity, radio (6, 11 and 21 cm continuum) and infrared (60 m) flux of the galaxies.
The very successful IRAS mission, which covered about 98% of the sky in four bands centered at 12, 25, 60 and 100 m has led to valuable information on the origin of the FIR radiation and its relation to the dust content of star forming regions. Interstellar dust is heated by absorption of a large fraction of UV radiation and this energy is reradiated in the FIR range. In most IRAS galaxies, the heating of interstellar dust is due to a high star formation rate and/or an AGN which provides a sufficiently strong ionizing flux to produce the observed FIR radiation. We thus selected those galaxies of the Markarian catalog which were detected by the IRAS satellite, and listed in two catalogs of IRAS sources, namely the Point Source Catalog (PSC) which contains all the bright point sources and the Faint Source Catalog (FSC) which contains fainter extended sources.
With the first two criteria (UV- and FIR-bright), we expected to select a sample of galaxies with a high proportion of starburst galaxies. Our last criterion was to select galaxies with a barred morphology, because of their peculiar dynamics. The bar is thought to enhance the flow of molecular gas toward the center of spiral galaxies where a high concentration of this gas will trigger nuclear starbursts. To select galaxies with bars, we used the morphological classifications provided by [Mazzarella & Balzano] (1986) and LEDA (Lyon-Meudon Extragalactic Database).
Finally, the combination of two activity criteria (Markarian + IRAS) and the presence of a bar defined a sample of 144 barred Markarian IRAS galaxies.
This sample differs from others used for studying the starburst phenomenon in galaxies. Indeed, many works in this field are based on samples of small irregular or blue compact dwarf galaxies like “Hii galaxies” (e.g. [Terlevich et al.] 1991), or samples of highly luminous infrared galaxies (e.g. [Veilleux et al.] 1995), or even very heterogeneous samples of galaxies of mixed types. Our sample is of course not free from selection effects; the first selection criterion excludes galaxies with little or no UV excess, the second one discriminates against weaker starbursts, with less dust and molecular gas, the third one favors late-type galaxies, and the Markarian catalogue does not contain nearby star-forming galaxies (such as M82 or NGC 253).
2.2 Global properties of the sample
The global properties of the original sample are listed in Table 1. The first column gives the number of the galaxy in the Markarian catalog. Columns 2 and 3 indicate the equatorial coordinates (equinox 1950). Cross identifications with other catalogs are given in column 4. The morphological properties of the galaxies, based on the classification system of [de Vaucouleurs et al.] (1991, RC3), are given in columns 5 to 8. Column 6 indicates if the galaxy has ring structures and column 7 if it belongs to a multiple system. The inclination and heliocentric radial velocity are given in columns 9 and 10. The apparent blue magnitude, corrected for both Galactic and internal extinction with the method of [de Vaucouleurs et al.] (1991, RC3), and the absolute blue magnitude are reported in columns 11 and 12. All the above general properties come from LEDA.
The IRAS data, reported in columns 13 to 20 of Table 1, come from the Faint Source Survey ([Bicay et al.] 1995). These data are more accurate than those from the PSC or the FSC, and represent in fact the latest version of the IRAS catalog. The flux densities (in Jy) at 12, 25, 60 and 100 m are reported in columns 14, 16, 18 and 20 respectively. A quality code is assigned to each flux density in order to evaluate the reliability of the measurements. The code value is equal to 3 if the measurement is of high quality, to 2 if the quality is moderate and to 1 if it corresponds to an upper limit (90% confidence level). No measurements of the flux density at 100 m are reported with a quality code greater than or equal to 3, because of the strong contamination by interstellar cirrus at this wavelength. Table 1 is given in electronic form only.
These data will be used in Sect. 6 to derive the general properties of the SBNGs.
3 Observations
The spectroscopic observations were obtained at the 1.93 meter telescope of Observatoire de Haute-Provence between April 1991 and January 1994. The data were acquired with the CARELEC spectrograph ([Lemaître et al.] 1990) and several types of CCD cameras (see Table 2). The spectral resolution was 260 Å/mm, which provides a spectral coverage of 3800 – 7400 Å with a resolution 15 Å. The spectra were acquired under good photometric conditions with a typical seeing between 2 and 3\arcsec.
During those nights, we also observed various spectrophotometric standard stars (see Table 2) taken from the list given by [Massey et al.] (1988), except for BD 2626 ([Oke & Gunn] 1983), in order to flux calibrate the galaxy spectra. He comparison line spectra were obtained immediately before and after the galaxy integration in order to calibrate accurately the wavelength scale. The slit was usually aligned along the bar of the galaxy. For galaxies with multiple nuclei or for pairs of galaxies, we oriented the slit in order to cover the brightest knots.
The observation log is given in Table 3, which gives for each galaxy (column 1) the date of observation (column 2), the exposure time (column 3), the spectral range (column 4), the width and position angle of the slit (columns 5 and 6). Table 3 is given in electronic form only. During the allocated telescope time, we were able to observe 105 of the 144 galaxies of the sample. The remainder of the paper is based on the data collected for these 105 galaxies.
| Observing run | CCD camera | standard | ||
|---|---|---|---|---|
| Type | Size (pixels) | pixel size | star | |
| April 1991 | RCA 3 | 323 512 | 30 m | GD140 |
| September 1991 | RCA 1 | 323 512 | 30 m | G191B2B |
| January 1992 | THX1 | 405 581 | 23 m | |
| March 1992 | TK512 | 512 512 | 27 m | BD2626 |
| Feb.-March 1993 | TK512 | 512 512 | 27 m | GD140 |
| December 1993 | TK512 | 512 512 | 27 m | Hiltner 600 |
| January 1994 | TK512 | 512 512 | 27 m | Hiltner 600 |
4 Data reduction
The spectroscopic data were reduced with the MIDAS package LONG. The spectra were flux calibrated and corrected for foreground reddening using the method described by [Contini, Davoust & Considère] (1995, hereafter paper I).
In order to extract individual spectra of all (nuclear and extranuclear) emission-line regions for each galaxy spectrum, we plotted the spatial distribution of the H emission line along the slit. We then identified distinct regions of emission and measured their dimension and position along the slit by fitting multi-Gaussian profiles to the H spatial distribution.
We extracted one-dimensional elementary spectra by adding the columns (spatial dimension) corresponding to the dimension of each emission-line region estimated above. One can note at this stage that 42 galaxies do not have any extra-nuclear emission-line region along the slit (i.e. along the bar). The elementary spectra were cleaned of radiation events (“cosmic rays”) before further analysis.
For measuring all the line parameters (fluxes, FWHM and equivalent widths), and for determining the internal reddening (), we again followed the method described in paper I. For the latter determination, we adopted Case B of Balmer decrement ((H)/(H) = 2.85) for classical Hii regions, and Case A ((H)/(H) = 3.10) for AGNs.
We also estimated the continuum flux density, , of the individual regions in three spectral bands labeled B ( = 4200 Å and = 300 Å), V ( = 5400 Å and = 300 Å) and R ( = 6800 Å and = 200 Å) very close to Johnson’s photometric system. In order to obtain the continuum values in a consistent and objective manner, we measured the spectra with an automated algorithm. We chose the wavelength range of the spectral bands in such a way as to exclude the regions containing emission lines.
The measured emission lines are given in Table 4. The galaxy Markarian number is given in column 1. The label and code for the position of the emission-line regions (1 = nuclear, 0 = extranuclear) are given in columns 2 and 3. The distance of the extranuclear regions from the nucleus, and the diameter of all regions, expressed in arcsec, are given in columns 4 and 5. The observed fluxes and equivalent widths of H, H (both corrected for Balmer absorption), [O iii]4959, [O iii]5007, [N ii]6548, [N ii]6583, [S ii]6716 and [S ii]6731 are listed in columns 6 to 21.
The continuum measurements are listed in Table 5. The galaxy Markarian number is given in column 1. The magnitudes integrated along the slit (, and ) are given in columns 3, 4 and 5, where , with in units of erg s-1 cm-2 Å-1 and in Å ([Mazzarella & Boroson] 1993). We further used the continuum magnitudes to define two color indices: and which are reported in column 6 and 7. Tables 4 and 5 are given in electronic form only.
5 Results
The characteristics of the emission-line regions and the derived spectrophotometric parameters are given in Table 6. The galaxy (Mrk) number is given in column 1. The label and code for the position of the emission-line regions (1 = nuclear, 0 = extranuclear) are repeated in columns 2 and 3. The distance of the galaxy, estimated using a Hubble constant of 75 kms-1Mpc-1, is given in column 4. The distance of the extranuclear regions from the nucleus, and the diameter of all regions, expressed in kpc, are given in columns 5 and 6. The reddening coefficient is given in column 7. The electronic density () is given in column 8. The line-intensity ratios, [N ii]6583/H, [S ii]6716,6731/H and [O iii]5007/H, used for the spectral classification and corrected both for internal reddening and for Balmer absorption, are reported in columns 9, 10 and 11, followed by the results of the spectral classification in column 12. The H flux [ in 10-14 erg s-1 cm-2] is given in column 13 and the H luminosity [) in erg s-1] in column 14. In the subsequent analysis we only take into account the H luminosities corrected for reddening, that is, those of galaxies for which we derived the reddening parameter (see Sect. 5.3). For the others, we give lower limits on the H flux and luminosity in Table 6, which is given in electronic form only.

5.1 Spectral Classification
We used diagnostic diagrams (Baldwin, Phillips & Terlevich 1981, [Veilleux & Osterbrock] 1987) for identifying the various ionization mechanisms responsible for the emission-line regions of our galaxies. In these diagrams, one can distinguish regions photoionized by hot and young stars (i.e. Hii regions) from those photoionized by a harder radiation field, such as that of an AGN or a LINER, using several ratios between low-ionization and Balmer emission lines.
At this stage, it is necessary to clarify the definition of the different types of starburst galaxies which will be mentioned in this paper. One can first separate Hii galaxies and starburst galaxies by the properties of the host galaxy. Hii galaxies are mainly metal-poor dwarf irregular or blue compact galaxies with low dust content (e.g. [French] 1980, [Keel] 1983 and [Terlevich et al.] 1991). They contain many giant Hii regions with high-excitation spectra, with properties very close to those of extragalactic giant Hii regions distributed in the disk of nearby spiral galaxies (e.g. [McCall, Rybski & Shields] 1985). Hii nucleus galaxies ([Stauffer] 1982, [Keel] 1983, [Kennicutt, Keel & Blaha] 1989, [Ho, Filippenko & Sargent] 1997a) and Starburst Nucleus Galaxies (SBNGs; [Balzano] 1983, [Coziol et al.] 1994) are defined as galaxies with Hii regions in their nuclei. They are more massive and chemically evolved spiral galaxies, with a large population of old and evolved stars and a huge quantity of dust ([Coziol] 1996). The low-excitation spectra of SBNGs reflect the higher metallicity observed in spiral galaxies, and especially in their nucleus, when compared to irregular or compact Hii galaxies. A last distinction is made between Hii nuclei and SBNGs on the basis of their nuclear H luminosity, Hii nuclei being fainter (L(H) erg s-1) than SBNGs. In terms of star formation, Hii nuclei represent the low-luminosity end of SBNGs ([Coziol] 1996).
The results of our spectrophotometric analysis are displayed in Fig. 1 which shows the location of the emission-line regions in two diagnostic diagrams of [Veilleux & Osterbrock] (1987). In each diagram, the continuous curve, empirically derived by [Veilleux & Osterbrock] (1987), separates starburst nuclei and Hii regions where the gas is assumed to be ionized by young stars, from AGNs where the main ionizing source is thought to be an accretion disk around a black hole (e.g. [Rees] 1984) which produces a power law spectrum. We make a further distinction among AGNs between objects of high ([O iii]/H 3) and low ([O iii]/H 3) excitation (horizontal line, [Shuder & Osterbrock] 1981). The first group represents the classical Seyfert 2 galaxies while the LINERs fall in the second group. We did not use the original criteria for defining a LINER ([Heckman] 1980) because measurements of [O i]6300 and [O ii]3727 were often not available. For the same reason, we did not make use of the [O i]6300/H ratio to distinguish between the different sources of ionization.
| Spectral Typea | Emission line region | Total | ||
|---|---|---|---|---|
| Nuclear | Extranuclear | |||
| Hii | 70 (67%) | 81 (69%) | 151 (68%) | |
| SBNG | 65 (62%) | … | … | |
| HiiG | 5 (5%) | … | … | |
| AGN | 20 (19%) | … | 20 (9%) | |
| Sey 1 | 12 (11%) | … | … | |
| Sey 2 | 8 (8%) | … | … | |
| Hii, LINER? | 11 (10%) | 8 (7%) | 19 (9%) | |
| Uncertain | 4 (4%) | 27 (24%) | 31 (14%) | |
| Total | 105 (100%) | 116 (100%) | 221 (100%) | |
| a SBNG = Starburst Nucleus Galaxy; HiiG = Hii galaxy; Hii, LINER? = ambiguous classification between Hii and LINER (see text for details); Uncertain = classification based on only one emission line ratio ([N ii]/H or [S ii]/H) | ||||
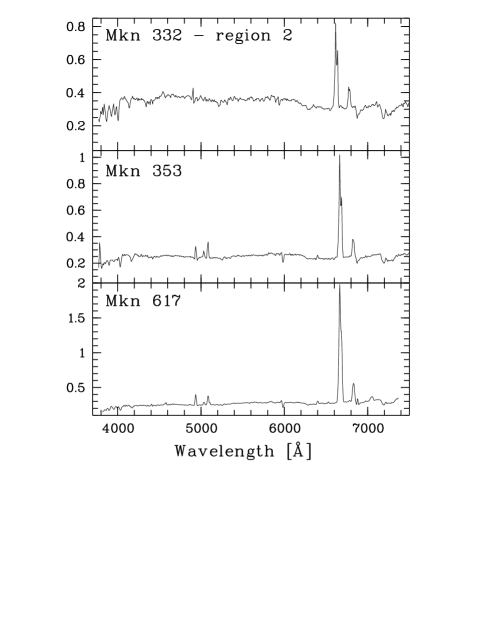
One should note that the classification process is not always unambiguous, for at least two reasons. First, the two conditions involving the low-ionization lines ([N ii] and [S ii]) do not always hold simultaneously. This reflects the empirical nature of the diagnostic diagrams as well as the possibility that one line ratio is enhanced or depressed with respect to the other one as a result of, for instance, selective abundance variations (see Sect. 5.5.2). Second, large measurement uncertainties may be associated with any given line intensity ratio. Thus, one should evaluate each object individually, taking all of these factors into consideration, before a classification can be assigned to it. When more than one classification is consistent with the data, both are given, with the more likely one listed first (column 12 of Table 6). An ambiguous spectral classification (between Hii and LINER) arises for 11 nuclear (Mrk 90, 271, 332, 353, 593, 617, 874, 1180, 1200, 1291 and 1485) and 8 extranuclear (Mrk 712-3, 814-1, 814-4, 1086-3, 1302-1, 1363-1, 1363-3 and 1433-3) regions.
The result of the spectral classification is summarized in Table 7. We found that 70 nuclear regions (67% of the sample) have spectra characteristic of photoionization by hot stars, i.e. are classified as starburst nuclei (62%) or Hii galaxy (5%). Four galaxies (Mrk 21, 271, 446 and 1452) were classified as SBNGs using only one emission-line ratio ([N ii]/H or [S ii]/H), their classification is thus rather uncertain. AGN emission lines were observed in 20 nuclei (19%) including 12 Seyfert 1 galaxies (11%) and 8 Seyfert 2 galaxies (8%). Among the 116 extranuclear regions, 81 (69%) are Hii regions. Here, the classification is uncertain for 27 regions (24%) and ambiguous between Hii and LINER for 8 regions (7%) for the same reason as explained above.

5.2 Colors
We corrected for reddening the spectral continuum colors and of the individual regions using the reddening coefficient and assuming that the interstellar extinction applies in the same way for the stellar population and the ionized gas in emission-lines regions.
A color-color diagram with the dereddened color indices and is shown in Fig. 7. The extranuclear Hii regions and starburst nuclei are well mixed in this diagram, indicating identical stellar populations born during the same star formation episode. We first compare the colors of these starburst regions to the total color indices of “normal” galaxies. It comes as no surprise that they are much bluer than quiescent galaxies whose position is indicated by the dotted rectangle in Fig. 7; the vast majority of our starburst regions are located outside this rectangle traced by about 500 normal galaxies ([Buta & Williams] 1995). We then use the predictions of stellar population synthesis models of [Leitherer & Heckman] (1995) to estimate the age of the stellar population which dominates the spectral continuum of these starburst regions. It appears clearly that the colors observed in the star-forming regions are well fitted by a very young stellar population with an age lower than 50 Myr.

5.3 Reddening
The distribution of reddening () in the different emission-line regions is given in column 7 of Table 6 and shown in Fig. 8a. The amount of reddening is larger in starburst nuclei ( = 0.810.38) than in extranuclear Hii regions (0.610.28). When compared to other samples of starburst galaxies, the mean extinction coefficient derived in our sample is slightly larger than in nearby Hii nuclei ( 0.42, [Ho, Filippenko & Sargent] 1997a) and disk Hii regions ( 0.29, [Kennicutt, Keel & Blaha] 1989) but low compared to a sample of luminous infrared starburst galaxies ( 0.99, [Veilleux et al.] 1995).
The amount of reddening has not been estimated for 13 nuclear and 35 extranuclear emission-line regions because of the weakness or absence of H emission in their spectra. In all these objects we detect a relatively strong H emission; they are thus probably highly obscured. Note that in a few objects (nucleus of Mrk 52, extranuclear regions of Mrk 489 and 712), the observed Balmer decrement is significantly less than the theoretical value; we assigned an internal extinction of zero to these objects.

5.4 Electron density
We derived the electron density () from the reddening-corrected [S ii]6716/[S ii]6731 line ratio using the analytical relation given by [Osterbrock] (1989). A 20% uncertainty in the [S ii]6716/[S ii]6731 flux ratio corresponds to an uncertainty of about 100 cm-3 in the determination of .
Figure 8b shows the distribution of the electron densities for the different emission-line regions. The mean value of the electron density is nearly the same for nuclear starbursts (560240 cm-3) and extranuclear Hii regions (770500 cm-3). These mean values are higher than those derived for nearby Hii nuclei (180200 cm-3, [Ho, Filippenko & Sargent] 1997a), disk Hii regions ( 140 cm-3, [Kennicutt, Keel & Blaha] 1989) and luminous infrared starburst galaxies ( 280 cm-3, [Veilleux et al.] 1995).
5.5 Line-intensity ratios
5.5.1 [O iii]/H as an excitation parameter
Two types of starburst galaxies can be distinguished based on their level of excitation: SBNGs show low-excitation spectra ([O iii]/H 3, see Fig. 2) whereas Hii galaxies show high-excitation spectra ([O iii]/H 3, see Fig. 3).
A quick inspection of Fig. 1 indicates that the upper left region of the diagnostic diagrams contains only a few data points, reflecting the fact that essentially all the emission-line regions classified as starbursts have a relatively low excitation level ([O iii]/H 3). This is to be contrasted with Figs. 1–3 of [Veilleux & Osterbrock] (1987) where this region of the diagrams is populated with extranuclear Hii regions and the low-metallicity Hii galaxies from the sample of [French] (1980).
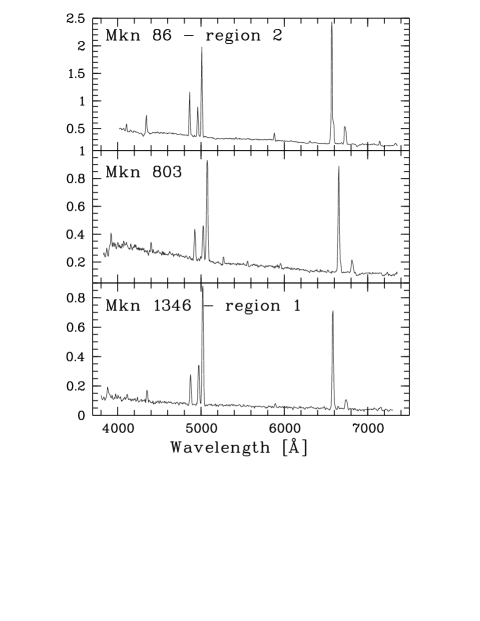
The distribution of the excitation parameter is shown in Fig. 8c. Our sample is obviously deficient in Hii galaxies, since only five starburst galaxies (Mrk 86, 412, 803, 860 and 1346) have an excitation parameter [O iii]/H 3. The properties of these galaxies (listed in Table 1) indicate that they are mainly small, irregular and low-mass galaxies with a low dust content, confirming the general trend of this class of starburst galaxies ([Coziol] 1996). Our sample thus contains a vast majority of starburst nuclei located in more massive and chemically evolved galaxies than Hii galaxies because of their higher frequency of past bursts of star formation ([Coziol] 1996). Note however that SBNGs are still in the process of formation because of their lower metal content compared to “normal” spiral galaxies ([Coziol et al.] 1997a). Figure 8c also shows that the mean excitation parameter is slightly higher in extranuclear Hii regions ([O iii]/H 0.72) than in starburst nuclei ([O iii]/H 0.50), reflecting the negative abundance gradient from the nucleus to the outer parts of spiral galaxies.

Three Wolf-Rayet galaxies are present in our sample. The optical spectrum of this subset of starburst galaxies shows broad emission lines from Wolf-Rayet stars around 4700 Å, the brightest line being He ii4686. While Mrk 52 and Mrk 710 were already known Wolf-Rayet galaxies and included in the catalog of [Conti] (1991), a new one, Mrk 712, was discovered in the sample (paper I).
5.5.2 Excess of [N ii]/H in starburst nuclei
Excess emission of [N ii] has been reported in samples of emission line galaxies, such as SBNGs ([Coziol et al.] 1997b) or Hii nuclei ([Ho, Filippenko & Sargent] 1997a) with a mean ratio of ([N ii]/H) 0.2 to 0.3 dex higher than the mean ratio observed in disk Hii regions or predicted by normal Hii regions models (e.g. [McCall, Rybski & Shields] 1985).
In the diagnostic diagram of Fig. 1a, one can see that, for a given excitation parameter, our nuclear starbursts tend to have stronger [N ii]6583 emission than extranuclear Hii regions, but the difference is rather small ( 0.1 dex) compared to other samples of starburst nuclei cited above.
This excess of nitrogen emission was first noted by [Stauffer] (1982) in the nuclei of “normal” galaxies and confirmed later in a sample of “Hii region-like” nuclei by [Kennicutt, Keel & Blaha] (1989) who proposed the presence of a hidden weak AGN to account for this excess of low-ionisation emission line. AGNs indeed produce a harder ionizing radiation field than young O- or B-type stars. These high-energy photons create an extensive partially ionized zone from which low-ionization emission lines, such as [N ii], [S ii] and [O i] originate.
To be sure that no hidden AGN is located in the starburst nuclei of our sample, we compare in Fig. 9 two ratios of low-excitation emission lines, that of [S ii]/H and that of [N ii]/H. In the presence of a harder ionizing spectrum, both ratios should increase and a correlation would appear. One can clearly see that there is no such relation between the two ratios, neither for the nuclear starbursts nor for the extranuclear ones, which are well mixed in this diagram. In fact, the mean value of [S ii]/H is nearly identical for starburst nuclei ( 0.20) and extranuclear Hii regions ( 0.21). The presence of a weak AGN in the nuclei of our starburst galaxies is also excluded because of the weakness of [O i]6300 in their spectrum: only 25% of our nuclear spectra show this emission line with intensities similar to those observed in normal Hii regions ([Veilleux & Osterbrock] 1987).
Alternative explanations, like collisional excitation by shocks ([Kennicutt, Keel & Blaha] 1989) or very hot O type stars in metal-rich environments ([Fillipenko & Terlevich] 1992, [Shields] 1992), have been suggested as ionization sources to account for the excess of nitrogen emission in galactic nuclei. However, both suggestions fail to reproduce our observations, because they also imply an increase of other low-ionization emission lines like [S ii] and [O i].
We have investigated whether the impact of dust on the thermal properties of Hii regions would provide a better explanation. The dust content in our sample is not negligible since all our galaxies are IRAS sources (one of our selection criteria). Calculations by [Shields & Kennicutt] (1995) indicate that the influence of dust on the emergent optical spectrum of Hii regions can be quite appreciable in high-metallicity () environments, as is the case in many galactic nuclei. In Fig. 1, we compare our data to the results of the photoionization model of [Shields & Kennicutt] (1995) which incorporates the effects of dust and is calculated for a stellar effective temperature of 45 000 K. The predicted line strengths do not provide a good match for all the observations in our starburst nuclei. The model accounts reasonably well for the [N ii]/H ratios observed in high metallicity ([O iii]/H 0.5) nuclei and for regions very close to the transition limit between Hii and LINERs, but this appears to be accidental, since the predicted [S ii]/H ratio does not match our observations. These theoretical results might simply be the consequence of the selective initial element abundances, since [Shields & Kennicutt] (1995) arbitrarily assumed an enhancement of nitrogen abundance, with a secondary component scaling as , while other elements are in solar proportions. The results of the photoionization model of [Shields & Kennicutt] (1995) might thus follow from this selective abondance introduced ad hoc in the model.

An enhancement of nitrogen in starburst nuclei is certainly the most reliable explanation to account for the moderate excess of nitrogen emission in our sample of galaxies. Such selective chemical enrichment of nitrogen has been observed in the interstellar medium of some nearby starburst galaxies, like NGC 5253 ([Walsh & Roy] 1989, [Kobulnicky et al.]1997) where N-enriched regions are found in the vicinity of young starbursts with a large population of massive Wolf-Rayet stars ([Schaerer et al.]1997). Moreover, chemical evolution models of galaxies (e.g. [Marconi, Matteucci & Tosi] 1994) predict an enhancement of nitrogen abundance after a succession of short and intense bursts of star formation, which has certainly been the case in starburst nuclei ([Coziol] 1996).
6 Global properties of SBNGs
6.1 Morphological types, distances, magnitudes and environment
The global properties of our sample of SBNGs are displayed in Fig. 10, which presents the distribution of morphological types (according to RC3), inclinations, heliocentric radial velocities, distances, blue apparent and absolute magnitudes of the galaxies, using the values tabulated in Tables 1 and 4. In these diagrams, we show the global properties of SBNGs after removing the five Hii galaxies and galaxies with ambiguous nuclear spectral classification. The global properties of AGNs (Seyfert 1 and 2, LINERs) are also shown for comparison.
The mean inclination of the galaxies is 45 \degr16, both for SBNGs and AGNs. This value is comparable to that derived for barred galaxies with Hii nuclei ([Ho, Filippenko & Sargent] 1997b). The heliocentric radial velocity of SBNGs is predominantly ( 93%) lower than or equal to 10,000 km s-1 with mean values around 4300 and 7000 km s-1 for SBNGs and AGNs respectively. The SBNGs are located at a mean distance of 6838 Mpc, slightly farther than nearby Hii nuclei ( 22 Mpc; [Ho, Filippenko & Sargent] 1997b). The mean distance derived for the AGNs is 10750 Mpc. The mean value of the apparent blue magnitude is 14, with a large proportion ( 90%) of giant spiral galaxies (Mabs ). The mean value of the absolute magnitude () is identical for our sample of SBNGs and for nearby Hii nuclei ([Ho, Filippenko & Sargent] 1997b).
The SBNGs are equally distributed among early-type (S0-a to Sb; 55%) and late-type (Sbc to Sm; 42%) galaxies with only 3% elliptical galaxies as is expected in a sample of starburst galaxies. In fact, the proportion of SBNGs increases with the morphological type and reaches a maximum of 40% for Sbc/Sc galaxies. The distribution of AGNs is on the contrary more uniform from S0 to Sc. One can also note the deficiency of SBNGs with morphological types later than Sc, which confirms the low contamination of our sample by low-luminosity blue compact and irregular Hii galaxies.
Coziol, Barth & Demers (1995) found a majority of early-type galaxies among their sample of SBNGs, but this result should be considered with caution because only 39% of their galaxies are morphologically classified. On the contrary, [Ho, Filippenko & Sargent] (1997b) found a majority of late-type galaxies (62% of Sc-Sm) among their sample of Hii nuclei. They note however that this effect is pronounced in barred galaxies (65%) whereas unbarred galaxies with Hii nuclei are equally divided between early and late types. This may explain the relatively high frequency of Sc galaxies found in our sample of SBNGs since all our galaxies are barred.

One of the most popular ideas for explaining powerful starbursts is that they must occur preferentially within galaxies undergoing gravitational interactions. We thus performed an analysis of environment and level of interaction for all our galaxies using CCD images ([Contini] 1996). We found that the majority (62%) of SBNGs are isolated galaxies. Only two galaxies (Mrk 617 and 960) are advanced mergers, 6% of the galaxies belong to close pairs (projected distance 1\arcmin) and 23% to wide pairs (projected distance 15\arcmin and 300 km s-1). More than half of the SBNGs do not show any sign of past or present gravitational interaction. Asymmetries in the bar or spiral arms are observed in only 32% of the galaxies; among them, 12% have multiple bright knots along the bar. This does not indicate that bars are necessary for triggering starbursts in the absence of interactions; other samples of (barred and unbarred) SBNGs ([Coziol et al.] 1997b) and Hii galaxies ([Telles & Terlevich] 1995) have also been found to contain a low proportion ( 20 to 25%) of interacting galaxies. Interactions are more frequent among luminous infrared galaxies. The level of interactions increases with the FIR luminosity, the proportion of mergers reaching a maximum among ultra-luminous infrared galaxies ([Veilleux et al.] 1995).
6.2 H luminosity

In this section and the next, we compare the distribution of the H and FIR luminosities of our sample of SBNGs with those derived for other samples of starburst galaxies. A more detailed and quantitative discussion on the relation between H, blue and FIR luminosities, and on the distribution of H equivalent widths in terms of star formation history and age of the starbursts is given in Contini, Considère & Davoust (in preparation).
It appears clearly in Fig. 11a that the average H luminosity [log(L(H)/erg s-1)] is higher (by a factor 10) in starburst nuclei (41.00.7) than in extranuclear Hii regions (40.20.6). However, the H luminosity of the Hii regions, which are mainly located along the bar of our galaxies, is higher than that of typical disk Hii regions (39.5; [Kennicutt, Keel & Blaha] 1989). The H luminosities estimated in our starburst nuclei are typical of starburst galaxies (40.7; [Balzano] 1983). They are clearly higher than in nearby Hii nuclei (39.2; [Ho, Filippenko & Sargent] 1997a) but slightly lower than in starbursts in luminous infrared galaxies (42.0; [Veilleux et al.] 1995). Contrary to what occurs in nearby Hii nuclei ([Ho, Filippenko & Sargent] 1997a), we do not find any significant difference between the total H luminosities of early-type (41.30.4) and late-type (41.00.7) SBNGs.
In terms of H luminosity, our sample of SBNGs is thus intermediate between nearby Hii nuclei and luminous infrared galaxies. These luminosities are typical of starburst galaxies and comparable to other samples of SBNGs (i.e. [Coziol et al.] 1994).
As shown in Fig. 11b, the total (nuclear and extranuclear) H luminosity derived for SBNGs (41.20.6) is slightly lower than that derived for AGNs (41.7 0.5). These luminosities are very close to those observed in other samples of Seyfert galaxies ( 42.0; [Dahari & De Robertis] 1988, [Veilleux et al.] 1995).
6.3 FIR properties
We computed the FIR luminosities of the galaxies from the IRAS flux densities at 60 and 100 m (Table 1) using the following relation which approximates well the total FIR luminosity between 42 and 122 m ([Helou et al.] 1988)
| (1) |
where the flux densities at 60 and 100 m are expressed in Janskys, is the distance of the galaxy in Mpc and is the FIR luminosity in solar units.
The distribution of FIR luminosities [log(LFIR/L⊙)] is shown in Fig. 12a. Our sample of SBNGs has moderate FIR luminosities (10.10.5), slightly higher than those observed in samples of Hii nuclei ( 9.4) and Hii galaxies ( 8.9), similar to other samples of SBNGs ( 9.9) (see [Coziol] 1996 and references therein) but rather low compared to samples of luminous ( 11) or ultra-luminous ( 12) infrared galaxies ([Veilleux et al.] 1995). There is no significant difference between the average FIR luminosity of the SBNGs and AGNs (10.40.4). The AGNs in our sample follow the trend observed in infrared-bright galaxies, their proportion increases with FIR luminosity and reaches a maximum of 62% for ([Veilleux et al.] 1995).
We did not use the fluxes at 12 and 25 m to compute the FIR luminosities, because of the strong contribution of non-thermal radiation to dust heating at these wavelengths. This well-known phenomenon (e.g. [Miley, Neugebauer & Soifer] 1985, [de Grijp et al.] 1985) is illustrated in Figs. 12c,d where we show the distribution of the two IRAS colors, and , for both SBNGs and AGNs. While no difference is seen in the distribution of (mean value 0.55) for AGNs and starburst galaxies, a clear excess of emission at 25 m is observed for AGNs [] when compared to SBNGs []. This indicates that the infrared emission at short wavelengths (12 and 25 m) is mainly due to a “warm dust” component heated by the non-thermal ionizing radiation from AGNs. Figure 12b also shows that, regardless of the spectral classification, there is a clear tendency for galaxies with “warmer” 60/100 colors to have “cooler” 12/25 colors, illustrating the need for a multicomponent model to describe the nature of IRAS infrared emission (e.g. [Helou] 1986). Such a model requires the presence of a “warm dust” component of infrared emission associated with star formation regions, and a “cool dust” component associated with the neutral interstellar medium.
7 Summary and conclusion
We presented optical long-slit spectroscopic observations of 105 barred Markarian IRAS galaxies. These observations were mainly used to assign a spectral type (nuclear starburst, Hii region, Seyfert 1 or 2) to each emission-line region along the slit, and to define a homogeneous sample of starburst nuclei and extranuclear Hii regions.
Our selection criteria (UV excess, FIR emission and barred morphology) have been very efficient for selecting star-forming galaxies, since our sample of 221 emission-line regions includes 82% nuclear or extranuclear starbursts. The contamination by AGNs is low (9%), with 13 Seyfert 1 and 8 Seyfert 2 nuclei. The remainder are objects with ambiguous classification between Hii and LINER.
Our sample of star-forming galaxies contains only 5 Hii galaxies, characterized by a high excitation parameter, equivalent to a low metallicity. In fact, our sample is strongly biased towards energetic starbursts located in the nuclear or extranuclear regions of more massive and chemically evolved galaxies than Hii galaxies. Three Wolf-Rayet galaxies (Mrk 52, 710 and 712) are also included in our sample.
We first compared the physical properties of the starburst nuclei to those of extranuclear Hii regions distributed along the bar and to those of typical disk Hii regions ([Kennicutt, Keel & Blaha] 1989). The amount of reddening, and hence the dust content, increases towards the nucleus of the galaxy. The same trend is also observed for the H luminosity; the highest star formation rates are observed in the nuclei of the galaxies. We also found that the mean H luminosity of the bar Hii regions is higher than that of typical disk Hii regions, probably because we are dealing with starburst galaxies. We did not observe any significant variation of the electron density in the nuclei and bar Hii regions, but the measured values are higher (by a factor of about 3) than in typical disk Hii regions. The excitation parameter, [O iii]/H, generally decreases from the center outwards, reflecting the negative metallicity gradient observed in barred (Considère, Contini & Davoust, in preparation) and ordinary spiral galaxies.
We investigated different mechanisms for explaining the excess of nitrogen emission observed in starburst nuclei, which however is low compared to that estimated in nearby Hii nuclei and other SBNGs. There is no evidence for the presence of a weak hidden AGN in the nuclei of our starburst galaxies, as suggested by [Kennicutt, Keel & Blaha] (1989) for explaining the excess of nitrogen in other samples of such galaxies. The most likely explanation is a selective enrichment of nitrogen in the nuclei of galaxies, following a succession of short and intense bursts of star formation.
The properties of our sample of SBNGs are very much like those of other samples of SBNGs ([Coziol et al.]1997b) and starburst galaxies ([Balzano] 1983) located at a redshift of 0.01 – 0.02 and with nearly the same H and FIR luminosities. The host galaxies are distributed equally among early- and late-type giant spirals with a slight preference for Sbc/Sc types in our sample, a selection effect caused by the presence of a bar. The majority of SBNGs are isolated with no sign of gravitational interaction, contrary to the opinion that starbursts in massive galaxies are produced by gravitational interactions. This result suggests that, in the majority of spiral galaxies, bursts of star formation may depend on internal mechanisms, rather than on gravitational interactions.
SBNGs are intermediate between low-mass irregular Hii galaxies ([Terlevich et al.] 1991) or nearby Hii nuclei ([Ho, Filippenko & Sargent] 1997a) and luminous or ultra-luminous infrared galaxies ([Veilleux et al.] 1995). The former are closer and intrinsicaly less luminous in H and in the FIR whereas the latter are farther and more luminous, both in H and FIR, with a high proportion of interacting galaxies.
This spectrophotometric dataset on starbursts has been used to determine the age and star formation rate of the starbursts (Contini, Davoust & Considère, in preparation) and, together with millimetric observations of the molecular gas, to establish the presence of molecular gas outflows in the nuclei of barred starburst galaxies ([Contini et al.]1997a). New spectrophotometric observations of a subset of this sample, with better signal-to-noise ratio and including the [O ii]3727 emission line, have been used to derive the metallicity of the nebular gas and its gradient along the bar of the galaxies (Considère, Contini & Davoust, in preparation), and have revealed yet another Wolf-Rayet galaxy.
The detailed spectroscopic analysis of some galaxies of the sample (Mrk 710, 712 and 799), combined with CCD imaging and observations of molecular clouds and atomic hydrogen has given rise to new results concerning the population of massive stars and the starburst properties in Wolf-Rayet galaxies ([Contini et al.]1997b). The analysis of the optical and CO velocity fields of Mrk 799 is in progress.
The link between the morphological and dynamical parameters of the bar (bar strength and relative length) and the starburst activity in the center of barred spiral galaxies has been investigated by Chapelon, Contini & Davoust (in preparation).
Finally, our data have been used together with another sample of starburst galaxies to shed new light on the formation and chemical evolution of galaxies, by showing that SBNGs are still in the process of formation because of their underabundance in oxygen with respect to “normal” spiral galaxies ([Coziol et al.]1997a).
Acknowledgements.
Data from the literature were obtained with the Lyon Meudon Extragalactic database (LEDA), supplied by the LEDA team at CRAL-Observatoire de Lyon (France). We thank Roger Coziol for helpful comments on the manuscript and the staff of Observatoire de Haute-Provence for assistance at the telescope.References
- [Baldwin, Phillips & Terlevich] Baldwin J.A., Phillips M.M., Terlevich R., 1981, PASP 93, 5
- [Balzano] Balzano V.A., 1983, ApJ 268. 602
- [Bicay et al. ] Bicay M.D., Kojoian G., Seal J., Dickinson D.F., Malkan M.A. 1995, ApJ 98, 369
- [Buta & Williams] Buta R., Williams K.L., 1995, AJ 109, 543
- [Conti] Conti P.S., 1991, ApJ 377, 115
- [Contini] Contini T., 1996, Ph.D. thesis, Université Paul Sabatier, Toulouse, France
- [Contini, Davoust & Considère] Contini T., Davoust E., Considère S., 1995, A&A 303, 440 (paper I)
- [Contini et al. ] Contini T., Wozniak H., Considère S., Davoust E., 1997a, A&A 318, L51
- [Contini et al. ] Contini T., Wozniak H., Considère S., Davoust E., 1997b, A&A 324, 41 (paper II)
- [Coziol] Coziol R., 1996, A&A 309, 345
- [Coziol, Barth & Demers] Coziol R., Barth C.S., Demers S., 1995, MNRAS 276, 1245
- [Coziol et al. ] Coziol R., Contini T., Davoust E., Considère S., 1997a, ApJ 481, L67
- [Coziol et al. ] Coziol R., Demers S., Barnéoud R., Peña M., 1997b, AJ 113, 1548
- [Coziol et al. ] Coziol R., Demers S., Peña M., Barnéoud R., 1994, AJ 108, 405
- [Dahari & De Robertis] Dahari O., De Robertis M.M., 1988, ApJS 67, 249
- [de Grijp et al. ] de Grijp M.H.K., Miley G.K., Lub J., de Jong T., 1985, Nature 314, 240
- [de Vaucouleurs et al. ] de Vaucouleurs G., de Vaucouleurs A., Corwin H.G., Buta R.J., Paturel G., Fouqué P., 1991, Third Reference Catalog of Bright Galaxies, New-York, Springer-Verlag
- [Fillipenko & Terlevich] Filippenko A.V., Terlevich R., 1992, ApJ 397, L79
- [French] French H.B., 1980, ApJ 240, 41
- [Heckman] Heckman T.M., 1980, A&A 87, 142
- [Helou] Helou G., 1986, ApJ 311, L33
- [Helou et al. ] Helou G., Khan I.R., Malek L., Boehmer L., 1988, ApJS 68, 151
- [Ho, Filippenko & Sargent] Ho L.C., Filippenko A.V., Sargent W.L.W., 1997a, ApJ 487, 579
- [Ho, Filippenko & Sargent] Ho L.C., Filippenko A.V., Sargent W.L.W., 1997b, ApJ 487, 591
- [Keel] Keel W.C., 1983, ApJ 296, 466
- [Kennicutt, Keel & Blaha] Kennicutt R.C, Keel W.C., Blaha C.A., 1989, AJ 97, 1022
- [Kobulnicky et al. ] Kobulnicky H.A., Skillman E.D., Roy J-R., Walsh J.R., Rosa M.R., 1997, ApJ 477, 679
- [Leitherer & Heckman] Leitherer C., Heckman T.M., 1995, ApJS 96, 9
- [Lemaître et al. ] Lemaître G., Kohler D., Lacroix D., Meunier J-P., Vin A., 1990, A&A 228, 540
- [Marconi, Matteucci & Tosi] Marconi G., Matteucci F., Tosi M., 1994, MNRAS 270, 35
- [Massey et al. ] Massey P., Strobel K., Barnes J.V., Anderson E., 1988, ApJ 328, 315
- [Mazzarella & Balzano] Mazzarella J.M., Balzano V., 1986, ApJS 62, 751
- [Mazzarella & Boroson] Mazzarella J.M., Boroson T.A., 1993, ApJS 85, 27
- [McCall, Rybski & Shields] McCall M.L., Rybski P.M., Shields G.A., 1985, ApJS 57, 1
- [Miley, Neugebauer & Soifer] Miley G.K., Neugebauer G., Soifer B.T., 1985, ApJ 293, L11
- [Oke & Gunn] Oke J.B., Gunn J.E., 1983, ApJ 266, 713
- [Osterbrock] Osterbrock D.E., 1989, Astrophysics of Gaseous Nebulae and Active Galactic Nuclei. University Science Books, Mill Valley
- [Rees] Rees M.J., 1984, ARA&A 22, 471
- [Schaerer et al. ] Schaerer D., Contini T., Kunth D., Meynet G., 1997, ApJ 481, L75
- [Shields] Shields J.C., 1992, ApJ 399, L27
- [Shields & Kennicutt] Shields J.C., Kennicutt R.C., 1995, ApJ 454, 807
- [Shuder & Osterbrock] Shuder J.M., Osterbrock D.E., 1981, ApJ 250, 55
- [Stauffer] Stauffer J.P., 1982, ApJS 50, 517
- [Telles & Terlevich] Telles E., Terlevich R., 1995, MNRAS 275, 1
- [Terlevich et al. ] Terlevich R., Melnick J., Masegosa J., Moles M., Copetti M.V.F., 1991, A&AS 91, 285
- [Veilleux et al. ] Veilleux S., Kim D-C., Sanders D.B., Mazzarella J.M., Soifer B.T., 1995, ApJS 98, 171
- [Veilleux & Osterbrock] Veilleux S., Osterbrock D.E., 1987, ApJS 63, 295
- [Walsh & Roy] Walsh J.R., Roy J-R., 1989, MNRAS 239, 297