COMPTEL OBSERVATIONS OF 3C 279 DURING THE FIRST 4 YEARS OF THE
CGRO-MISSION
W. Collmar1, J. J. Blom2, K. Bennett4, H. Bloemen2, W. Hermsen2, J. Ryan3, V. Schönfelder1, J. G. Stacy3, O. R. Williams4
1Max-Planck-Institut für extraterrestrische Physik,
P.O. Box 1603, 85740 Garching, F.R.G.
2SRON-Utrecht, Sorbonnelaan 2, 3584 CA Utrecht, The Netherlands
3University of New Hampshire, ISEOS, Durham NH 03824, USA
4Astrophysics Division, ESA/ESTEC, NL-2200 AG Noordwijk, The Netherlands
ABSTRACT
The COMPTEL experiment aboard the Compton Gamma-Ray Observatory (CGRO) has
observed the gamma-ray blazar 3C 279 several times between April 1991 and
September 1995. This paper reports on a consistent analysis of these
observations using the most recent COMPTEL data analysis tools.
Detections and non-detections of 3C 279 along
the CGRO-mission indicate a time-variable MeV-flux. Spectral variability is
indicated as well, however can not be significantly proven by spectral
fitting. The average MeV-spectrum of 3C 279, as measured by COMPTEL over the
four-year period, is consistent with
a photon power-law slope of -1.9. This spectrum smoothly connects to the simultaneous 30 MeV to 10 GeV spectrum obtained from an analysis of
combined EGRET observations. No spectral break is
required to fit the MeV- to GeV-spectrum of 3C 279.
1 INTRODUCTION
Shortly after the launch of the Compton Gamma-Ray Observatory (CGRO), the blazar-type quasar 3C 279 was detected as an emitter of -rays (mainly above 100 MeV) by the EGRET experiment aboard CGRO (Kniffen et al. 1993). This detection stimulated a search for 3C 279 in the contemporaneous COMPTEL data (for an instrument decription see Schönfelder et al. 1993) between 0.75 and 30 MeV, which led to the discovery of 3C 279 at MeV-energies as well (Hermsen et al. 1993, Williams et al. 1995). 3C 279 was redected by COMPTEL roughly two years later (Collmar et al. 1995).
Because only parts of the COMPTEL Virgo observations had been analysed in detail, we have started to consistently analyse all of them with emphasis on 3C 279 by applying the most recent COMPTEL analysis techniques and tools. The main objective is to study the MeV-properties of this blazar systematically, and compare them to results in neighbouring energy bands (mainly EGRET). It is known that the MeV-band is an interesting region for blazar spectra (e.g. maximum energy release, spectral breaks) from which insights in the physical emission mechanisms might be derived. In this paper we shall report first results of these analyses covering the time period between April ’91 and September ’95, which corresponds to the Phases I, II, III, and Cycle IV of the CGRO observations.
2 OBSERVATIONS
Between April ’91 and September ’95 COMPTEL was pointed towards the Virgo region of the sky several times. All observations for which 3C 279 was within 25oof the pointing direction have been included in our analysis resulting in a total (uncorrected) observation time of 136 days, which converts to an effective observation time (including efficiency corrections and data losses) of 40 days. Table 1 gives the relevant dates of the different CGRO viewing periods (VPs).
| VP | Obs. Time | Dur. | Separ. | CGRO Phase |
|---|---|---|---|---|
| # | yy/mm/dd - yy/mm/dd | [days] | ||
| 3 | 91/06/15 - 91/06/28 | 13 | 8.8 | I |
| 11 | 91/10/03 - 91/10/17 | 14 | 8.5 | I |
| 204 - 206 | 92/12/22 - 93/01/12 | 21 | 7.2 | II |
| 304 - 306 | 93/10/19 - 93/11/09 | 21 | 14 | III |
| 307 - 308.6 | 93/11/09 - 93/12/01 | 11 | 19.5 | III |
| 311 - 313 | 93/12/13 - 94/01/03 | 17 | 19 | III |
| 405 - 408 | 94/11/29 - 95/01/10 | 32 | 7 | IV |
3 DATA ANALYSIS
We have applied the standard COMPTEL maximum-likelihood analysis method (e.g. de Boer et al. 1992) to derive detection significances, fluxes, and flux errors of -ray sources in the four standard COMPTEL energy bands (0.75-1 MeV, 1-3 MeV, 3-10 MeV, 10-30 MeV), and a background modelling technique which eliminates any source signature but preserves the general background structure (Bloemen et al. 1994). To derive source fluxes, we fitted 3C 279 simultaneously with further known -ray sources of the Virgo region (e.g. 3C 273) in an iterative procedure. This iterative approach leads to a simultaneous determination of the fluxes of several potential sources and a background model which takes into account the presence of sources.
4 RESULTS
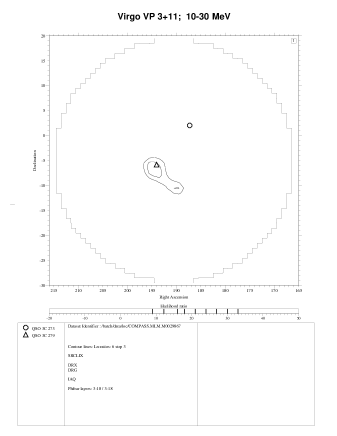
COMPTEL has significantly (3 ) detected 3C 279 at the beginning of its mission (Figure 1) mainly at energies above 3 MeV. The source was not detected during the 3 observational weeks on Virgo (VPs 204 - 206) in CGRO Phase II, but was redetected in Phase III (Figure 1). In contrast to Phase I, a significant detection is derived in the 1-3 MeV band only. Roughly one year later in CGRO Phase IV, 3C 279 was again invisible for COMPTEL during an observation of 4.5 weeks.


This behaviour is illustrated by the long-term lightcurves of the quasar. The fluxes and upper limits of the COMPTEL 1-3 MeV and 10-30 MeV bands for different observational periods are shown in Figure 2. In the 10-30 MeV band positive flux values are mainly observed during Phase I, in the 1-3 MeV band however, mainly during CGRO Phase III.
In order to investigate the energy spectra of 3C 279 we have generated deconvolved, background-subtracted source fluxes in the four standard COMPTEL energy bands by application of the method described above. These spectra were generated for the observational periods for which 3C 279 was detected, the combined Phase I observations (VPs 3+11)and the combined Phase III observations, and for the sum of all data, to derive a four-year average MeV-spectrum of 3C 279. To determine the spectral shape, we fitted a simple power-law function of the form
| (1) |
with the parameters (photon spectral index) and (intensity at the normalisation energy ). was chosen that the two free parameters are minimally correlated. The 1-errors on the parameters are derived for two parameters of interest by adding 2.3 to the minimum -value (Lampton et al. 1976). The COMPTEL spectra together with the best-fit model are shown in Figure 3, and the fit results are given in Table 2.
| Obs | Range | E0 | I0(E0) | ||
|---|---|---|---|---|---|
| (MeV) | (MeV) | (ph cm-2 s-1 MeV-1) | |||
| Phase I | 0.75-30 | 6.0 | (2.9) 10-6 | 1.2 | 1.6 |
| Phase III | 0.75-30 | 3.0 | (12.9) 10-6 | 2.2 | 0.1 |
| Phase I-IV | 0.75-30 | 3.0 | (11.6) 10-6 | 1.9 | 1.1 |
| Phase I-IV | 0.75-10000 | 200 | (2.15) 10-9 | 2.04 | 1.5 |
The images (detections) indicate during Phase I a ”harder” spectrum than during Phase III. This trend is supported by spectral fits as well. However, the spectral slopes are consistent within error bars. The average MeV-spectrum, measured over the four-year period, shows a spectral slope of roughly -1.9. To check for a possible spectral break, we enlarged the energy range by generating an average four-year EGRET spectrum of 3C 279 contemporaneous to the COMPTEL one. The COMPTEL points smoothly connect to the EGRET spectrum (Figure 3). No spectral break is obvious. The average MeV- to GeV-spectrum of 3C 279 is consistent with a simple power-law with a slope of -2 (Table 2). By comparing non-simultaneous OSSE and EGRET data, McNaron-Brown et al. (1995) also found the spectrum of 3C 279 to be consistent with a simple power-law shape with a photon index of -1.9.


5 SUMMARY
We have started to consistently analyse the data of COMPTEL 3C 279 observations during several years. Detections and non-detections of 3C 279 along the CGRO-mission indicate a time-variable MeV-flux. Spectral variability is indicated as well, however can not be significantly proven by spectral fits. The average 3C 279 MeV-spectrum over four years is consistent with a photon power-law slope of -1.9, which smoothly connects to the simultaneous EGRET spectrum. No spectral break is required to fit the combined MeV- to GeV-spectrum of 3C 279.
6 ACKNOWLEDGEMENTS
This research was supported by the Deutsche Agentur für Raumfahrtangelegenheiten (DARA) under the grant 50 QV 90968, by NASA under contract NASA-26645, and by the Netherlands Organisation for Scientific Research.
7 REFERENCES
-
Bloemen H., Hermsen W., Swanenburg B.N. et al., ApJ Suppl. 92, 419 (1994).
-
de Boer H., Bennett K., Bloemen H. et al., In: Data Analysis in Astronomy IV, eds. V. Di Gesu et al. (New York: plenum Press), 241 (1992).
-
Collmar W., Bennett K., Bloemen H. et al., MPE Report 261, 81 (1995).
-
Hermsen, W., Aarts, H.J.M., Bennett, K. et al., A&A Suppl. 97, 97 (1993).
-
Kniffen, D. A., Bertsch D. L., Fichtel, C. E. et al., ApJ, 411, 133 (1993).
-
Lampton, M., Margon, B., Bowyer, S., ApJ 208, 177 (1976).
-
McNaron-Brown, K., Johnson, W. N., Jung, G. V. et al., ApJ 451, 575 (1995).
-
Schönfelder, V., Aarts, H., Bennett, K. et al., ApJ Suppl. 86, 657 (1993).
-
Williams O. R., Bennett K., Bloemen H. et al., A&A 298, 33 (1995).