Eclipsing Binaries in the OGLE Variable Star Catalog. III.
Long-Period Contact Systems
Abstract
A sample of contact binaries discovered by the OGLE project in Baade’s Window, with orbital periods longer than one day and with available color and light-curve data, has been analyzed. It consists of only 32 systems, in contrast to 388 W UMa-type systems with shorter periods which were analyzed before. Most systems are very distant and are probably located close to or in the galactic Bulge. Two groups of contact binaries are seen in the sample: (1) a continuation of the W UMa-type sequence, extending up to the orbital periods of 1.3 – 1.5 day, but rather sharply ending in this period range; (2) an inhomogeneous group of rare systems with long periods up to 26 days, all with red colors and relatively shallow eclipses. While the systems of the first group share most of the characteristics of the typical W UMa-type systems (except that they are on the average brighter and more distant, hence more reddened), the long-period systems do not seem to form an early-type extension of contact binaries, but may consist of a mixture of late-type objects, including tidally distorted red giants with invisible companions.
1 INTRODUCTION
The microlensing projects provide, as their most important by-product, discoveries of large numbers of variable stars. The variable-star databases created by these projects have excellent statistical properties and permit addressing basic problems of stellar astrophysics, which require unbiased (or controlled bias) samples based on large numbers of objects. This paper is the third in a series devoted to eclipsing binaries discovered in the OGLE microlensing project in the direction of the Galactic Bulge, within the region of lower galactic extinction known as Baade’s Window. The data used in this series come from the first three parts of the periodic variable-star catalogue covering fields BWC and BW1 to BW8 (Udalski et al. 1994, 1995a, 1995b)111The periodic variable star catalog is also available through the OGLE project Web site, via http://www.astrouw.edu.pl or http://www.astro.princeton.edu/stanek/ogle. The fields BW9 to BW11 (Udalski et al. 1996) have not been used because no data on extinction and reddening are available for these fields.
The first paper of the current series (Rucinski 1997a = R97a) addressed the average properties of the large numbers of the W UMa-type contact-binary systems discovered by OGLE. It was shown that these binaries can be useful distance indicators along the line of sight all the way to the Galactic Bulge at about 8 kpc, with this line passing the center of the Galaxy at the distance of about 500 – 600 pc. The W UMa systems were seen to be uniformly distributed along this line, in agreement with suggestions that, in their majority, they belong to an old galactic population. The analysis of the period and color distributions confirmed that the most common contact binaries belong to the population of the Old Disk (with a possible admixture of the Halo) Main Sequence turn-off (MSTO) stars, within the well defined ranges of the periods and colors: day and . Their density was found to be relatively high, with the apparent (most probably about 2-times lower than the spatial) frequency of occurrence among the F – K dwarfs of approximately one such a system per 250 – 300 main sequence stars.
The second paper of the series (Rucinski 1997b = R97b) analyzed properties of the light curves of the same systems using a simple, Fourier-analysis approach based on the lowest-term cosine coefficients. The light-curve amplitude distribution strongly suggested a mass-ratio distribution steeply climbing toward low mass-ratios (more unequal masses) indicating that the current sky-field sample (which contains predominantly large-amplitude systems) is heavily biased in favor of large mass-ratio () systems. Contact system with unequal depths of eclipses (i.e. unequal temperatures of the components) appear only for orbital periods longer than 0.37 day, but their relative spatial frequency even above this cutoff is low, about 1/50 of the number of contact systems with comparable periods. The difference in depth of eclipses is correlated with the presence of unequally-high light-curve maxima. The most common type of the maxima asymmetry is in the sense of the first (after the deeper eclipse) maximum being higher of the two. This indicates that the systems with asymmetric maxima may be semi-detached binaries with matter flowing from the hotter, more massive component and forming an accretion hot spot on the cooler component.
Papers R97a and R97b analyzed the eclipsing systems in the OGLE sample with orbital periods shorter than one day only. This paper analyzes the contact systems above the one-day period cutoff with a goal simply to see what sort of contact binaries exist at longer orbital periods. There was also one specific reason to look at the long-period binaries: As was pointed by Popper (1982), some of the close, long-period, O-type, close binary systems show properties very similar to those of the genuine W UMa-type systems. In particular – and this may be taken as a definition of the class of contact binaries – their components have sometimes equal temperatures in spite of unequal masses. Continuity of the properties of the contact-binary systems across the convective/radiative boundary at late-A/early-F spectral-type up to the O-type stars has never been proven, but its likelihood was pointed in numerous studies. Although very young stars are not expected to exist in the OGLE sample due to the rapid emergence of the line of sight from the Young Disk (for ), at the distance of about 2.5 to 3 kpc, the sample may still contain moderately young stars.
This paper is organized as follows: Section 2 discusses selection of a sample of long-period contact systems, and Sections 3 and 4 discuss the period–color and color–magnitude diagrams. The light curves of four systems with periods longer than 1.5 days are described in Section 5. Conclusions of the paper are given in Section 6. Papers R97a and R97b should be consulted for several details which have been omitted in this paper.
2 THE ONE-DAY DIVIDING LINE AND THE RESTRICTED LONG-PERIOD (RLP) SAMPLE
By definition, the W UMa-type binaries have periods shorter than one day. On the other hand, the demarcation line at one day quite commonly appears in the variable-star research and is obviously due to the night/day periodicity superimposed on any ground-based data. Is then the one-day limit on the W UMa-type periods a physical one? In fact, contact systems with orbital periods of up to one day were amply represented in the magnitude-limited sample in R97a and R97b, but the period distribution for a volume-limited sub-sample (R97a) did show a strong concentration in the period range 0.25 to 0.65 day and a rapid drop for orbital periods longer than about 0.7 day. Therefore, the traditional definition of the W UMa-type is possibly not entirely artificial, but has a deeper reason, which in R97a was attributed to the evolution of close binary stars of old galactic population in the final, Turn Off stage of the Main Sequence evolution. Here, we re-consider the selection of the contact-binary sample, with the use of the the Fourier analysis of the light curves, as in R97a and R97b, to see how continuous is the transition in the numbers of the contact binaries across the 1-day line.
The full OGLE sample consists of 933 eclipsing binaries, among them 257 systems have orbital periods longer than one day. The Fourier coefficients and for all eclipsing systems are shown in Figure 1. This figure contains also the curve which was used before to divide the diagram into domains of contact (below) and non-contact (above) systems. This “inner-contact” curve, , was found in R97a on the basis of an extensive exploration of the whole parameter space characterizing light curves of contact binary systems, in terms of orbital inclinations, mass-ratios and fill-out factors (Rucinski 1993 = R93). The calculations in R93 had an important limitation for the present context: They were all done for one set of atmospheric properties, in particular for one assumed gravity-brightening law, the so-called Lucy or convective-envelope law, . It is by no means obvious that the same inner-contact curve would apply to long period systems if they happened to be hotter than the convective/radiative envelope dividing line at spectral types around late-A/early-F. Such hotter, radiative-envelope systems would presumably obey the von Zeipel law, . In fact, as had been expected on the basis of the particular spatial direction of the OGLE survey, all systems of the sample were found to be quite red. However, without any spectroscopic data, we cannot exclude a remote possibility that some of them are heavily reddened early-type stars. For that reason, a new series of calculations with the assumed “radiative” gravity-brightening law has been conducted. These calculations are briefly described in the Appendix to this paper, with the full results available electronically. They confirm that the inner-contact dividing-line established in R97a is approximately valid also for the case of the radiative gravity-brightening law, and it tends to be only slightly too conservative at the large light-curve amplitude end.
Figure 1 shows rather directly that the contact binaries dominate in numbers for the orbital periods day, with only a moderate number of detached systems above the inner-contact curve. In contrast, very few systems with day fall into the contact-binary domain, between the inner-contact limiting curve , and the line (from now on, this domain in the , coefficient space will be called the Fourier filter). Thus, long-period contact systems are very rare. Because they must be intrinsically bright due to the large radiating surfaces, we should be able to see them to large distances. Therefore, the rarity of long-period contact binaries is even more pronounced than may appear from the magnitude-limited OGLE sample. Not knowing the discovery selection effects of the OGLE catalog for variable stars with periods comparable with durations of the OGLE observing seasons, we would be cautious to make any statements for systems with periods of several weeks or months, but the selection effects should be moderate and – most importantly – similar for binaries with periods of one day to a few days. Thus, the drop in numbers of contact systems around the period of one day seems to be real. In the next section we suggest that the normal sequence of contact systems extends to the periods of 1.3 – 1.5 day and then ends quite abruptly.
The sample used from this point on will be called RLP, for the Restricted Long Period sample. The 32 systems of this sample are listed in Table 1. It is an analogue of the R-sample used in R97a and R97b, and it is “restricted” in the sense that it contains only 32 binaries which pass the Fourier filter from among 136 eclipsing long-period systems, have good light curves (overall quality of the “multiple-cosine, single-sine” fit better than 0.04 mag; cf. R97b) and have measured colors. However, 12 among those 32 systems have small amplitudes of their light curves () making any inferences susceptible to observational errors. In most cases, it is impossible to say anything about the light curves of those 12 systems; they would be normally called ellipsoidal variables, a name used in most cases to designate close binary systems with tidally strongly distorted components seen at low inclination angles and/or having very small mass-ratios. As we expand in Section 5, tidally-distorted single stars in systems with invisible companions may also belong here.
3 THE PERIOD–COLOR DIAGRAM
The period–color (PC) relation is one of the most useful diagrams in studies of contact binaries. As was discussed in R97a, contact binaries cannot be bluer and/or cannot have shorter periods than a limiting line which was called the short-period blue envelope (SPBE). The SPBE has a meaning very similar to that of the Zero Age Main Sequence line on the color–magnitude diagram and offers us an important tool to judge the degree of evolution or reddening of a system. Both effects can shift a system away from this line: the reddening simply shifts in the color coordinate while evolution can lead to an increased period and a redder color.
Figure 2 shows the PC relation for all systems of the R-sample (papers R97a and R97b) and the RLP-sample, together with the SPBE line established for day. The lower panel of the figure gives the histogram of the orbital periods for all contact binaries considered in this series of papers. Figure 2 contains several interesting properties of the sample that we discuss in turn:
-
1.
The conventional dividing line between the W UMa and long-period contact binaries at one day is not obvious in the histogram of the orbital periods; we also do not see any deficiency in the one-day period bin which could be ascribed to discovery selection effects in the OGLE data.
-
2.
The RLP sample contains 21 systems in the 1 – 2 day orbital period range, however all but one have periods shorter than 1.5 day. This abrupt drop in numbers of contact binaries at about 1.3 – 1.5 day strongly suggests that the class of the genuine contact binaries of the W UMa-type extends roughly to this period. There are only 8 contact systems within the day interval and 4 systems with days.
-
3.
The vertical, upward directed vectors in Figure 2 give the maximum values of reddening determined from interpolation in the maps of reddening and extinction by Stanek (1996). These values were determined from data for the Bulge stars and may be over-estimates for nearby objects. However, they are probably reasonable approximations of the reddening for intrinsically luminous, long-period contact systems. Even after application of the relatively large reddening corrections, most of the RLP sample systems remain surprisingly red, indicating that either they are in fact intrinsically red or that another source of reddening increases their colors. On the PC diagram, these systems are located way below any reasonable extension of the SPBE. Thus, most systems, especially those with days are not hot, Main-Sequence analogues of the W UMa systems.
-
4.
Figure 2 shows lines of equal absolute magnitudes , following the calibration in R97a: . This calibration can only be used for binaries with fainter than absolute magnitude of about and for combinations of periods and colors encountered among the typical W UMa-type systems. Therefore, it almost certainly does not apply to the long-period systems analyzed here. However, Figure 2 suggests that we can rather safely assume that, after reddening corrections are made, most of the RLP systems are brighter than , and perhaps by a large margin. For the extinction of , systems located in or close to the Bulge at the distance of 8 kpc are expected to have ; this level is close to the median magnitude for the systems discussed in this paper (see Figure 3 below).
-
5.
Among the 12 systems with day, only four have variability amplitudes larger than mag (formally, the criterion was used, with expressed in intensity, not magnitude units). These are the systems BW0.036, BW4.002, BW1.152 and BW4.131. These four systems222The naming convention used here is: BW for Baade’s Window, followed by the OGLE field number, and then the variable number, after the dot. The central field BWC is identified by zero. are marked in Figure 2 and discussed further in the next sections.
4 THE COLOR–MAGNITUDE DIAGRAM
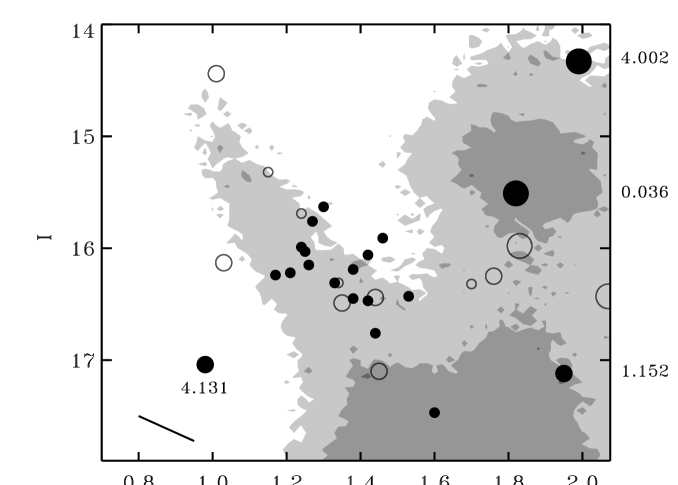
Figure 3 shows the long-period contact systems on the observational color–magnitude diagram, together with the number density contours for Baade’s Window stars, in the same way as in R97a. The orbital periods are coded by sizes of the circles in this figure. The open circles mark 12 systems with small variability amplitudes, measured here by the size of the second Fourier term, . Very little can be said about such binaries. In what follows, we will concentrate on the 20 systems showing larger variability amplitudes, which are marked by filled circles.
Starting at the long-period end of the RLP sample with systems having longer than 10 days: The brightest and reddest systems are BW4.002 and BW0.036. The former, with the orbital period of 22.7 days, is located on the figure among bright red giants of the Bulge while the latter, with the period of 26.3 days, appears among stars of the Bulge Red Clump. Obviously, we have no proof that these systems are at the distance of the Bulge; they can be anywhere on the line of sight. But, because of the long periods, there is no question that both are red giants. If indeed contact systems, these would be extremely interesting objects demanding further studies. As was pointed by Eggleton (1996), only two red giants, UU Cnc and 5 Cet, both with periods of about 96 days, had been suspected to be contact red giants; Eggleton dismissed this explanation for both binaries suggesting semi-detached configurations instead. The light curves of both systems are discussed in the next section.
The systems with periods between 1.5 and 10 days do not form a homogeneous group and do not show any clear association in terms of the accessible observational properties. Probably the most interesting is BW4.131, faint and thus probably distant, yet with a relatively blue apparent color.
In contrast to the 1.5 – 10 day period group, the contact systems with periods shorter than 1.5 days appear in a well defined location on the color–magnitude diagram in Figure 3, slightly above the inclined band of the Main Sequence Turn Off (MSTO) stars of an old galactic population. The MSTO stars in Baade’s Window are progressively reddened with distance so that their slanted sequence simulates the color-magnitude distribution of the relatively local, young-disk population (Kiraga et al. 1997); normally, in less reddened areas of the Milky Way, such stars form a band extending vertically over several magnitudes in brightness. Typical short-period W UMa stars, which were analyzed in R97a, populate this band in the same way as other stars. As we can see in Figure 3, the contact systems in the day range are slightly differently located and tend to populate the right upper edge of the old MSTO sequence. Thus, on the average, they are brighter and/or redder than typical MSTO (and, by implication, typical W UMa-type) stars. Probably, it is a combination of several factors why these systems delineate the red/bright edge of the MSTO and why the drop in their numbers at about 1.3 – 1.5 day is so well defined. Most likely, these factors are: (1) a comparable, advanced age of the systems ending the MSTO evolution, (2) a related to (1) limit on the mass for the old galactic population, and (3) a drop in the spatial density of the disk stars as the line of sight goes past the distance of the Bulge. As we noted in the previous section, systems with are expected to be in the distance of the Bulge, provided their luminosities are higher than corresponding to , which is probably the case for most among contact systems with periods longer than one day. The systems of the 1.0 – 1.5 day group appear predominantly at . However, it should be kept in mind that rather large differences in extinction are observed within Baade’s Window (; Stanek 1996) so that the spread in is in fact surprisingly small. This can be taken as another indication of similar distances to these stars, probably in the space volume in the vicinity of the Bulge.
5 THE LIGHT CURVES
5.1 Relative depths of eclipses
This paper attempts to preserve the spirit of the papers R97a and R97b in the sense that the analysis of the data is simple and straightforward. As in these papers, we use here only the Fourier coefficients , and .
The first cosine coefficient can be used, as in R97b, to address the matter of the eclipse depth differences and the existence of systems that are either not in thermal contact or perhaps are semi-detached systems just mimicking good contact. Figure 4 shows the coefficient plotted versus , the latter representing the amplitudes of the light variations. As before, we use to delineate systems which have the eclipse depth differences too large to be considered as normal, good-thermal-contact systems. We see only three such systems in the RLP sample, BW1.056, BW4.064 and BW7.054. Interestingly, all three have periods very close to one day: 1.057, 1.069 and 1.009 day. All the remaining binaries show light curves with sufficiently similar eclipses to be formally classified as good thermal and geometrical contact systems. The fraction of 3 “asymmetric” systems among 20 systems with periods within day is somewhat high (but not statistically significant) when compared with the percentages observed below one day (R97b).
A correlation between depth of eclipses and light-curve maxima asymmetry was found in R97b. The correlation was in the sense of the larger depth difference going together with the higher first light maximum (after the deeper eclipse). This correlation was driven by systems which formally passed through the Fourier filter to be classified as contact ones, yet showed eclipse depths disparate enough to suspect lack of thermal contact or even semi-detached configurations. The correlation could be most easily explained by an accretion region on the side of the cooler, less-massive component. We see again the same correlation for the systems of the RLP sample (Figure 5), which is clearly visible mainly for the systems with large eclipse differences mentioned above.
5.2 Light curve amplitudes
As was shown in R97b, statistics of variability amplitudes contains information on the mass-ratio () distribution (in short: for , only small amplitudes are possible), although extraction of this information would not be easy since the latter enters through a convolution integral equation.
With only 32 systems of the RLP sample, we can only ask a simplified question: Is the amplitude distribution of the RLP systems different from that for the genuine W UMa systems of the R-sample? Both distribution are shown in Figure 6. We see that, the small-number statistics notwithstanding, the RLP sample consist of a group of 9 small-amplitude systems, all having , and a larger group with the -distribution which is somewhat similar to that for the typical W UMa systems. The small-amplitude end of the distribution must be partly shaped by the OGLE discovery selection effects, but we have no simple explanation for the relatively high incidence of the small-amplitude systems in the sample forming the isolated peak at . It is possible that it can be explained by the observational preference for such systems in the OGLE sample, as they are all moderately bright with all, but one, appearing at mag.
The rather rapid falloff from the side of large amplitudes may indicate a mass-ratio distribution peaking at low values of , as discussed in R97b for typical W UMa-type systems. However, the peak for long period systems seems to be shifted toward smaller amplitudes which may indicate a tendency for even smaller mass-ratios (more dissimilar stars) at longer orbital periods. Most existing theoretical scenarios envisage progressions to more extreme mass-ratios and to more massive and hotter primary components with advancement of angular-momentum-loss driven evolution (for references, see Eggleton 1996). These theoretical predictions have some support in the properties of the most evolved among contact binaries. For example, among 28 contact binaries discovered by Mazur et al. (1995) in the field of the open cluster Cr 261, the five which are located among the Blue Stragglers of the cluster have systematically smaller amplitudes than the remaining systems (see Figure 14 in that paper). Also, Eggen and Iben (1989) suggested that the small-amplitude system AW UMa, the well-known record holder in smallness of the mass-ratio among W UMa-type binaries, is a Blue Straggler in the local volume close to the Sun. Thus, while a link between the mass-ratio and the advancement of evolution does seem to exist, do we see a similar link with the orbital period of a system? To answer this question, the distribution shown in Figure 6 requires splitting into period bins.
When analyzing the details of the light-curve amplitude distributions, it is advantageous to use the coefficients , instead of . The latter scale333For small amplitudes, the relation is: ; for larger amplitudes the relation is steeper: , correspond to mag. with , but offer an advantage of being free of the temperature differences between components which affect the relative depths of the eclipses and hence the values of ; the coefficients do retain the dependence on the mass-ratio and on the (assumed randomly-distributed) orbital inclinations. Figure 7 shows the values of for the combined short- and long-period samples versus the orbital period. We see again that large amplitudes do not appear among long-period systems. For typical W UMa-type systems, the mean and median values of the amplitudes in bins of are very similar across the whole period domain up to one day. Then, beyond one day, the mean and median values appear to fall down sharply. However, it is difficult to tell if this is simply an effect of poorer statistics or a real effect as the mean and median values of the amplitudes are expected to be biased. The reason is that for progressively smaller sub-samples drawn from a skewed distribution, the mean and the median values will tend to drift toward the modal (most probable) value of the distribution. If we use the amplitude distribution for day range as a reference one, we see that the mean and median values for the day indeed approach the modal value of that distribution (see the lower panel of Figure 7). Thus, the apparent drop in the mean and median values of the amplitudes for the group of the systems within day can be explained as due to the small number statistics. No statements on the global amplitude properties are possible for the long-period systems with day.
5.3 Long-period contact binary systems
Probably the most interesting in this paper are the binaries which have passed the formal scrutiny to be included among contact systems and which have orbital periods longer than 1.5 days. Are these systems genuine contact binaries? Only four such systems have variability amplitudes larger than corresponding to . The light curves for the four systems are shown in Figure 8. Only BW4.002 shows mag, but the deeper eclipse is poorly defined in its light curve. Unfortunately, very little can be said about these binaries because light-curve solutions do not give unique results for small variability amplitudes and without spectroscopic data on the mass-ratios. Here, additionally, the light curves for three of these systems are definitely too poor for any attempts at solving them. We are then left with only one long period system, BW0.036, which appears to be a contact one with a long period of 26.3 days, but with a small amplitude of mag. Is it really a contact system?
If BW0.036 is a Red Clump giant in the Galactic Bulge, as its location on the color–magnitude diagram would suggest (Figure 3), this would be a most unusual, highly evolved contact system. However, it could be a less distant star, a red giant or sub-giants, but there is little doubt that it must be an evolved object. We do not know any contact systems consisting of red giant stars (cf. Section 4), so we may consider a different binary configuration: a single star, which is varying in brightness because of the tidal distortion exerted by its much smaller companion. A limited attempt at modeling the light curve of BW0.036 following these lines has been made with the use of the light-curve synthesis program Binary Maker 2 by Bradstreet (1994). It was assumed that the system is not a contact one, but that the only source of variability is an ellipsoidal variation of a tidally distorted single star, close to filling its Roche lobe, in a system containing two same-mass stars. Its companion was assumed to be entirely invisible; it could be a Main Sequence star or a collapsed object. No solution was attempted, but only a “proof-of-concept” model. Thus, for simplicity, the assumed parameters were: the mass-ratio , the inclination , the effective temperature K, with the limb darkening coefficient at Å and the gravity-brightening exponent , in . By varying only one parameter, the surface potential, a reasonable fit was obtained with (Figure 9)444Dr. Carla Maceroni very kindly made full, independent solutions (not just model fits) of the light curves of BW0.036 using the Wilson-Devinney code; she arrived at basically identical results.. This potential corresponds to the star slightly smaller than the inner critical Roche lobe, by about 4 percent of its mean radius. Thus, it is feasible to explain a light curve like that of BW0.036 by a non-contact geometry, although the final check must await radial velocity analysis of the star.
The experiment described above does not prove that systems with equal-mass companions can explain all cases of long-period systems which have light curves similar to those of genuine contact binary stars. It simply shows that small-amplitude light curves have very low information content. Thus, not all binaries passing through the Fourier filter must be contact systems. Still, we believe that systems such as BW0.036 are rare, and that it was discovered only thanks to the tremendous number of red giants in the field. Also, we note that the amplitude distribution of contact binaries cannot be strongly “contaminated” by systems like BW0.036 as the latter could show only small amplitude variations: A limit on the amplitude for the star filling its Roche lobe (for the limb and gravity laws as above) is reached for and and is equal to mag or ; the amplitudes decrease rapidly with departures from these limiting values of and . These considerations are also applicable to the amplitude statistics of the genuine, short-period W UMa-type contact binaries which probably contains an admixture of red-dwarf/white-dwarf pairs such as V471 Tau.
6 CONCLUSIONS
This paper completes analysis of the contact systems in Baade’s Window on the basis of the OGLE sample by addressing the properties of eclipsing binaries with periods longer than one day which passed the Fourier light-curve shape filter. Only 32 such systems with available color and light-curve data have been identified; this should be compared with 388 contact binaries with day used in the previous two papers. The sample (RLP) contains binaries of two types: (1) those of a rather abruptly-ending extension of the W UMa systems, with periods day, and (2) an inhomogeneous group of systems with longer periods.
The group of the contact binaries with the orbital periods day is well defined and its properties could be understood in terms of the evolution of close binary stars of an old galactic population. These stars are slightly redder and brighter than the sequence of progressively reddened old Turn-Off stars, but almost certainly belong to this sequence. The stars can be the most massive representatives of the population of old, close binary stars which are entering the final stages of evolution, just before merging of components, or can be analogues of contact Blue Stragglers observed in globular clusters. Although mean and median amplitudes of light variations for this group of systems are systematically smaller than for the genuine W UMa-type systems with day, this decrease may be entirely due to small sample of the systems in the period range day, coupled with the skewed distribution of the amplitudes.
The second, long-period group was found to contain stars too red to form a genuine continuation of the W UMa-type sequence toward longer periods. Analogues of the Lyrae semi-detached system or of the hot O-type contact binaries pointed out by Popper (1982) were not really expected to show up in the sample due to the particular galactic direction of the survey, and indeed none was found. The systems seen in the OGLE sample are all quite red suggesting configurations involving red giants and sub-giants. However, in the absence of any spectroscopic information, we cannot exclude a possibility of an extremely large reddening in some isolated cases of hot, distant stars. The simplest explanation of the long-period, red binaries would be in terms of spotted giants or, perhaps, binaries with invisible (Main Sequence or collapsed) companions. The first explanation can be ruled out by the high stability of the light curves over the successive annual OGLE seasons. Thus, basically for lack of any other alternatives, we are left with the binaries with only one component producing “ellipsoidal” light variations. Since almost all systems of the long-period group show small amplitudes, this explanation appears to be valid; it certainly works in the case of the best-defined light curve of the star BW0.036. This system would be then in a very special stage of the binary-star evolution and would be visible only thanks to the multitude of red giants in Baade’s Window.
Appendix A SIMPLE LIGHT CURVES COMPUTED FOR THE VON ZEIPEL’S LAW
The set of simplified light curves computed in R93 was all calculated for solar-type stars with one assumed set gravity and limb darkening coefficients. As is well known, light-curves synthesis experiments applied to contact binaries always show that the peculiar geometry of such systems – rather than the atmospheric properties, entering through the limb and gravity coefficients and through the assumed emerging fluxes – determines the shape of the light curves. Therefore, the results in R93 are expected to apply over a wide range of spectral types. However, the systems considered in the current paper have been selected on the basis of their long periods. Therefore, there is a chance that some of them may be heavily reddened early-type stars.
A new set of light curves have been generated to test the sensitivity of the light curves, and especially of the Fourier light-curve shape filter based on and , to the assumed atmospheric properties of the stars. As an extreme case, hot stars of approximately spectral type B0 (32,000 K), observed in the I-band (as in the OGLE project) have been considered in this auxiliary set of computations. Instead of the convective-envelope (Lucy) gravity brightening law, , the radiative-envelope (von Zeipel) law, , was used. The additional assumptions concerned the adopted bracketing atmospheres (34,500 K and 30,250 K) which were characterized by relative fluxes 1.078 and 0.922 and by the linear limb darkening coefficients 0.20 and 0.23.
The results of the computations, in the same format as the tables accompanying R93, will not be published, but are available through Internet555http://www.cfht.hawaii.edu/r̃ucinski/. Of note are the following properties, which distinguish the results for hot contact systems from those for the solar-type case: (1) Since the I-band is far red-ward of the spectrum peak for hot stars, the relative fluxes in the bracketing atmospheres differ rather moderately; (2) For the same reason, the limb darkening coefficients are small; (3) These two effects over-compensate the influence of the stronger gravity brightening producing very similar, even slightly less deep eclipses than for typical solar-type systems.
The diagram versus , based on the new calculations, is shown in Figure 10. This type of a diagram was suggested in R93 as a simple tool for approximate estimates of the degree of contact and then used in R97a for selection of the sample of contact binaries. As we can see in the figure, the limiting “inner-contact” line, which was used in R97a, may serve quite well for the hot binaries. Detailed comparison of this figure and of Figure 6 in R93 reveals a few subtle differences, which can be ascribed primarily to the low values of the limb darkening coefficients for the hot stars. The main change is that the light variations expected in the I-band for hot stars (measured here by ) are actually slightly smaller than in the V-band for solar-type binaries, in spite of the use of the stronger (von Zeipel’s) gravity-brightening law. This effect comes about because of the large areas of the projected disks seen during eclipses at low emergence angles, so that the reduced limb darkening in hot stars is more important, in fact over-compensates the stronger gravity brightening.
References
- (1)
- (2) Bradstreet, D.H. 1994, in Light Curve Modeling of Eclipsing Binary Stars, ed. E.F. Milone (Springer-Verlag, New York), p. 151
- (3)
- (4) Eggen, O.J. & Iben, I. 1989, AJ, 97, 431
- (5)
- (6) Eggleton, P.P. 1996, in The Origins, Evolution and Destinies of Binary Stars in Clusters, eds. Milone, E.F., Mermilliod, J.-C., ASP Conf. 90, p. 257
- (7)
- (8) Kiraga, M., Paczyński, B., & Stanek, K. Z. 1997, ApJ, 485, 611
- (9)
- (10) Mazur, B., Krzemiński, W. & Kałużny, J. 1995, MNRAS, 273, 59
- (11)
- (12) Popper, D.M. 1982, ApJ, 262, 641
- (13)
- (14) Rucinski, S.M. 1993, PASP, 105, 1433 (R93)
- (15)
- (16) Rucinski, S.M. 1997a, AJ, 113, 407 (R97a)
- (17)
- (18) Rucinski, S.M. 1997b, AJ, 113, 1112 (R97b)
- (19)
- (20) Stanek, K.Z. 1996, ApJ, 460, L37
- (21)
- (22) Udalski, A., Kubiak, M, Szymanski, M. Kaluzny, J., Mateo, M., & Krzeminski, W. 1994, AcA, 44, 317
- (23)
- (24) Udalski, A., Szymanski, M., Kaluzny, J., Kubiak, M, Mateo, M., & Krzeminski, W. 1995a, AcA, 45, 1
- (25)
- (26) Udalski, A., Olech, A., Szymanski, M., Kaluzny, J., Kubiak, M, Mateo, M., & Krzeminski, W. 1995b, AcA, 45, 433
- (27)
- (28) Udalski, A., Olech, A., Szymanski, M., Kaluzny, J., Kubiak, M, Mateo, M., Krzeminski, W. & Stanek, K, 1996, AcA, 46, 51
- (29)


| BW | P | Fourier coefficients | ||||||
|---|---|---|---|---|---|---|---|---|
| number | (days) | cos 1 | cos 2 | cos 4 | sin 1 | |||
| 0.036 | 26.307 | 15.51 | 1.82 | 0.24 | ||||
| 0.053 | 1.189 | 15.69 | 1.24 | 0.13 | ||||
| 0.149 | 3.503 | 17.10 | 1.45 | 0.21 | ||||
| 1.056 | 1.057 | 15.99 | 1.24 | 0.64 | ||||
| 1.079 | 1.018 | 16.31 | 1.33 | 0.27 | ||||
| 1.152 | 4.368 | 17.12 | 1.95 | 0.32 | ||||
| 2.043 | 4.851 | 16.25 | 1.76 | 0.11 | ||||
| 2.047 | 1.072 | 16.31 | 1.34 | 0.17 | ||||
| 2.055 | 1.364 | 16.43 | 1.53 | 0.29 | ||||
| 2.061 | 1.088 | 16.47 | 1.42 | 0.30 | ||||
| 2.064 | 2.679 | 16.49 | 1.35 | 0.12 | ||||
| 2.078 | 1.029 | 16.76 | 1.44 | 0.30 | ||||
| 3.023 | 1.013 | 15.63 | 1.30 | 0.41 | ||||
| 3.051 | 14.243 | 15.98 | 1.83 | 0.13 | ||||
| 3.054 | 1.222 | 16.03 | 1.25 | 0.36 | ||||
| 3.070 | 1.225 | 16.32 | 1.70 | 0.14 | ||||
| 3.079 | 12.313 | 16.43 | 2.07 | 0.12 | ||||
| 3.080 | 1.131 | 16.45 | 1.38 | 0.25 | ||||
| 4.002 | 22.672 | 14.33 | 1.99 | 0.57 | ||||
| 4.041 | 1.416 | 15.76 | 1.27 | 0.21 | ||||
| 4.064 | 1.069 | 16.24 | 1.17 | 0.50 | ||||
| 4.082 | 3.163 | 16.44 | 1.44 | 0.12 | ||||
| 4.131 | 2.701 | 17.04 | 0.98 | 0.31 | ||||
| 5.009 | 1.588 | 14.44 | 1.01 | 0.11 | ||||
| 5.138 | 1.296 | 17.47 | 1.60 | 0.35 | ||||
| 6.052 | 1.113 | 16.06 | 1.42 | 0.27 | ||||
| 6.059 | 1.204 | 16.19 | 1.38 | 0.24 | ||||
| 7.044 | 1.181 | 15.91 | 1.46 | 0.21 | ||||
| 7.054 | 1.009 | 16.15 | 1.26 | 0.43 | ||||
| 7.057 | 1.081 | 16.22 | 1.21 | 0.29 | ||||
| 8.024 | 1.458 | 15.32 | 1.15 | 0.14 | ||||
| 8.053 | 2.513 | 16.13 | 1.03 | 0.19 | ||||