AN X-RAY TEMPERATURE MAP OF COMA
We present an X-ray temperature map of the Coma cluster of galaxies obtained with the ROSAT PSPC. As expected from the X-ray surface brightness distribution the intracluster gas of Coma is not isothermal. The temperature structure resembles a bow shock of hot gas produced by the passage of the subcluster around NGC 4839 through the main cluster, confirming hydrodynamical simulations.
1 Introduction
The Coma cluster of galaxies was long considered to be the archtype of a relaxed virialized cluster in a state of dynamical equilibrium (c.f. Kent and Gunn ). There were however conflicting claims that Coma shows substructure, seen as a clumping of galaxies around the brightest galaxies in the cluster (c.f. Baier , Fitchett and Webster , and Mellier et al. ). On the other hand, Geller and Beers and Dressler and Schectman claim that there is no statistically significant structure in the Coma cluster. The first unequivocal evidence for substructure in Coma came from an X-ray image, obtained during the all sky survey of the ROSAT satellite (Briel, Henry and Böhringer ). They found diffuse X-ray emission from the regions of the NGC 4839 and 4911 subgroups and interpreted the 4839 group to be in the process of merging with the main cluster. Long ROSAT PSPC pointed observations revealed even more irregular cluster structure and X-ray emission from a number of bright galaxies (White, Briel and Henry and Dow and White ). Applying the wavelet transform analysis to these pointed observations, more significant substructure was found in the core of Coma (c.f. Biviano et al. and Vikhlinin, Forman and Jones ). Using these observational results, Burns et al. made hydrodynamic/N-body simulations and concluded that the 4839 group has already passed through the Coma cluster. More evidence for the merging scenario came from the first temperature map of the intracluster gas of Coma, obtained from the ASCA observation (Honda et al. ) and from further simulations by Ishizaka and Mineshige .
In this paper we report on a more detailed temperature map of Coma, obtained from the pointed ROSAT PSPC observations. Although ROSAT only observes in an energy band from 0.2 to 2.5 keV, we have shown on several clusters of galaxies that it is possibile to determine the usual high cluster temperatures, given a sufficiently high photon statistic (c.f. Briel and Henry and Henry and Briel ).
| RA | DEC | Exposure | |
|---|---|---|---|
| (2000) | (2000) | (ksec) | |
| Date | h min sec | o ’ ” | MV 170 |
| 1991 Jun 16 | 12 57 43.20 | +27 36 00.0 | 20.3 |
| 1991 Jun 16 – Jun 17 | 12 59 45.60 | +27 48 00.0 | 21.5 |
| 1991 Jun 17 – Jun 18 | 12 59 45.60 | +27 58 12.0 | 20.8 |
| 1991 Jun 18 – Jun 19 | 13 00 31.20 | +28 07 48.0 | 21.2 |
2 Observations and Data Reduction
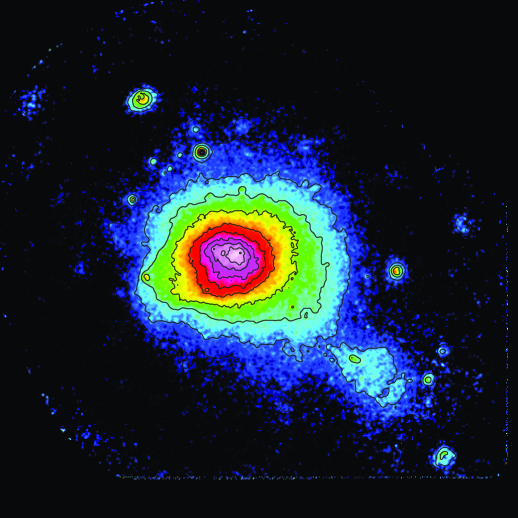
The Coma cluster was in the field of view of 4 pointed observations performed with the PSPC (Pfeffermann et al. ) on board the ROSAT satellite (Trümper ). In Table 1 we show the journal of the observations with the pointing directions and the accepted on axis exposure times. A spatial analysis was done by White, Briel and Henry from which we show in Figure 1 the surface brightness distribution in the 0.5 – 2.4 keV energy band. To emphasize faint structures they used an increasingly large smoothing at increasing lower surface brightness. For more details on the procedure and on the interpretation of the image see references 8 and 9.
To obtain a temperature map of the intra cluster gas, we used essentially the same procedure we have described in detail in the paper about the temperature map of A2142 (Henry and Briel ). The main difference was that for Coma we used the Rev2 data of the SASS, using the EXSAS command process/ct to correct for spatial variations of the PSPC gain and to adjust the overall gain of the PSPC within 33 arcmin diameter to a value consistent with the temperature of 8.11 0.04 keV, as measured with the GINGA satellite (David et al. ). The neccessay adjustment of the gain was in the order of 1% for the four observations. Background-subtracted spectra from sectors of rings centered near the center of Coma from each pointing were summed, after correcting each photon for vignetting, and then fitted to Raymond–Smith models with the heavy-element abundance fixed to 0.22 of their solar values.
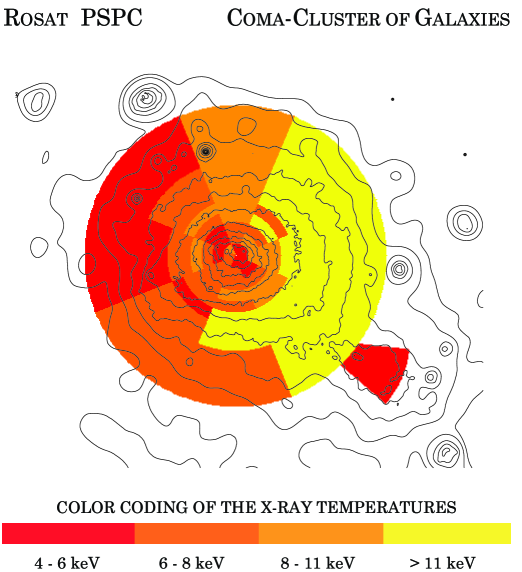
As usual, photons from point sources were excluded during all spectral fits. Special care was taken to obtain the background level outside at least 50 arcmin from the cluster center, at which Coma shows a surface brightness of less then 0.3% from its peak brightness, which is less than 20% of the background. In Figure 2 we show the result of the spectral fitting of the different regions as a color representation of the temperatures with overlain contour map of the surface brightness from Figure 1. The four temperature bands are roughly separated by 1 (for one parameter of interest). There are three main points to note: (1) The region around NGC 4839 shows a low temperature of 4.8 +1.1/-0.8 keV, consistent with the typical temperature of a group of galaxies. (2) There is a hot arc-shaped region at the west side of the cluster where the NGC 4839 group is located, confirming the result of the ASCA measurement . (3) Within 30 arcmin diameter, where the cluster has its highest surface brightness, we find significant temperature structure on scales of a few arcmin (1 arcmin corresponds to 40 h kpc).
3 Conclusions
The intracluster gas of the Coma cluster of galaxies shows significant temperature structure on large scales and down to a few arcmin scale. The large scale temperature structure resembles an arc-shaped bow shock at a significant higher temperature compared with the rest of the cluster, located at the same side where the cooler galaxy group around NGC 4839 is found. This bow shock can be interpreted as the result of the passage of the group through the main cluster, as it was suggested by hydrodynamic/N-body simulations of merger events , . Hence, this temperature map of the Coma cluster of galaxies might have answered the open question whether the subgroup is on its way through the cluster or if it already has passed the cluster core. If the answer is in fact in favor of the post-merger scenario, then an other puzzle occurs: where does the intragroup gas come from? Was there enough time after the passing to built up new gas, or was the stripping of the group gas while passing through the cluster inefficient? More simulations of the merging/passing of a group with/through a cluster are needed to clarify those questions.
Acknowledgements
The ROSAT project is supported by the BMBF. JPH thanks Prof. J. Trümper and the ROSAT group for their hospitality during the course of this research. JPH was supported by NASA grant NAG5-1789, and NATO grant CRG 910415. UGB and JPH thank Simon White for using his Coma Rev2-data prior to the release into the public archive.
References
References
- [1] Kent, S.M. and Gunn, J.E. Astron. Journal 87, 945 (1982).
- [2] Baier, F.W. Astr. Nach. 305, 175 (1984).
- [3] Fitchett, M., and Webster, R. Astroph. Journal 317, 653 (1987).
- [4] Mellier, Y., Mathez, G., Mazure, A., et al. A&A 199, 67 (1988).
- [5] Geller, M.J., and Beers, T.C. Pub. A.S.P. 94, 421 (1982).
- [6] Dressler, A. and Schectman, S. Astron. Journal 95, 985 (1988).
- [7] Briel, U.G., Henry, J.P. and Böhringer, H. A&A 259, L31 (1992).
- [8] White, S.D.M., Briel, U.G. and Henry, J.P. MNRAS 261, L8 (1993).
- [9] Dow K.L. and White, S.D.M. Astroph. Journal 439, 113 (1995).
- [10] Biviano, A., Durret, F., Gerbal, D. et al. Astron. and Astroph. 311, 95 (1996).
- [11] Vikhlinin, A., Forman W. and Jones, Ch. Astroph. Journal 435, 162 (1995).
- [12] Burns, J., Roettiger, K., Ledlow, M., et al. Astroph. Journal 427, L87 (1994).
- [13] Honda, H., Hirayama, M., Watanabe, M., et al. ApJ 473, L71 (1996).
- [14] Ishizaka,C. and Mineshige, S. Publ. Astron. Soc. Japan 48, L37 (1996).
- [15] Briel, U.G. and Henry, J.P. Nature 372, 439 (1994).
- [16] Henry, J.P. and Briel, U.G. Astroph. Journal 433, L9 (1995).
- [17] Pfeffermann, E., Briel, U. G., Hippmann, H., et al. SPIE 733, 519 (1986).
- [18] Trümper, J. Adv. Space Res. 2(4), 241 (1983).
- [19] Henry, J.P. and Briel, U.G. Astroph. Journal 472, 137 (1996).
- [20] David, L.P., Slyz, A., Jones, Ch., et al. Astroph. Journal 412, 479 (1993).