Abstract
About 25% of the optical extragalactic sky is obscured by the dust and stars of our Milky Way. Dynamically important structures might still lie hidden in this zone. Various approaches are presently being employed to uncover the galaxy distribution in the Zone of Avoidance (ZOA) but all suffer from (different) limitations and selection effects.
We investigated the potential of using the DENIS NIR survey for studies of galaxies behind the obscuration layer of our Milky Way and for mapping the Galactic extinction. As a pilot study, we recovered DENIS , and band images of heavily obscured but optically still visible galaxies. We determined the , and band luminosity functions of galaxies on three DENIS strips that cross the center of the nearby, low-latitude, rich cluster Abell 3627. The extinction-corrected and colours of these cluster galaxies compare well with that of an unobscured cluster. We searched for and identified galaxies at latitudes where the Milky Way remains fully opaque ( and ) — in a systematic search as well as around positions of galaxies detected with the blind H I-survey of the ZOA currently conducted with the Multibeam Receiver of the Parkes Radiotelescope.
1 Introduction
Some of the results of this study have already been reported in Schröder et al. 1997 (Paper I). For a comprehensive description, the goals and earlier results of this project are repeated here, but the reader is referred to paper I for details on earlier presented results.
About 25% of the optically visible extragalactic sky is obscured by the dust and stars of our Milky Way. Dynamically important structures — individual nearby galaxies (cf. Kraan-Korteweg et al. 1994) as well as large clusters and superclusters (cf. Kraan-Korteweg et al. 1996) — might still lie hidden in this zone. Complete whole-sky mapping of the galaxy and mass distribution is required in explaining the origin of the peculiar velocity of the Local Group and the dipole in the Cosmic Microwave Background.
Various approaches are presently being employed to uncover the galaxy
distribution in the ZOA: deep optical searches, far-infrared
(FIR) surveys (e.g., IRAS), and blind H I searches. All methods produce new
results, but all suffer from (different) limitations and selection
effects. Here, the near infrared (NIR) surveys such as 2MASS Strutskie et al. (1997)
and DENIS in the southern sky, Epchtein (1997); Epchtein et al. (1997) could provide
important complementary data. NIR surveys will:
be sensitive to early-type galaxies — tracers of
massive groups and clusters — which are missed in IRAS and H I surveys,
have less confusion with Galactic objects compared to FIR
surveys,
be less affected by absorption than optical surveys.
But can we detect galaxies and obtain accurate magnitudes in crowded
regions and at high foreground extinction using NIR surveys? To assess
the performance of the DENIS survey at low Galactic latitudes we
addressed the following questions:
(1) How many galaxies visible in the band () can we recover in (), () and ()? Although less affected by extinction (45%, 21% and 9% as compared to ), their respective completeness limits are lower (, and , Mamon et al. 1997b; 1998).
(2) Can we determine the , , and band luminosity functions?
(3) Can we map the Galactic extinction from NIR colours of galaxies behind the Milky Way?
(4) Can we identify galaxies at high extinction () where optical surveys fail and FIR surveys are plagued by confusion?
(5) Can we recover heavily obscured spiral galaxies detected in a blind H I search and hence extend the peculiar velocity field into the ZOA via the NIR Tully – Fisher relation?
We pursued these questions by comparing available DENIS data with results from a deep optical survey in the southern ZOA (Kraan-Korteweg & Woudt 1994, Kraan-Korteweg et al. 1995, 1996, and references therein). In this region (, ), over 11 000 previously unknown galaxies above a diameter limit of and with have been identified (cf. Fig. 1 in Paper I). Many of the faint low-latitude galaxies are intrinsically bright galaxies. Within the survey region, we investigated DENIS data at what seems to be the core of the Great Attractor (GA), i.e., in the low-latitude (, ), rich cluster Abell 3627, where the Galactic extinction is well determined Woudt et al. (1997), and in its extension across the Galactic Plane where the Milky Way is fully opaque.
2 Expectation from DENIS
What are the predictions for DENIS at low latitudes? In unobscured regions, the density of galaxies per square degree is 110 in the blue for Gardner et al. (1996), and 30, 11, and 2 in the , and bands for their respective completeness limits of , , (Mamon et al. 1997b; 1998). The number counts in the blue decrease with increasing obscuration as deg-2. According to Cardelli et al. Cardelli et al. (1989), the extinction in the NIR passbands are , , and for , hence the decrease in number counts as a function of extinction is considerably slower. Figure 1 shows the predicted surface number density of galaxies for DENIS and for , as a function of Galactic foreground extinction.

The NIR becomes notably more efficient at , while the Milky Way becomes opaque at . At an extinction of , and become superior to the band, and we can expect to find galaxies in and , even at . These are very rough predictions and do not take into account any dependence on morphological type, surface brightness, orientation and crowding, which will surely lower the counts of actually detectable galaxies counts Mamon (1994).
In April 1997, a new cooling system for the focal instrument of DENIS has been mounted. This appears to increase the band limiting magnitude by 0.5 magnitude and therewith the number of galaxies detectable in the deepest obscuration layer of the Milky Way by a factor of about 2. Consequently, the long dashed curve representing the counts in Figure 1 should be moved up by roughly a factor of 2, which would make the passband competitive with starting at .
3 DENIS-data in the Norma cluster A3627
3.1 Recovery of galaxies found in the band
Three high-quality DENIS strips cross the cluster Abell 3627 practically through its center. We inspected 66 images which cover about one-eighth of the cluster area within its Abell-radius of (each DENIS image is x, offset by in declination and right ascension). The extinction over the regarded cluster area varies as A.
We cross-identified the galaxies found in the optical survey with the DENIS , , and images. An example of a DENIS image in the central part of the cluster is given in Figure 3 of Paper I. On the 66 images, 151 galaxies had been identified in the optical. We have recovered 122 galaxies in the band, 100 in the band, and 74 in the band (not including galaxies visible on more than one image). As suggested by Figure 1, the band indeed is not optimal for identifying obscured galaxies at these latitudes due to its shallow magnitude limit. Most of the galaxies not re-discovered in are low surface brightness spiral galaxies.
Surprisingly, the band provides better galaxy detection than the band. In the latter, the severe star crowding makes identification of faint galaxies very difficult. At these extinction levels, the optical survey does remain the most efficient in identifying obscured galaxies.
3.2 Photometry of galaxies in the Norma cluster
We have used a preliminary galaxy pipeline Mamon et al. (1997b, 1998), based upon the SExtractor package Bertin & Arnouts (1996) on the DENIS data in the Norma cluster to obtain , and Kron photometry. Although many of the galaxies have a considerable number of stars superimposed on their images, magnitudes derived from this fairly automated algorithm agree well with the few known, independent measurements.
Magnitudes could be determined for 109, 98 and 64 galaxies of the 122, 100, 74 galaxies re-discovered in , , and . Figure 2 shows the luminosity function (LF) of these galaxies together with the band LF of the 151 galaxies visible on the same 66 DENIS images. The histograms are normalised to the area covered by the 66 images. The hashed area marks the 60 galaxies common to all 4 passbands. This subsample is mainly restricted by the band. The magnitudes in the bottom row are corrected for extinction. The corrections are derived from Mg2-indices of elliptical galaxies in the cluster (Woudt et al. in prep.) and interpolations according to the Galactic H I distribution.

To assess whether the LFs displayed here are, in fact, representative of the cluster as a whole — and therefore the extinction corrected NIR , , and band LFs displayed in the lower panels characteristic for rich clusters — we compared the band LF of the 151 galaxies on the 66 DENIS-images with the cluster LF as a whole (cf. Woudt, 1997). The extinction-corrected blue cluster LF of the 609 galaxies within the Abell radius, scaled to the Abell area, actually has lower number counts than the o band LF displayed in the bottom panel of Figure 2. This is explained by the fact that our three strips cross the center of the cluster and therewith the region of highest density. The comparison indicates that we are fairly complete to a magnitude of , which is more or less the shaded area, and that the shape of the total LF is very similar to the distribution of the common subsample.
Even though these LFs are still preliminary (we have so far covered only a small area of the Norma cluster and will have missed dwarf galaxies and other LSB galaxies due to the foreground obscuration) the here determined extinction-corrected LFs of the galaxies common to all passbands can be regarded as a first indication of the bright end of the NIR , , and band LFs in rich clusters.
From the below discussed colours of the Norma galaxies, we know that the extinction corrections are of the correct order. Adopting a distance to A3627 of 93 Mpc Kraan-Korteweg et al. (1996), thus , the 60 galaxies cover a luminosity range in of . This compares well with the bright end of the band LF of the Coma cluster core derived by (1997), although it remains puzzling why the number counts derived by them (cf. their Table 1) are so much lower compared to the A3627 cluster.
The NIR magnitudes have been used to study the colour – colour diagram versus . This has been presented and discussed in detail in Paper I. Here it suffices to state that the extinction-corrected colours of the cluster galaxies match the colours of galaxies in unobscured high latitude regions Mamon et al. (1997b) extremely well, suggesting that our preliminary photometry is reasonably accurate. Moreover, the shift in colour can be fully explained by the foreground extinction or, more interestingly, the NIR colours of obscured galaxies provide, in principle, an independent way of mapping the extinction in the ZOA (see also Mamon et al., 1997a).
4 ‘Blind’ search for galaxies
The GA is suspected to cross the Galactic Plane from the Norma cluster in the south towards the Centaurus cluster in the north. In this region, we performed a search for highly obscured galaxies on the so far existing DENIS survey images. The search area within the GA-region — marked as a dashed box in Figure 3 — is defined as and .

Of the 1800 images in this area we have inspected 385 by eye (308 in ). 37 galaxies at higher latitudes were known from the optical survey. 28 of these could be re-identified in the band, 26 in the band, and 14 in the band. They are plotted as encircled crosses in Figure 3. In addition, we found 15 new galaxies in and , 11 of which also appear in the band (filled circles). The ratios of galaxies found in compared to , and of compared to are higher than in the Norma cluster. This is due to the higher obscuration level (starting with A at the high-latitude border of the search area, cf. contours of Fig. 3).
On average, we have found about 3.5 galaxies per square degree in the band. This roughly agrees with the predictions of Figure 1, although the number of the inspected images and detected galaxies are too low to allow a statistical conclusion. Since we looked in an overdense region we expect a priori more galaxies. On the other hand, we do not expect to find galaxies below latitudes of in this longitude range Mamon (1994). The visual impression of the low-latitude images substantiates this — the images are nearly fully covered with stars.
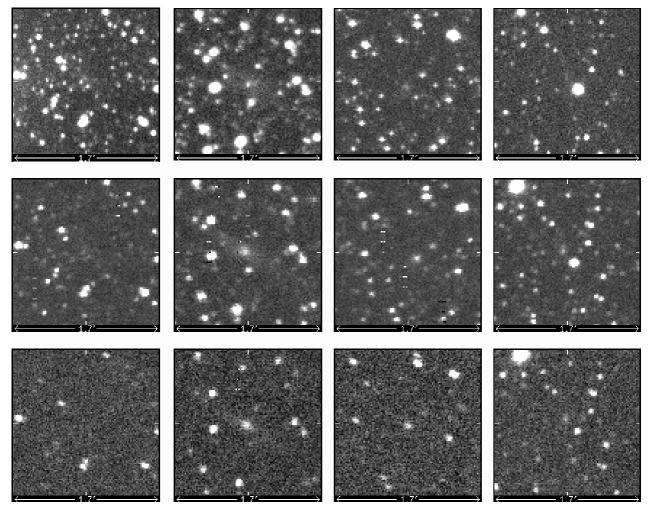
Figure 4 shows a few characteristic examples of highly obscured galaxies found in the DENIS blind search. band images are at the top, in the middle and at the bottom. The left-most galaxy is located at ), with as estimated from H I-column densities Kerr et al. (1986) following the precepts of Burstein & Heiles Burstein & Heiles (1982). It is barely visible in the band, although its band image is similar to the of the second galaxy. This galaxy at ) is, however, subject to heavier extinction () and hence easier to recognise in the NIR. The most distinct image is the band. The third galaxy at even higher extinction ) is not visible anymore in the band. Neither is the fourth galaxy: at and this galaxy is not even visible in the band and very faint in and .
The most important result from this search is that highly obscured, optically invisible galaxies can indeed be unveiled in the NIR and — as indicated with the distribution in the right panel of Figure 3 — found at lower latitudes than the deep optical survey. The lowest Galactic latitude at which we found a galaxy is and .
5 Galaxies detected in H I
NIR surveys are the only tools that will identify early-type galaxies and therewith uncover the cores of massive groups and clusters at very low-latitudes. In addition, highly obscured spiral galaxies should be detectable with these surveys as well. Such identifications will proof important in connection with the systematic blind H I survey currently conducted with the Multibeam Receiver (13 beams in the focal plane array) at the 64 m Parkes telescope: a deep survey with a detection limit of 10 mJy is being performed in the most opaque region of the southern Milky Way (; ) for the velocity range of 12000 km s-1Staveley-Smith (1997). Roughly 3000 detections are predicted. Hardly any of them will have an optical counterpart. However, at these latitudes many might be visible in the NIR. The combination of data from these two surveys, i.e., NIR photometry with H I-data (velocity and linewidth) will proof particularly interesting because it will allow the extension of peculiar velocity data into the ZOA via the NIR Tully – Fisher relation.
Only a few cross-identifications were possible with the data available from both surveys by June 1997. But we could identify thirteen galaxies detected blindly in H I on existing DENIS images. Four of them are visible in the , , , and bands. The other galaxies are only seen in the NIR. Four of them need further confirmation.
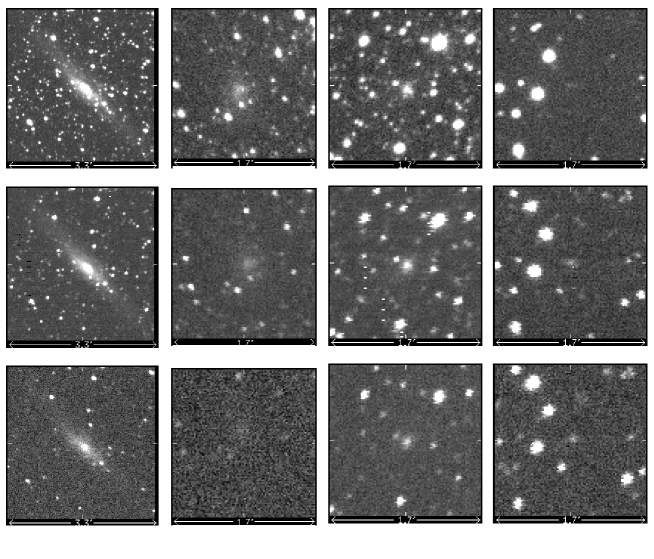
Figure 5 shows four examples of the candidates. The first galaxy is a nearby () ESO-Lauberts galaxy (L223-12) at and . It is very impressive in all three NIR passbands (note the larger image scale for this galaxy, i.e., instead of ). The second galaxy at ) is slightly more distant (). This galaxy has also been identified in and is quite distinct in and . The third galaxy at had been detected by us as an OFF-signal at during pointed H I observations in the ZOA. It has no optical counterpart but can be clearly seen in all three NIR passbands. The last example is an uncertain NIR counterpart at ) of a galaxy detected in H I at . It is barely visible in the band.
Although the present data is scarce, NIR counterparts of H I detected, highly obscured galaxies certainly seem to merit a systematic exploitation for large-scale structure investigations.
6 Conclusion
Our pilot study illustrates the promises of using the NIR surveys for extragalactic large-scale studies behind the ZOA as well as for the mapping of the Galactic extinction.
At intermediate latitudes and extinction (, ) optical surveys remain superior for identifying galaxies. However, the NIR luminosities and colours together with extinction data from the NIR colours will prove invaluable in analysing the optical survey data and their distribution in redshift space, and in the final merging of these data with existing sky surveys. Despite the high extinction and the star crowding at these latitudes, , and photometry from the survey data can be successfully performed at these low latitudes and lead, for instance, to the preliminary , and galaxy luminosity functions in A3627.
At low latitudes and high extinction ( and ) the search for ‘invisible’ obscured galaxies on existing DENIS-images implicate that NIR-surveys can trace galaxies down to about . The band was found to be optimal for identifying galaxies up to , although this might change in favour of with the new cooling system. NIR surveys can hence further reduce the width of the ZOA. This is furthermore the only tool that permits the mapping of early-type galaxies — tracers of density peaks — at high extinction.
The combination of two different surveys, i.e., NIR data for highly obscured spiral galaxies detected in a systematic blind H I survey — a fair fraction could indeed be re-identified on DENIS-images — allows the mapping of the peculiar velocity field in the ZOA through the NIR Tully – Fisher relation. This will be pursued as well at intermediate latitudes () with pointed H I observations of optically identified spiral galaxies. About 300 spiral galaxies have alrady been detected (Kraan-Korteweg et al. 1997).
Whether the systematic identification of ZOA galaxies from the DENIS survey must be performed by visual examination or whether galaxies can be successfully extracted using classical algorithms (Mamon et al. 1997b; 1998) or artificial neural networks (Bertin & Arnouts 1996, Bertin, in these proceedings) or a combination of both requires further exploration.
Acknowledgements.
We thank Jean Borsenberger for providing bias subtracted, flat fielded DENIS images, Emmanuel Bertin for supplying recent updates of his SExtractor software package, and Eric Copet for providing software to display Figures 4 and 5.References
- Bertin & Arnouts (1996) Bertin, E., Arnouts, S., 1996, Astr. Astrophys. Suppl. Ser. 117, 398
- Burstein & Heiles (1982) Burstein D., Heiles C., 1982, Astron. J. 87, 1165
- Cardelli et al. (1989) Cardelli J.A., Clayton G.C., Mathis J.S., 1989, Astrophys. J. 345, 245
- Epchtein (1997) Epchtein, N., 1997, in The Impact of Large Scale Near-Infrared Surveys p. 15, eds. F. Garzon, N. Epchtein, A. Omont, W.B. Burton, B. Persi, Kluwer: Dordrecht.
- Epchtein et al. (1997) Epchtein, N., et al., 1997, Messenger, 87, 27
- Gardner et al. (1996) Gardner, J.P., Sharples, R.M., Carrasco, B.E., Frenk, C.S., 1996, MNRAS 282, L1
- Kerr et al. (1986) Kerr, F.J., Bowers, P.F., Jackson, P.D., Kerr, M., 1986, Astr. Astrophys. Suppl. Ser. 66, 373
- Kraan-Korteweg & Woudt (1994) Kraan-Korteweg, R.C., Woudt, P.A., 1994, in Unveiling Large-Scale Structures Behind the Milky Way, p. 89, eds. C. Balkowski, R.C. Kraan-Korteweg, ASP Conf. Ser. 67
- Kraan-Korteweg et al. (1994) Kraan-Korteweg R.C., Loan A.J., Burton W.B., Lahav O., Ferguson H.C., Henning P.A., Lynden-Bell D., 1994, Nature 372, 77
- Kraan-Korteweg et al. (1995) Kraan-Korteweg, R.C., Fairall, A.P., Balkowski, C., 1995, Astr. Astrophys. 297, 617
- Kraan-Korteweg et al. (1996) Kraan-Korteweg R.C., Woudt P.A., Cayatte V., Fairall A.P., Balkowski C., Henning P.A., 1996, Nature 379, 519
- Kraan-Korteweg et al. (1997) Kraan-Korteweg, R.C., Woudt, P.A., Henning, P.A., 1997, PASA 14, 15
- Lauberts (1982) Lauberts, A. 1982, The ESO/Uppsala Survey of the ESO (B) Atlas, ESO: Garching
- Mamon (1994) Mamon G.A., 1994, in Unveiling Large-Scale Structures Behind the Milky Way, p. 53, eds. C. Balkowski, R.C. Kraan-Korteweg, ASP Conf. Ser. 67
- Mamon et al. (1997a) Mamon, G.A., Banchet, V., Tricottet, M. Katz, D., 1997a, in The Impact of Large-Scale Near-Infrared Surveys, p. 239, eds. F. Garzon, N. Epchtein, A. Omont, W.B. Burton, B. Persi, Kluwer: Dordrecht (astro-ph/9608077)
- Mamon et al. (1997b) Mamon, G.A., Tricottet, M., Bonin, W., Banchet, V., 1997b, in XVIIth Moriond Astrophysics Meeting on Extragalactic Astronomy in the Infrared, p. 369, eds. G. A. Mamon, Trinh Xuân Thuân, and J. Trân Thanh Vân, Editions Frontières (Gif-sur-Yvette)
- Mamon et al. (1998) Mamon, G.A., Borsenberger, J., Tricottet, M., Banchet, V., 1998, in these proceedings
- (18) Mobasher, B., Trentham, N., 1997, MNRAS , in press (astro-ph/9708226)
- Schröder et al. (1997) Schröder, A., Kraan-Korteweg, R.C., Mamon, G.A. Ruphy, S., 1997, in XVIIth Moriond Astrophysics Meeting on Extragalactic Astronomy in the Infrared, p. 381, eds. G. A. Mamon, Trinh Xuân Thuân, and J. Trân Thanh Vân, Editions Frontières (Gif-sur-Yvette), (paper I, astro-ph/9706093)
- Staveley-Smith (1997) Staveley-Smith, L., 1997, PASA 14, 111
- Strutskie et al. (1997) Strutskie, M.F., et al. 1997, in The Impact of Large Scale Near-Infrared Surveys, p. 25, eds. F. Garzon, N. Epchtein, A. Omont, W.B. Burton, B. Persi, Kluwer: Dordrecht
- Woudt (1997) Woudt, P.A., 1997, Ph.D. thesis, Univ. of Cape Town.
- Woudt et al. (1997) Woudt, P.A., Kraan-Korteweg, R.C., Fairall, A.P., Böhringer, H., Cayatte, V., and Glass, I.S., 1997, Astr. Astrophys., in press