The LMC Microlensing Events: Evidence for a Warped and Flaring Milky Way Disk?
Abstract
The simplest interpretation of the microlensing events towards the Large Magellanic Cloud detected by the MACHO and EROS collaborations is that about one third of the halo of our own Milky Way galaxy exists in the form of objects of around solar mass. There are grave problems with this interpretation. A normal stellar population of solar mass stars should be visible. The other obvious candidate for the lenses is a population of white dwarfs. But, the precursor population must have polluted the interstellar medium with metals, in conflict with current population II abundance. Here, we propose a more conventional, but at the moment more speculative, explanation. Some of the lenses are stars in the disk of the Milky Way. They lie along the line of sight to the LMC because of warping and flaring of the Galactic disk. Depending on its scalelength and ellipticity, the disk’s optical depth may lie anywhere between and . Together with contributions from the LMC disk and bar and perhaps even intervening stellar contaminants, the total optical depth may match the data within the uncertainties. Microlensing towards the LMC may be telling us more about the distorted structure and stellar populations of the outer Milky Way disk than the composition of the dark halo.
1 INTRODUCTION
The MACHO and EROS experiments are monitoring the lightcurves of millions stars in the nearby Large Magellanic Cloud (LMC) searching for examples of gravitational microlensing by massive compact objects that might comprise the halo of our own Galaxy (Alcock et al. (1993); Alcock et al. 1997a ). Recently, the MACHO group has announced the provisional discovery of six more events (Axelrod (1997)), taking the total to fourteen events over the past four years. The tentative estimate of the optical depth to microlensing is about with an uncertainty of perhaps . This result must be treated with some reserve as it is based both on a preliminary event set and on the efficiency curves calculated from the two-year data-set. The optical depth may fall still lower once the four-year efficiencies become available. If the lenses lie in the halo, then the typical mass of a lens is around solar masses. The lensing population is responsible for roughly a third of the overall mass of the halo within fifty kiloparsecs (Alcock et al. 1997a ). These innocent-looking statements do not sit comfortably with other well-established astronomical facts. First, it is hard to understand what kind of astrophysical objects comprise the lensing population, as normal stars, red dwarfs and white dwarfs are not believable (Graff & Freese (1996); Kawaler (1996); Gibson & Mould (1997); Fields, Mathews & Schramm (1997)). Primordial black holes remain possible, although this suggestion faces a well-known tuning problem (Carr (1977)). Second, if this simple interpretation were correct, it would indicate that the bulk of the dark baryons are stars, whereas there is ample evidence that as late as a redshift of one half, most of the baryons were still in gaseous form (the amount of hot gas in clusters is at least as large as the maximum abundance of baryons permitted by primordial nucleosynthesis). Third, the simple interpretation implies that our dark halo has two different but comparable components – dark stars and something else, with particle dark matter as the leading possibility – whereas Occam’s razor would prefer a single component.
2 THE WARPED AND FLARING DISK OF THE MILKY WAY
The aim of this Letter is to suggest a more conventional, albeit speculative, possibility: Many of the lenses lie in the warped and flaring disk of the Milky Way and are an ordinary stellar population. Together with contributions from other foreground stellar populations, they provide the microlensing optical depth detected by the observers. In particular, Sahu (1994) pointed out that some of the lenses may be in the stellar disk and bar of the LMC itself. The optical depth to microlensing of the LMC disk and bar is at most (Alcock et al. 1997a ; Gould (1995)). Gates et al. (1998) have put forth the possibility that hitherto undetected stellar populations in the spheroid or thick disk may contribute to the microlensing optical depth. Zaritsky & Lin (1997) have associated a feature on the colour-magnitude diagram with a possible stellar population lying some 15 kpc in front of the LMC in a band of material associated with the Magellanic Stream. They have estimated its optical depth may be of the order , although others have contested this interpretation (Alcock et al. 1997b ). Our suggestion is that the Milky Way disk may provide a contribution of up to . Previous investigators estimated the thin disk to have an optical depth of by idealising it as a flat exponential disk of uniform scale-height (Alcock et al. 1997a ). This is likely to be a serious underestimate, as the Milky Way disk shows very substantial deviations from flatness. For example, the layer of neutral hydrogen gas is severely warped beyond the solar circle (Burton (1988)). The midplane of the gas and the stellar disk falls to 1.0 - 1.5 kpc below the Galactic equator in the south (Reed (1996)). Beyond 15 kpc, it bends back to the equatorial plane in the south, while continuing to rise to more than 5 kpc out of plane in the north. The Milky Way disk also flares strongly beyond the solar circle. The scale-height of the neutral hydrogen increases by a factor of ten on moving outwards from the solar circle to Galactocentric radii about 25 kpc (Wouterloot et al. (1990)).
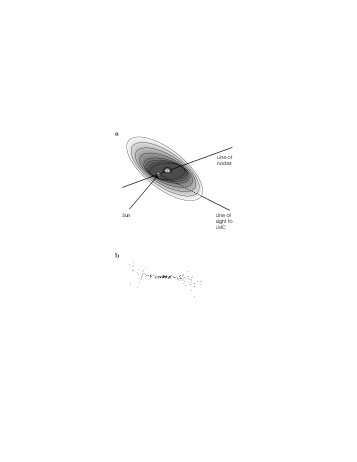
Figure 1 shows the idea put forward in this paper in pictorial form. The warping and flaring of the Milky Way stellar disk can enhance the density of material along the line of sight towards the LMC. To estimate the importance of this effect, let us model the Milky Way disk as a declining exponential in Galactocentric radius . The vertical profile of the thin disk follows roughly a hyperbolic-secant squared profile whereas the thick disk is well-modelled by an exponential profile in height above or below the midplane of the warp . A reasonably realistic density law – at least locally – is (Gould, Bahcall & Flynn (1997))
| (1) |
Both the warp and the flares of the thin and thick disks and vary with Galactocentric radius. The fractional contributions of the thin and thick disk to the midplane density are denoted by and . At outset, let us emphasise that though some of the important parameters defining the Milky Way disk are securely established, others are much more doubtful. To give the reader a feeling for the likely uncertainties, we shall use the basic density law (1) to generate three sets of models that are possible representations of the Milky Way disk. At least, the overall normalisation is reasonably well-known. We choose it to recover the column density of the thin and thick disks at the solar radius (kpc) of . This is slightly higher than the recent determination from analysis of Hubble Space Telescope (HST) fields (Gould, Bahcall & Flynn (1997)), but entirely consistent with dynamical estimates. For example, Gould (1990) reckons the total mass of the disk is of which is in gas. The remainder is in the stars of the thin and thick disk and available for microlensing. Over the region of interest, the warp is approximated by a single sine curve with an amplitude that rises linearly with distance from the Solar circle and reaches 1.5 kpc at a Galactocentric radius of 15 kpc. The scale-height of the thin disk at the Sun is 350 pc, whereas the scale-height of the thick disk is 700 pc (Gould, Bahcall & Flynn (1997)). Both the thin and the thick disk are allowed to flare linearly so that the scale-height increases by a factor of ten by a Galactocentric radius of 25 kpc. Our first set of models (labelled A in Table 1) have a fractional contribution of thick disk and thin disk, as suggested by the most recent HST data (Gould, Bahcall & Flynn (1997)). Our second set of models (labelled ‘B’) are identical except for a differing relative contribution of for the thick and thin disks. This is the older, traditional normalisation that predates the recent HST work. The third set of models (labelled ‘C’) are identical to A, but have a more modest flare – the scale-height increases by a factor of five rather than ten as the distance increases threefold. Of all the poorly established Galactic parameters, the disk’s radial scale-length is the most significant for the microlensing observables. The scale-length is different for different stellar populations but probably lies within the range 2.5 to 5.5 kpc (Gilmore, King & van der Kruit (1990); Kimeswenger et al. (1993); Ortiz & Lepine (1993)). Rather than mediate between the different claims of different data-sets, Table 1 presents results for the broad range of possible scale-lengths suggested by the observations. The microlensing optical depth is highest for the strongly flared models with the higher fractional contributions from the thick disk. If the Milky Way disk is circular, its optical depth may be as high as . If the Milky Way is slightly elliptical with the Sun lying on the minor axis – as has been suggested on dynamical grounds (Kuijken & Tremaine (1994)) – then the optical depth may be as high as .
Let us remark that equation (1) describes a model with an exponential decline in the midplane density. As the scale-height depends on radius, the column density increases somewhat on moving outward from the solar circle. Face-on spiral disks often have column densities that are reasonably well-fit by exponential laws within the galaxy’s optical edge. This however has the status of a rule-of-thumb, rather than an immutable physical law. In fact, examination of the infra-red light profiles (which trace the mass better than the visible) of large samples of of field spirals shows that deviations of up to 50% from best fit exponentials are quite common (Mathewson et al. (1992)). Additionally, severe lopsidedness () and some degree of ellipticity () are frequent in late-type spirals (Mathewson et al. (1992); Rix & Zaritsky (1995)). It is also the case that merging and interacting galaxies can show very large deviations from simple exponential disks. While the Milky Way is not presently undergoing a major merger, the estimated mass of the Sagittarius dwarf galaxy continues to increase (Lin (1996)), leading one to believe that the damage it has inflicted on the Milky Way disk may be larger than originally suspected. Numerical simulations of sinking satellites (Quinn & Goodman (1996)) show that a very characteristic effect of accretion is the flaring of fragile galactic disks. This raises the possibility that the optical depth of the Milky Way disk might be still higher than the values reported in Table 1. Simple exponential disk models may not be an accurate guide to the outer parts.
Alone, the values in Table 1 are lower than the observations. Taken together with the contribution of the LMC itself (Sahu (1994)) and the foreground population (Zaritsky & Lin (1997)), the optical depth may match or even exceed the observations. It is also possible that the experimental efficiency is imperfectly calibrated – as is suggested by the serious discrepancy between observational and theoretical estimates of the optical depth towards the Galactic Bulge (e.g., Evans 1997, Bissantz et al. 1997). Severe blending (c.f., Goldberg & Woźniak 1998) may be a cause of this problem. If the same problem afflicts the calibration towards the LMC, then the true optical depth may be lower than observed by a factor of two. A warped and flaring disk always makes a substantial contribution to the optical depth if the fractional normalisation of the thick disk is and if the scaleheight of the stellar warp increases by the same factor as the scaleheight of the neutral gas. Figure 2 shows the cumulative probability histogram of the MACHO four-year data (Alcock et al. 1997a ; Axelrod (1997)) of thirteen events (the binary event has been removed because it is almost certainly due to LMC self-lensing). Note that the data shows strong evidence of clumping, with over half the events possessing timescales between 30 and 45 days. This emerges naturally in our picture, as the lenses share the velocity field of the rotationally supported disk and have heliocentric distances of rougly kpc. Thus the mass distribution dominates the observed scatter in the timescales. Let us assume that the present-day mass function (PDMF) of the lenses is a Salpeter-like power-law down to before flattening off. This is the mass function determined from recent HST star-count data in high latitude fields (Gould, Bahcall & Flynn (1997)). The velocity distribution of the lenses is taken as an anisotropic Gaussian about the (asymmetric drift corrected) circular speed. Correcting for the efficiency of the experiment with the two-year efficiency curve (Alcock et al. 1997a ), our model predicts that the number of events the MACHO group would have seen over the four-year period of the experiment is . The probability of detecting an event with timescale less than in our model is plotted in Figure 2. It is overlaid on the actual timescale histogram of events. Although the fit is very good, we caution that this is not a definitive test, as halo models with sharply peaked mass functions can also give good fits.
3 DISCUSSION AND CONCLUSIONS
Our model makes bold claims and is not difficult to test. Gould (1998) has pointed out that the surface brightness map of the LMC made by de Vaucouleurs (1957) provides strict constraints on foreground structures acting as microlenses. The last detectable LMC isophote is at mag arcsec-2, so one possibility is for any intervening material to be fainter than this limit. However, de Vaucouleurs removed a smooth foreground component with a mean surface brightness of mag arcsec-2 and a mean gradient of before constructing the isophotal map. So, any foreground component that is smooth on the scale of the map (roughly ) will also have been removed. Figure 3 shows contours of surface brightness in a Hammer-Aitkof projection of our warped and flaring disk around the Galactic anti-center. A value of the mass-to-light ratio of has been assumed – quite reasonable for disk populations. It is readily seen that the surface brightness contours have negligible gradient in longitude, while the gradient in latitute at the LMC’s position is below the removed by de Vaucouleurs. The surface brightness map therefore cannot rule out smooth, extended foreground structures such a warped, flaring disk. One of the best ways of testing our model is using star counts, but it is important to appreciate that the data must be deep enough to probe the large-scale structure of the Milky Way disk. It is only recently that star count data-bases extending far enough from the solar position have been compiled. One straighforward way to test our model is to look for evidence of a stellar flare towards the Galactic anti-center. This is a conclusive test as the microlensing optical depth in our model depends strongly on the magnitude of the flare. Integrated starlight measurements may also be useful in elucidating the global structure of the Milky Way disk but are unfortunately bedevilled by uncertainties in the distribution of Galactic extinction. Directly observing the lenses may be possible. However, the typical distance modulus for lenses is around making this very challenging. A more promising possibility is to use the new large telescopes (such as the VLT) to detect stars in our warped disk. Although any estimate is necessarily somewhat model-dependent, we anticipate that probing to 22nd or 23rd magnitude in the LMC direction and looking for variations in the shape of the starcounts as a function of magnitude may be a useful diagnostic. Our model predicts the optical depth depends quite strongly on Galactic latitude. The LMC does not span much latitude itself, so the events should be spread over the whole area of the LMC disk. Towards the higher latitude Small Magellanic Cloud (SMC), this model predicts a much lower optical depth of . A test of the ratios of the optical depths to the LMC and SMC would be instructive, although the self-lensing of the SMC may need to be accurately modelled (Palanaque-Delabrouile (1998)). Since the lenses are primarily low-mass disk stars at large distances from the Sun, neither blending (di Stefano & Esin (1995)) nor parallax (Gould, Miralda-Escudé & Bahcall (1994)) effects are important.
Microlensing began as an innovative approach to identifying the nature of dark matter in our Galaxy. Our suggestion that some of the lenses responsible for the LMC microlensing events may lie in the warped and flaring disk is speculative, but it provides a coherent explanation of data that is otherwise frustratingly hard to understand. If correct, microlensing may end up teaching us more about the structure of the Galaxy than about dark matter. The high microlensing rate toward the Galactic Center has already provided further confirmation of the bar-like geometry of the Galactic bulge (Paczyński et al. (1994)). Similarly, microlensing towards the LMC may be a valuable probe of the shape and stellar populations of the outer Galactic disk. Perhaps more importantly, microlensing will have exhausted the last baryonic candidate for the halo dark matter, leaving elementary particles left over from the earliest moments as the likeliest remaining possibility.
References
- Alcock et al. (1993) Alcock C., et al., Nature, 365, 621 (1993)
- (2) Alcock C., et al., ApJ, 486, 697 (1997a)
- (3) Alcock C., et al., ApJ, 490, L59 (1997b)
- Axelrod (1997) Axelrod T., seminar at the Aspen Center for Physics
- Bissantz et al. (1997) Bissantz N., Englmaier P., Binney J.J. & Gerhard O.E., MNRAS, 289, 651 (1997)
- Burton (1988) Burton W.B., in Galactic and Extragalactic Radio Astronomy, (eds Verschuur G.L., & Kellermann K.I.) p. 295, (Springer, New-York, 1988)
- Carr (1977) Carr B.J., MNRAS, 181, 293 (1977)
- Evans (1997) Evans N.W., 1997, in Dark Matter in Astro and Particle Physics, ed. H.V. Klapdor-Kleingrothaus, Y. Ramachers (World Scientific, Singapore), p. 173
- Fields, Mathews & Schramm (1997) Fields B., Mathews G.J., Schramm D.N., ApJ, 483, 625 (1997)
- Gates et al. (1998) Gates E., Gyuk G., Holder G., Turner M.S., ApJ, in press (1998)
- Gibson & Mould (1997) Gibson B.K., Mould J.R., ApJ, 482, 98 (1997)
- Gilmore, King & van der Kruit (1990) Gilmore G., King I., van der Kruit P., The Milky Way as a Galaxy, chap 15, (Mill Valley Science Books, Mill Valley, California, 1990)
- Goldberg & Woźniak (1998) Goldberg D.M., Woźniak P.R., ApJ, submitted
- Gould (1990) Gould A., MNRAS, 244, 25 (1990)
- Gould (1995) Gould A., ApJ, 441, 77 (1995)
- Gould (1998) Gould A. 1998, ApJ, submitted
- Gould, Bahcall & Flynn (1997) Gould A., Bahcall J.N., Flynn C., 1997, ApJ, 482, 913 (1997)
- Gould, Miralda-Escudé & Bahcall (1994) Gould A., Miralda-Escudé J., Bahcall J.N., ApJ, 423, L105 (1994)
- Graff & Freese (1996) Graff D., Freese K., ApJ, 456, L49 (1996)
- Kawaler (1996) Kawaler S.D., ApJ, 467, L61 (1996)
- Kimeswenger et al. (1993) Kimeswenger S., Hoffmann B., Schlosser W., Schmidt-Kaler T., AASS, 97, 517 (1993)
- Kuijken & Tremaine (1994) Kuijken K., Tremaine S.D., ApJ, 421, 178 (1994)
- Lin (1996) Lin D.N.C., in Gravitational Dynamics (eds O. Lahav, E. Terlevich & R. Terlevich) p. 15 (Cambridge University Press, Cambridge, 1996)
- Mathewson et al. (1992) Mathewson D.S., Ford V.L., Buchhorn M., ApJSS, 81, 413-659 (1992)
- Ortiz & Lepine (1993) Ortiz R., Lepine J., AA, 279, 90 (1993)
- Palanaque-Delabrouile (1998) Palanaque-Delabrouile N. et al., AA, in press
- Paczyński et al. (1994) Paczyński B., et al., ApJ, 435, L113 (1994)
- Quinn & Goodman (1996) Quinn P.J., Goodman J., ApJ, 309, 472 (1986)
- Reed (1996) Reed B., AJ, 111, 804 (1996)
- Rix & Zaritsky (1995) Rix H-W, Zaritsky D., ApJ, 447, 82-102 (1995)
- Sahu (1994) Sahu K., Nature, 370, 275 (1994)
- di Stefano & Esin (1995) di Stefano R., Esin A.A., ApJ, 448, L1 (1995)
- (33) de Vaucouleurs G. 1957, AJ, 62, 69
- Wouterloot et al. (1990) Wouterloot J.G.A., Brand J., Burton W.B., Kwee K., AA, 230, 21 (1990)
- Zaritsky & Lin (1997) Zaritsky D., Lin D.N.C., AJ, 114, 2545 (1997)
| Model | Ellipticity | |||||
|---|---|---|---|---|---|---|
| A | 1. | |||||
| A | 0.85 | |||||
| B | 1. | |||||
| B | 0.85 | |||||
| C | 1. | |||||
| C | 0.85 |