Groups of Galaxies in the
Las Campanas Redshift Survey
Douglas L. Tucker (Fermilab)
Yasuhiro Hashimoto (Yale)
Robert P. Kirshner (CfA)
Stephen D. Landy (UC/Berkeley)
Huan Lin (Toronto)
Augustus Oemler, Jr. (OCIW)
Paul L. Schechter (MIT)
Stephen A. Shectman (OCIW)
Abstract
A “friends-of-friends” percolation algorithm has been used to extract a catalogue of density enhancements (groups) from the six slices of the Las Campanas Redshift Survey (LCRS). The full catalogue contains 1495 groups and includes 35% of the LCRS galaxy sample. A statistical sample of 394 groups has been derived by culling groups from the full sample which either are too close to a slice edge, have a crossing time greater than a Hubble time, have a corrected velocity dispersion of zero or less, or contain a 55 arcsec “orphan” (a galaxy with a “faked” redshift excluded from the original LCRS redshift catalogue due to its proximity — i.e., within 55 arcsec — of another galaxy). Median properties derived from the statistical sample include: line-of-sight velocity dispersion km s-1, crossing time , harmonic radius Mpc, pairwise separation Mpc, virial mass , total group -band luminosity , and -band mass-to-light ratio .
1 The Las Campanas Redshift Survey (LCRS)
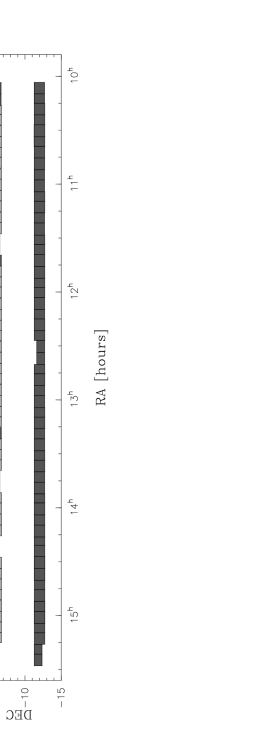
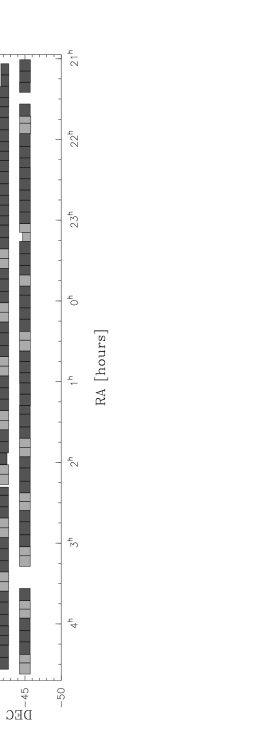
The Las Campanas Redshift Survey (LCRS; Shectman et al. 1996) is an optically selected galaxy redshift survey which extends to a redshift of 0.2 and which is composed of a total of 6 alternating slices, 3 each in the North and South Galactic Caps. Now completed, the LCRS contains 26,418 galaxy redshifts, of which 23,697 lie within the official geometric and photometric limits of the survey. Accurate -band photometry and sky positions for program objects were extracted from CCD drift scans obtained on the Las Campanas Swope 1-m telescope; spectroscopy was performed at the Las Campanas Du Pont 2.5-m telescope, originally via a 50-fiber Multi-Object Spectrograph (MOS), and later via a 112-fiber MOS. For observing efficiency, all the fibers were used, but each MOS field was observed only once. Hence, the LCRS is a collection of 50-fiber fields (with nominal apparent magnitude limits of ) and 112-fiber fields (with nominal apparent magnitude limits of ); see Figure 1. Thus, selection criteria vary from field to field, but these selection criteria are carefully documented and therefore easily taken into account. Observing each field only once, however, created an additional selection effect: the protective tubing of the individual fibers prevented the spectroscopic observation of both members of galaxy pairs within 55 arcsec of each other. Hence, groups and clusters can be undersampled, potentially causing physical groups to be split by a “friends-of-friends” percolation algorithm and resulting in the mis-estimate of general group properties. We will return to this problem in the next section.
2 Extracting The Group Catalogue
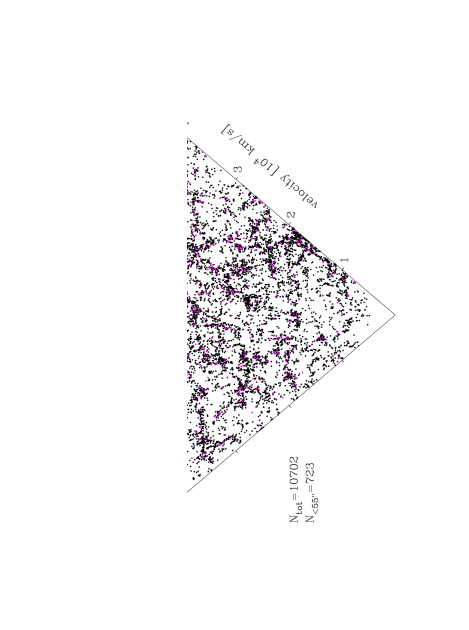
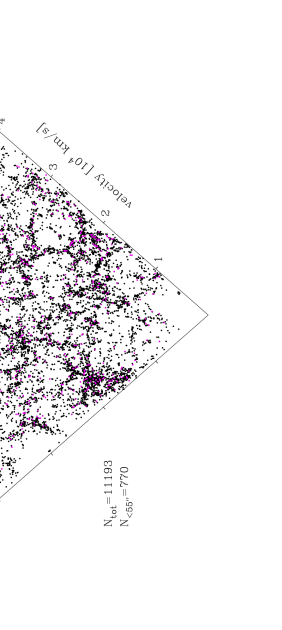
In constructing the LCRS Group Catalogue, we have considered only those LCRS galaxies within the official geometric and photometric borders of the survey; we have furthermore limited this sample to galaxies having redshifts in the range
| (1) |
and luminosities in the range
| (2) |
(see Figure 2).
Moreover, each of the galaxies which were excluded from LCRS redshift catalogue due to the fiber-separation effect has been re-introduced into the sample by assigning it a redshift equal to the redshift of its nearest neighbor convolved with a gaussian of width km s-1 (roughly the mean line-of-sight velocity dispersion of a cleaned LCRS group sample which excludes these 55-arcsec “orphans”). The re-included galaxies subscribe to all the same limits imposed upon the original sample.
The group catalogue was extracted using a standard “friends-of-friends” percolation algorithm (Huchra & Geller 1982) modified for comoving distances and for field-to-field sampling variations. To take into account the latter, the projected separation and velocity difference linking parameters, and , respectively, were scaled according to the following equations (which assure that the ratio is independent of environment):
| (3) |
where and are and , respectively, for a given fiducial field at at given fiducial redshift, and where is a linking scale which takes into account variations in galaxy sampling rate. It is defined by
| (4) |
where is the number density of galaxies one would expect to observe at redshift in field for a homogeneous sample having the same selection function and sampling fraction as the LCRS redshift catalogue; is for a given fiducial field at a given fiducial redshift. Due to the simple field characteristics, we have chosen the fiducial field to have 100% sampling, flux limits of , and the same luminosity function as the LCRS Northern 112-fiber sample (Lin et al. 1996); since it is roughly the median redshift of the survey, we have chosen the fiducial redshift to be 30,000 km s-1.
Finally, to avoid group-member incompleteness at the extremal distances of the sample, only groups within
| (5) |
were admitted into the final group catalogue.
3 Properties of LCRS Groups
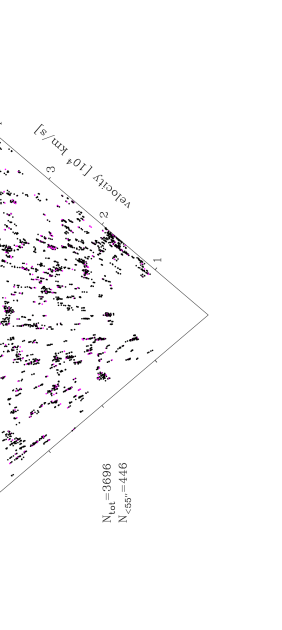
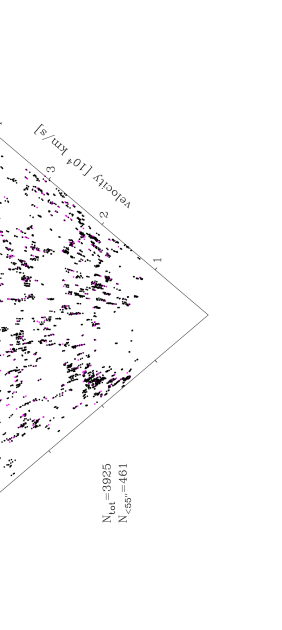
The full catalogue contains 1495 groups and includes 35% of the LCRS galaxy sample (Figures 3 and 4). A statistical sample of 394 groups was extracted from the full sample by culling groups which either were too close to a slice edge, had a crossing time greater than a Hubble time, had a corrected velocity dispersion of zero or less, or contained a 55 arcsec “orphan”. Some of the characteristics of the statistical sample are listed in Table I, including medians of the following group properties:
-
•
The group line-of-sight velocity dispersion, , corrected for relativistic effects (Harrision 1974) and for estimated random errors in the LCRS redshifts.
-
•
The mean pairwise separation,
(6) where is the comoving distance to the group, is the angular separation between group members and , and and are the respective weights for and ,
(7) This weighting factor helps to counteract a bias resulting from a group straddling two fields with different galaxy sampling characteristics.
-
•
The harmonic radius,
(8) -
•
The crossing time for the group,
(9) in units of the Hubble time ().
-
•
The group’s virial mass,
(10) where is the gravitational constant.
-
•
The total group luminosity in the LCRS -band, , corrected via the selection function to account for galaxies not observed by the LCRS.
-
•
The group mass-to-light ratio in the LCRS -band, .
The above definitions are very similar to those used by Ramella, Geller, & Huchra (1989), but modified to take into account cosmological effects (due to the LCRS sample depth) and field-to-field sampling variations.
Table I lists the properties of LCRS groups from the whole statistical sample, of those groups from just the 50-fiber fields, of those groups from just the 112-fiber fields, and of those groups which straddle the border of a 50-fiber and a 112-fiber field; also tabulated are the general properties from an earlier incarnation of the LCRS group catalogue [Tucker 1994 (T94)]. The 50-fiber-field groups appear to be typically a little larger than the 112-fiber-field groups in both projected size ( & ) and velocity extent (), indicating that the effective linking scale for the 50-fiber fields may be systematically larger than that for the 112-fiber fields, in spite of efforts to avoid such a bias. On the other hand, much of the apparent divergence of the 50/112 group properties can be attributed to this sample’s aberrantly high median velocity dispersion (e.g., recall ), which in turn may be due to the small size of the 50/112 statistical sample or to the difficulties of properly extracting groups which straddle the border between a 50-fiber and a 112-fiber field.
Finally, for comparison, we have also listed in Table I the median group properties from several other group catalogues. These include those based upon the the original CfA redshift survey [CfA1; Nolthenius & White 1987 (NW87); Noltenius 1993 (N93); Moore, Frenk, & White 1993 (MFW93)], the Southern Sky Redshift Survey [SSRS; Maia, da Costa, & Latham 1989 (MdCL89)], and the CfA extension to [CfA2; Ramella, Geller, & Huchra 1989 (RGH89); Ramella, Pisani, & Geller 1997 (RPG97)].
References
-
Harrison, E. R. 1974, ApJ, 191, L51
-
Huchra, J. P., and Geller, M. J. 1982, ApJ, 257, 423
-
Lin, H., Kirshner, R. P., Shectman, S. A., Landy, S. D., Oemler, A., Tucker, D. L., and Schechter, P. L. 1996, ApJ, 464, 60
-
Maia, M. A. G., da Costa, L. N., and Latham, D. W. 1989, ApJS, 69, 809 (MdCL89)
-
Moore, B., Frenk, C. S., and White, S. D. M. 1993, MNRAS, 261, 827 (MFW93)
-
Nolthenius, R., and White, S. D. M. 1987, MNRAS, 225, 505 (NW87)
-
Nolthenius, R. 1993, ApJS, 85, 1 (N93)
-
Ramella, M., Geller, M. J., and Huchra, J. P. 1989, ApJ, 344, 57 (RGH89)
-
Ramella, M., Pisani, A., Geller, M. J. 1997, AJ, 113, 483 (RGP97)
-
Shectman, S. A., Landy, S. D., Oemler, A., Tucker, D. L., Lin, H., Kirshner, R. P., and Schechter, P. L. 1996, ApJ, 470, 172
-
Tucker, D. L. 1994, Ph.D. dissertation, Yale University (T94)
Acknowledgments
This research has made use of the NASA/IPAC Extragalactic Database (NED), which is operated by the Jet Propulsion Laboratory, Caltech, under contract with the National Aeronautics and Space Administration.


![[Uncaptioned image]](/html/astro-ph/9711176/assets/x9.png)