1 Introduction
The hot gas in clusters of galaxies emits thermal bremsstrahlung emission that can be probed directly through measurements in the X-ray band. Another probe of this gas comes from its effect on the cosmic microwave background radiation (CMBR): the hot cluster electrons inverse Compton scatter the CMBR photons and thereby distort the background radiation from its blackbody spectral form. Although this, the Sunyaev-Zel’dovich (SZ) effect, is quite small, heroic efforts during the 1980’s resulted in its detection in three moderately distant clusters of galaxies: A665, A2218, and CL 0016+16. It is well known that one of the purposes of conducting such measurements is to determine the Hubble constant. The technique has generated considerable interest because it is independent of all other rungs of the cosmic distance ladder and is effective over a wide range of redshifts: 0.02 to 1.
In the last few years, the development of sensitive new instruments for measuring the SZ effect in clusters has sparked a revolution in the field. Current radio interferometric arrays can now detect and map the SZ effect in even distant clusters (). Another important development in this field was the launch of the ASCA satellite with its broadband X-ray imaging and spectroscopy that allows, for the first time, accurate determination of gas temperatures in distant galaxy clusters. This information is critically important to the interpretation of the SZ effect, since the determination of depends on the square of the cluster gas temperature. In the following I report on the progress that has been made in determining the cosmic distance scale from the SZ effect and I highlight what has been learned about galaxy clusters from these investigations.
2 Current Results
There are eight galaxy clusters with published measurements of the SZ effect based on single-dish radiometry, infrared bolometry, or radio interferometry. Table 1 summarizes the derived values (and 68% confidence level errors) from the several clusters, ordered by increasing redshift and determined under the following assumptions:
-
1.
spherical symmetry
-
2.
gas density distribution given by
-
3.
isothermal gas distribution
-
4.
unclumped
-
5.
Relativistic corrections for the CMBR intensity change and the X-ray bremsstrahlung spectral emissivity, which result in reductions of order 10% in the derived values, are both included.
Cluster () Reference Coma 0.0232 Herbig et al. 1996 Abell 2256 0.0581 Myers et al. 1997 Abell 478 0.0881 Myers et al. 1997 Abell 2142 0.0899 Myers et al. 1997 Abell 2218 0.171 Birkinshaw & Hughes 1994 Abell 2218 0.171 Jones 1995 Abell 665 0.182 Hughes & Birkinshaw 1998 Abell 2163 0.201 Holzapfel et al. 1997 CL 0016+16 0.5455 Hughes & Birkinshaw 1997
The average value of these nine measurements weighted by the individual errors is . However, this value is potentially quite strongly biased by systematic effects, as I discuss below.
3 Systematic Uncertainties
Birkinshaw & Hughes (1994) and Holzapfel et al. (1997) allowed for large scale radial temperature gradients when analyzing the SZ effect and X-ray data for A2218 and A2163, respectively. Both groups found that, for temperature profiles that fell with radius, the value of derived under an isothermal assumption would underestimate the true value by 20%–30%.
If cluster gas is clumped, then X-ray emissivity will be increased relative to SZ by a factor greater than unity. In this case the value of derived assuming an unclumped gas distribution will be an upper limit to the true value. Holzapfel et al. (1997) used X-ray spectral fits to constrain the amount of isobaric clumping in A2163 and found that a reduction in of only 10% from the unclumped case was allowed.
The peculiar motion of clusters relative to the Hubble flow introduces an additional distortion to the CMBR spectrum usually referred to as the “kinematic” SZ effect. For a cluster with a peculiar velocity of and temperature of the strength of the kinematic SZ effect would be 9% of the thermal effect in the Rayleigh-Jeans portion of the CMBR spectrum. Since the SZ effect intensity enters as a square in the equation determining , the kinematic SZ effect could introduce up to a 20% correction. Peculiar velocities are unlikely to be correlated for clusters that are widely distributed in redshift and position, so this effect would result in an additional random uncertainty in for any single cluster.
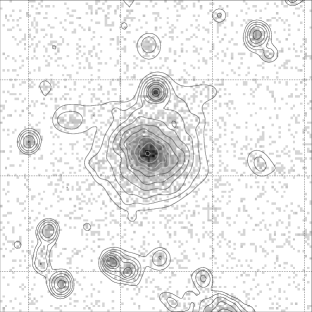
It is now clear based on ROSAT observations that many, if not most, clusters show evidence for complex surface brightness distributions. In recent work Hughes & Birkinshaw (1997) analyze CL 0016+16, a distant cluster that displays strong ellipticity (see the left panel of Fig. 1). They fit elliptical isothermal- models to the X-ray image and deproject under the assumption that the three-dimensional structure of the cluster is axisymmetric, either prolate or oblate. If the symmetry axis is assumed to lie in the plane of the sky, then the different assumptions about the shape of the gas distribution yield values for that differ by 17%, which is the percentage difference between the major and minor axis lengths of the cluster. As the symmetry axis of the ellipsoid is allowed to vary toward the line-of-sight, then the intrinsic cluster ellipticity (defined as the ratio of major to minor axis lengths) grows increasingly larger, as does the uncertainty on , which is shown graphically in the right panel of Fig. 1. In order to bound the uncertainty, Hughes & Birkinshaw argue that it is unlikely for a cluster to have an intrinsic ellipticity greater than about 1.5, based on observations of other galaxy clusters. This limit results in a uncertainty in of for CL 0016+16 from morphology alone.
To ensure that the effects of unknown geometry and arbitrary inclination are uncorrelated from cluster to cluster, it is essential that the cluster sample for determining be selected properly. For example, as pointed out by Birkinshaw, Hughes, & Arnaud (1991), it is important that clusters not be selected based on the strength of their SZ effect signal or central X-ray surface brightness, since this would result naturally in a bias toward prolate clusters with their long axes aligned to the line-of-sight. Recent cluster samples for determination have been selected based on the strength of their integrated X-ray flux from surveys by the Einstein Observatory or ROSAT. These samples should be relatively unbiased.

4 A Value for the Hubble Constant
When known systematic uncertainties are included, the best estimate of the Hubble constant becomes
where the range accounts for biases from temperature gradients (+30%) and clumped gas (10%). The quoted random error includes observational errors combined in quadrature with the random systematic errors from peculiar velocities (7%) and geometry/inclination (7%), which have been reduced from the values given in §3 by where is the number of clusters. Future observational efforts should be directed toward measuring the large scale temperature gradients in galaxy clusters since this is the single largest uncertainty in the determination of from the SZ effect.
References
- [1] Birkinshaw, M. & Hughes, J.P. (1994), Ap.J., 420, 33.
- [2] Birkinshaw, M., Hughes, J.P., & Arnaud, K. A. (1991), Ap.J., 379, 466.
- [3] Herbig, T., et al. (1995), Ap.J., 449, L5.
- [4] Holzapfel, W.L., et al. (1997), Ap.J., 480, 449.
- [5] Hughes, J.P. & Birkinshaw, M. (1997), Ap.J., submitted.
- [6] Hughes, J.P. & Birkinshaw, M. (1998), Ap.J., in preparation.
- [7] Jones, M. (1995), Astrophy. Lett. Comm., 6, 347. Ap.J., 447, 8.
- [8] Myers, S.T., et al. (1997), Ap.J., 485, 1.
This research was partially supported by NASA LTSA Grant NAG5-3432.