Testing the Invariance of Cooling Rate in Gamma-Ray Burst Pulses
Abstract
Recent studies have found that the spectral evolution of pulses within gamma-ray bursts (GRBs) is consistent with simple radiative cooling. Perhaps more interesting was a report that some bursts may have a single cooling rate for the multiple pulses that occur within it. We determine the probability that the observed “cooling rate invariance” is purely coincidental by sampling values from the observed distribution of cooling rates. We find a probability that we would randomly observe a similar degree of invariance based on a variety of pulse selection methods and pulse comparison statistics. This probability is sufficiently high to warrant skepticism of any intrinsic invariance in the cooling rate.
Introduction
Much progress has been made in the past few years regarding the spectral evolution of gamma-ray bursts. Early studies described the time evolution of a single hardness parameter in typically fewer than 20 bursts [1-3]. Use of the BATSE LAD data has allowed time-resolved spectroscopy of approximately one hundred bursts [4]. It has become clear that the time-integrated spectra is not at all representative of the time-resolved spectra [5,6]. Several new trends have also been found in analyses of the time-resolved spectra. In particular, Liang & Kargatis [7] discovered a unique relationship between (the energy at which the spectrum is a maximum) and the photon fluence , where
| (1) |
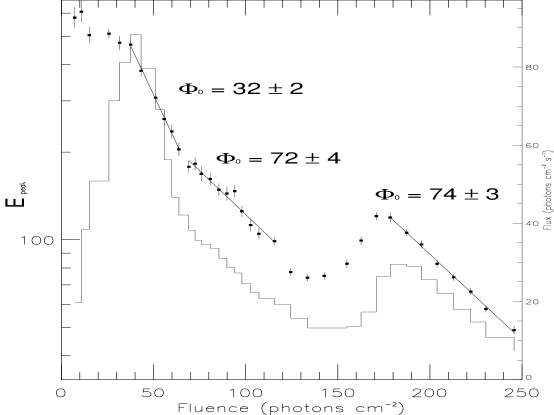
and represents an effective cooling constant. It was also reported that appeared to be invariant from pulse to pulse within some multipulse bursts [7]. Figure 1 shows an example of this observed invariance in cooling rate for GRB 921207 as seen by BATSE LAD 0.
If the decay of with respect to is assumed to be the radiative cooling of a plasma, then energy conservation dictates a proportionality between and the number of cooling leptons in the plasma [7]. This in turn suggests that multiple pulses observed within a single burst originate from the same plasma. Verification of the observed “cooling rate invariance” would have serious implications on gamma-ray burst models. A scenario in which a single plasma emits several pulses of radiation is difficult to reconcile with many catastrophic burster models [8]. As a strict test of the conclusions of Liang & Kargatis [7] we determine the probability that the degree of invariance that they observed in their bursts would originate from bursts with no intrinsic invariance at all. As described below, this probability is high enough to raise doubts about any intrinsic invariance.
I Testing the Invariance of Cooling Rates within Bursts
Liang & Kargatis [7] fitted exponential decays of with respect to fluence in multipulse bursts and reported that the decay constant did not change from pulse to pulse in many of their bursts. We tested this conclusion by randomly sampling values from the observed distribution of . Examining the first pulse of 57 bursts, we found that we can approximate this distribution as ergs . We also assigned a -confidence region for each random value of based on the observed distribution .
In selecting the decays manually, it is likely that some systematic bias occurs favoring the trends we are looking for, namely well fit decays with similar decay rates. To account for this, we used two different methods for selecting pulse decays. For the case we designate “Best”, we selected the decay phases of pulses by directly examining plots of versus . For the case we designate “Worst”, we instead selected decay phases by examining plots of photon flux versus time. In both cases, however, we fit out exponential decay to versus . Thus, in the “Worst” case scenario, we have blindly selected what portions of the plot will be fit. Occasionally, there are some pulses where may actually be rising with respect to in what was chosen to be a decay phase. We discard these instances of “negative decay”. What is left serves as an extreme limit of what our final results would have been without our systematic bias.
We compared two of each bursts’ M pulses at a time using
| (2) |
and then distilled the comparisons within each burst into a single statistic to represent that burst (See Table 1 for definitions). Each of these statistics are tailored for different null hypotheses. The statistic tests if at least two pulses in a burst are similar (and thus “invariant”), while tests if all the pulses have a similar decay constant. tests for either a single good pairing or several moderately close pairings. We believe that this last statistic is the most reasonable for testing our results since it does not require that all pulses decay at the same rate (as does) but also does not discard information about multiple pulses repeating (as does). Finally, we calculated a table of probabilities P for our goodness-of-fit statistics based on random sampling from our distributions of and .
| “Best” Selection | “Worst” Selection | |
|---|---|---|
| P() | 0.065 | 0.26 |
| P() | 0.0014 | 0.13 |
| P() | 0.012 | 0.12 |
We define P to be the probability of randomly getting a value of or lower if we compare pulses drawn randomly from the global distribution of . Examining the distibution of P values for our sample of 40 “Best” multipulse bursts, we found K-S probabilities of that the observed “repetitions” occur by chance [9]. This number is much higher () if we remove our selection systematics. These high probabilities suggest that the observed invariance in cooling rate is not physical.
II Discussion
An invariant cooling rate for pulses in multipulse gamma-ray bursts is certainly an exciting possibility. Proof of such a pattern would place hard limits on burst emission mechanisms. Liang and Kargatis [7] found that 7 out of the 12 multipulse bursts in their sample were consistent with an invariant decay (difference ). However, using our “Best” selection and the goodness-of-fit measure, we expect to randomly get bursts out of 12 consistent with having an invariant decay. We conclude that no intrinsic invariance of is required to explain the observations reported in Liang and Kargatis [7]. The observed “repeating” cooling rates are consistent with being randomly selected from the observed distribution of values. While these new results do not necessarily rule out cooling rate invariance in some bursts, they do show that the observations as an ensemble do not require such an invariance.
AC thanks NASA-MSFC for his GSRP fellowship. This work is partially supported by NASA grant NAG5-3824.
References
- (1) Golenetskii, S.V. et al., Nature 306, 451 (1983).
- (2) Norris, J.P., et al., Ap. J. 301, 213 (1986).
- (3) Band, D. et al., AIP Conf. Proc. 265, 169 (1992).
- (4) Preece, R. et al., these proceedings, (1998).
- (5) Crider, A., et al., Ap. J. 479, L39 (1997).
- (6) Crider, A., Liang, E.P, & Preece, R. D., these proceedings, (1998).
- (7) Liang E., and Kargatis, V., Nature 381, 49 (1996).
- (8) Mészáros, P. & Rees, M., Ap. J. 405, 278 (1993).
- (9) Press, W.H., Teukolsky, S.A, Vetterling, W.T., & Flannery, B.P., Numerical Recipes in C, 2nd ed, Cambridge: Cambridge Univ. Press (1992).