Confronting Synchrotron Shock and Inverse Comptonization Models with GRB Spectral Evolution
Abstract
The time-resolved spectra of gamma-ray bursts (GRBs) remain in conflict with many proposed models for these events. After proving that most of the bursts in our sample show evidence for spectral “shape-shifting”, we discuss what restrictions that BATSE time-resolved burst spectra place on current models. We find that the synchrotron shock model does not allow for the steep low-energy spectral slope observed in many bursts, including GRB 970111. We also determine that saturated Comptonization with only Thomson thinning fails to explain the observed rise and fall of the low-energy spectral slope seen in GRB 970111 and other bursts. This implies that saturated Comptonization models must include some mechanism which can cause the Thomson depth to increase intially in pulses.
Introduction
While observations of gamma-ray burst counterparts appear to have determined the distance scale of these enigmatic events [1], questions regarding the emission mechanism remain unanswered. Models are tested against the newly discovered X-ray and optical power-law tails seen in two GRBs [2,3], however most of these were flexible enough to accomodate the observations. Multiple gamma-ray emission mechanisms have also been found to be consistent with the time-integrated spectra making this another poor test of GRB models.
In order to evaluate GRB models, we look to the time evolution of GRB spectra. Most spectral evolution studies have looked only at the evolution of spectral hardness, which has historically been represented by either a hardness ratio or by the peak of the spectrum, [4]. We examine this as well as the evolution of the low-energy asymptotic slope (as defined by the Band GRB function [5]). In the following section, we show that most bursts require evolution of this second parameter. Thus the shape, as well as the break energy, of the spectra evolves as a function of time. Models which were consistent with the time-integrated specta can be inconsistent with the time-resolved spectra. Below we confront first the synchrotron shock model and then the inverse Comptonization model with our time-resolved BATSE burst spectra. We find that both models are currently unable to explain our observations.
I Spectral Shape-Shifting Bursts
We first demonstrate that time-integrated burst spectra do not well represent the time-resolved spectra. Previously we have found that a minimum first-order trend in is shown to exist in at least 46 of the 79 bursts we analyzed [6]. It is possible that some higher order evolution of may occur in these bursts. To test for this, we calculated the between the time-resolved, fitted values of and the weighted average value of in each burst. We found that only 30 out of the 79 bursts are consistent with an invariant , assuming as an acceptable cutoff [7]. We conclude that the remaining 63% of the bursts have a varying , consistent with the results of [6]. Unfortunately, time-resolved values are poorly determined in a majority of the bursts in this sample.
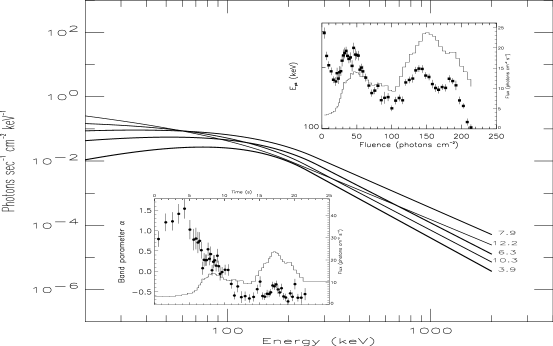
As an example of spectral shape-shifting in GRBs, we examine the early evolution of GRB 970111 (see Figure 1). We find the first several seconds to be remarkably similar to GRB 910927 (see Figure 1 of [6]). Both bursts exhibit steep positive low-energy power slopes. Fitting the Band GRB function [5] to GRB 970111, we find , a value consistent with the maximum in GRB 910927. We would expect this value of from synchrotron self-absorption. However, with synchrotron self-absorption, is either in the case of a nonthermal plasma or for a thermal plasma [8]. This mechanism cannot produce the variation of observed values.
II Synchrotron Shock Model
One prediction of synchrotron shock models is easily tested with GRB spectral data. For these models, the asymptotic low-energy photon slope (below the spectral break) should be between , in the case of an instantaneous synchrotron spectrum, and , when the spectrum is integrated over the radiative decay of electron energies [9]. These predictions are tested by Cohen et al. [9] with 11 time-integrated GRBs. In these 11 cases, the slope of the low-energy spectra is indeed in this range. However, time-resolved spectra reported in Crider et al. [6] clearly show evidence for GRB spectra which cannot be explained with this mechanism. Examination of a larger set of bursts show that many bursts have maximum values beyond the “line-of-death” () predicted by synchrotron shock models [10].
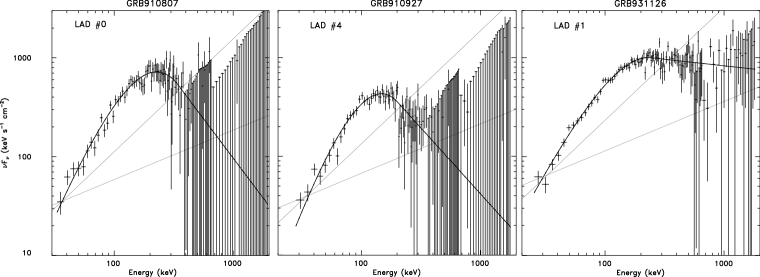
To evaluate the synchrotron shock model quantitatively, we began by finding the probabilities Q of randomly getting poorer values when fitting the Band GRB function [5] to time bins selected from GRB 910807, GRB 910927, and GRB 931126. These are respectively 0.93, 0.50, and 0.25 suggesting that the Band et al. function [5] adequately describes the observed spectra. When we instead fixed to represent the maximum slope allowed by synchrotron shock models, we found Q values of , , and , which makes this model unacceptable in explaining the data. Also, when fitting the time bin in GRB 970111 where gave Q=0.32 for the Band et al. function compared to Q= when is fixed to . Three sample spectra from these bursts are plotted in Figure 2 in a fashion similar to that of Cohen et al. [9] where the limits of the synchrotron shock model are overlayed onto the deconvolved burst spectra. This figure clearly shows that these bursts’ spectral slopes are outside the range predicted by the synchrotron shock model.
III Saturated Comptonization Model
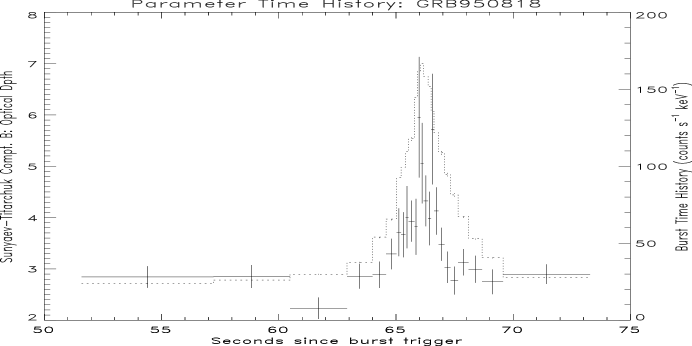
The generally decreasing nature of from values approaching is suggestive of saturated inverse Compton scattering in a plasma experiencing Thomson thinning [6,11]. However, many bursts show some evidence for an increase in at the beginning of pulses which would represent a Thomson thickening. The observed changes in cannot be attributed to statistical fluctuations or systematics. GRB 950818 is an excellent example. To show more clearly how the Thomson depth evolves in this burst, we fit it with the Sunyaev-Titarchuk model. The evolution of determined from these fits is shown in Figure 3. While this model does not often fit gamma-ray bursts well, fits with the Band GRB function [5] and comparisons with our simulated inverse Compton spectra [11] indicate that the spectral break is always below 100 keV and that should be . In this parameter space, the Sunyaev-Titarchuk model is appropriate if we ignore data above the spectral break which will be heavily influenced by any non-thermal component. The results of fitting this model to our data appear in the figure above and show that clearly increases and then falls during this burst. One means by which may rise and fall would be an initial compression of the plasma. Future research will test if this is a valid hypothesis.
IV Discussion
We have found that most bursts show some degree of spectral “shape-shifting” making the time-integrated spectrum an inadequate diagnostic of gamma-ray burst models. The high value of the low-energy spectral slope seen in some bursts and the flattening of this slope with time is incompatible with the synchrotron shock model. Similarly, simple Thomson thinning from an initial state of saturated Comptonization cannot explain the rise and fall of seen in some bursts. It may be possible to reproduce the observed spectra with a changing superposition of self-absorbed synchrotron spectra. However this has not yet been explored in detail within the construct of the blast-wave scenario.
AC thanks NASA-MSFC for his GSRP fellowship. This work is partially supported by NASA grant NAG5-3824.
References
- (1) Metzger, M.R., et al. 1997, Nature, 387, 879
- (2) Galama, T., et al. 1997, Nature, 387, 479
- (3) Djorgovski, S.G., et al. 1997, Nature, 387, 876
- (4) Liang, E.P. & Kargatis V.E. 1996, Nature, 381, 49
- (5) Band, D., et al. 1993, ApJ, 413, 281
- (6) Crider, A. et al. 1997, ApJ, 479, L39
- (7) Press, W.H., Teukolsky, S.A, Vetterling, W.T., & Flannery, B.P. 1992, Numerical Recipes in C (2nd ed; Cambridge: Cambridge Univ. Press)
- (8) Rybicki, G.B. and A.P. Lightman 1979, Radiative Processes in Astrophysics, (New York:Wiley)
- (9) Cohen, E., Katz, J. I., Piran, T., Sari, R., Preece, R. D., & Band D. L. 1997, astro-ph/9703120
- (10) Preece, R.B., et al. 1998, these proceedings
- (11) Liang, E.P., Smith, I.A., Kusunose, M., & Crider, A. 1997, ApJ, 479, L35