11.09.1 M83; 11.08.1; 11.09.4; 09.07.1; 09.13.1; 13.25.2 \offprintsM. Ehle, mehle@mpe.mpg.de 11institutetext: Max-Planck-Institut für Extraterrestrische Physik, Giessenbachstraße, 85740 Garching, Germany 22institutetext: Max-Planck-Institut für Radioastronomie, Auf dem Hügel 69, 53121 Bonn, Germany 33institutetext: Australia Telescope National Facility, P.O. Box 76, Epping N.S.W. 2121, Australia 44institutetext: Radioastronomisches Institut der Universität Bonn, Auf dem Hügel 71, 53121 Bonn, Germany
ROSAT PSPC X-ray observations of the nearby spiral galaxy M83
Abstract
The nearly face-on SBc galaxy M83 (NGC 5236) was observed for 25 ksec with the ROSAT PSPC. We detected 13 point-like sources in this galaxy, 10 of which were previously unknown, down to a limiting luminosity of erg s-1 (for D=8.9 Mpc). Eight of these sources are positionally associated with H ii regions and/or H i voids, suggesting an association with the younger stellar population, variable X-ray binaries or with hot expanding gaseous bubbles.
We measured extended X-ray radiation from almost the whole optically visible galaxy with a luminosity of erg s-1 in the energy range 0.1-2.4 keV. Approximately of this emission can be explained by undetected point-like sources. We detected diffuse soft (0.1-0.4 keV) X-ray emission due to hot gas with a luminosity of erg s-1. Comparing the diffuse soft and hard X-ray emission components, we observed a different asymmetric distribution and a slower radial decrease of the intensity profile of the soft X-ray emission. Both these results support the existence of a huge spherical gas halo of kpc radius. On the other hand, the radial scale lengths of the hard X-ray radiation, that of the thermal radio emission and the profile of the optical surface brightness are similar, favouring the idea that all these emission processes are connected to star formation in the galaxy’s disk.
M83 is the first face-on galaxy where the diffuse X-ray emission spectrum can be characterized by a two-temperature thermal plasma: a soft X-ray emitting warm ‘halo component’ of plasma temperature K and an internally absorbed hot ‘disk component’ at K which is dominating the emission in the hard (0.5-2.0 keV) ROSAT energy range. The (distance-independent) mean surface brightness of the soft diffuse emission of M83 is about twice that of NGC 253.
The electron densities in the galactic halo of M83 ( cm-3, with a volume filling factor ) are in general too low to explain the observed depolarization of the radio emission. This indicates that the ionization equilibrium might be violated, leading to higher electron densities. The combination of X-ray and radio polarization observations allows an estimate of the plasma parameter which is found to be . This result supports the hypothesis that magnetic fields play an important role for the evolution and structure of galactic gas haloes. The high energy input rate in the active star-forming disk of M83 seems to be responsible for the outflow of hot gas and the halo formation.
keywords:
Galaxies: individual: M83, haloes, ISM – ISM: general, magnetic fields – X-rays: galaxies1 Introduction
The nearby spiral galaxy M83 (NGC 5236) is a classical grand-design spiral located at a distance of 8.9 Mpc111Distance determinations of M83 have come up with rather different values; here we adopt that of Sandage & Tammann (1975) and scale all luminosities to that value. It has been the target of numerous astrophysical investigations in various spectral regimes because of its proximity. Table 1 lists some general parameters of M83.
| Parameter | Value | Reference and Comments |
| Type | SBc(s)II | Sandage & Tammann (1987; RSA) |
| R.A. (J2000) | Condon et al. (1982), central radio source | |
| Decl. (J2000) | Condon et al. (1982), central radio source | |
| Position angle | ||
| of major axis | Talbot et al. (1979) | |
| Inclination | Talbot et al. (1979) | |
| Distance | 8.9 Mpc | Sandage and Tammann (1975) |
| kpc | ||
| Size () | 29 kpc | de Vaucouleurs et al. (1976) |
| Total mass | Huchtmeier & Bohnenstengel (1981), | |
| derived from rotation curve | ||
| H i mass | Huchtmeier & Bohnenstengel (1981), | |
| integrated over the extent of the H i distribution () | ||
| Abs. blue magnitude | -21.7 | RSA Catalog of Bright Galaxies |
| erg/s | ||
| X-ray luminosity | erg/s | Einstein IPC (0.5-3.0) keV, Trinchieri et al. (1985) |
| erg/s | Einstein HRI (0.5-3.0) keV, Trinchieri et al. (1985) | |
| erg/s | Ginga (2-10) keV, Ohashi et al. (1990) | |
| erg/s | ROSAT PSPC (0.1-2.4) keV, this work |
M83 was first observed in X-rays with the Einstein observatory Imaging Proportional Counter (IPC) as part of a sample of nearby spiral galaxies to study their integrated properties (Fabbiano et al. 1984). Trinchieri et al. (1985) obtained high-resolution X-ray observations with the Einstein HRI and detected three unresolved sources and a nuclear component.
The starburst nucleus of M83 is a strong X-ray source that was detected in the Einstein observations with a luminosity of erg s-1. Trinchieri et al. (1985) suggested that the X-ray emission from the nucleus is not dominated by a contribution of massive binary star systems, but is due to a less evolved X-ray emitting population. They also discussed the possibility that a large fraction of the X-ray emission from the nucleus of M83 could be produced by thermal emission from hot shock-heated gas ejected from the nucleus, as is detected in NGC 1068 (Wilson et al. 1992), M82 (Watson et al. 1984) and NGC 253 (Fabbiano & Trinchieri 1984, Fabbiano 1988, Pietsch 1993). A further peculiarity of the nuclear region of M83 is the existence of a polar, circum-nucleus dust lane probably in a plane tilted from the galactic plane by about (Sofue & Wakamatsu 1994). Reducing the accretion to the nucleus, this ring structure might affect the nuclear star-forming activity.
The Einstein IPC observations indicated an X-ray extent comparable in size and shape to that seen in blue light. This emission component was discussed as probably due to faint individual sources (evolved stellar population, LMXBs), distributed uniformly across the disk of the galaxy (Trinchieri et al. 1985).
Ohashi et al. (1990) observed M83 in the harder X-ray energy band (2-20 keV) using the Ginga satellite. The observed spectra are similar to those of low-mass X-ray binaries (LMXBs) but significantly softer than those of X-ray pulsars. The spectra can also be described by a thermal bremsstrahlung model with a temperature of K, suggesting that a major fraction of the X-ray emission may originate from very hot gas. As the time scale for starburst activity is significantly shorter than the typical lifetime of LMXBs, Ohashi et al. find it unlikely that the high X-ray luminosity of M83 is caused by LMXBs and instead favour the idea that hot gas (both within and outside of SNRs) produces their observed X-ray spectra.
In this paper we report X-ray observations of M83 carried out with the ROSAT X-ray telescope (Trümper 1983, Aschenbach 1988) Position Sensitive Proportional Counter (PSPC, Pfeffermann et al. 1987). The foreground Galactic X-ray-absorbing gas is distributed smoothly across the optical extent of M83 (Hartmann & Burton 1996) and has a relatively low column density ( cm-2; Dickey & Lockman 1990). Hence our observations allow the detection of diffuse soft (0.1-0.4 keV) X-ray emission due to hot gas in M83. In Section 2 we give the observational details and data analysis. In Section 3 we discuss the different emission components and investigate the interaction of hot gas, galactic winds and magnetic fields. Finally, we compare M83 with other nearby galaxies where diffuse X-ray emission was detected.
2 Observations and data analysis
The data analysis and reduction was performed using the EXtended Scientific Analysis System EXSAS (Zimmermann et al. 1994).
The field of view of the ROSAT PSPC detector was centered at the pointing position RA , Dec (J2000) so that the X-ray emission of M83 was contained well within the innermost 6\arcmin from the center. A total of 16 PSPC pointings in the period from Jan 1992 to Jan 1993 (see Table 2) resulted in a 25 ksec integration time.
| Observing | Date of | Time |
| interval (OBI) | observation | (s) |
| 01 | 1992 Jan 28 | 644 |
| 02 | 1992 Aug 09 | 1363 |
| 04-08 | 1993 Jan 08-09 | 8291 |
| 09,11-18 | 1993 Jan 10-11 | 15073 |
To investigate the data quality and positional offsets, we produced maps of the X-ray emission for each observing interval separately. Comparing the X-ray backgrounds in the individual maps, we looked for contamination due to solar and auroral X-ray photons or due to particles of the cosmic background emission (Snowden & Freyberg 1993, Snowden et al. 1994). Selection of data with low background values ( 20 cts per 60 sec interval) reduced the finally analysed time to 21 ksec but decreased the background noise by .
We looked for positional offsets between X-ray sources in the individual maps and found them to be less than . Systematical shifts between the maps could not be found.
The absolute position of the field depends on the accuracy of the PSPC pointing and has been checked comparing point-like X-ray emission features with the positions of stars or extragalactic sources. Checking the positions of stars in the Hubble Space Telescope Guide Star Catalog no identification was obtained. Using the extragalactic database NED 222The NASA/IPAC extragalactic database (NED) is operated by the Jet Propulsion Laboratory, Caltech, under contract with the National Aeronautics and Space Administration yielded two identifications: the X-ray source at RA , Dec (J2000) is at the position of the F5V star HR 5128 (SAO 181825) which was already detected in the Einstein survey (Schmitt et al. 1985). A second identification may exist for X-ray Source 14 (see Table 4) and the quasar MS1332.6-2935. However, the positional uncertainties of these ROSAT-detected sources are large because of their large off-axis positions (29\farcm0 and 26\farcm6, respectively). We could identify several ROSAT X-ray sources in the field of our observations with faint blue stellar objects on “ESO Quick Blue” plates. Details of source identifications will be given in Section 2.2. No systematic positional offsets could be found, and we decided not to apply any “boresight” corrections for the analysis reported in this paper.
2.1 Derivation of X-ray images
Binning the data to a pixelsize of 5\arcsec we produced images of the inner 40\arcmin region of the PSPC detector window. These have been exposure-corrected and smoothed in 8 energy subbands (0.11-0.19, 0.20-0.41, 0.42-0.51, 0.52-0.69, 0.70-0.90, 0.91-1.31, 1.32-2.01 and 2.02-2.35 keV). The smoothing was done with a Gaussian filter with full width at half maximum (FWHM) corresponding to the average resolution of the point spread function (PSF) at the detector center in the individual energy subbands. Then the subbands were merged again to form five standard energy bands (cp. Vogler et al. 1996). Table 3 gives the selected ROSAT energy bands, FWHMs of the Gaussians used for smoothing, sigma (standard deviation) and background values of the maps computed in ‘source-free’ regions. (We note that - as our observations are photon limited - sigma does not give the real background noise in the maps).
| ROSAT energy band | FWHM of Gaussians | sigma | Background | ||
|---|---|---|---|---|---|
| for smoothing (\arcsec) | cts s-1 arcmin | ||||
| Broad | B | (0.1-2.4 keV) | 52, 38, 28, 25 | 308 | 1440 |
| Soft | S | (0.1-0.4 keV) | 52, 38 | 190 | 1002 |
| Hard | H | (0.5-2.0 keV) | 28, 25 | 221 | 386 |
| Hard1 | H1 | (0.5-0.9 keV) | 28, 25 | 149 | 258 |
| Hard2 | H2 | (0.9-2.0 keV) | 25 | 151 | 138 |
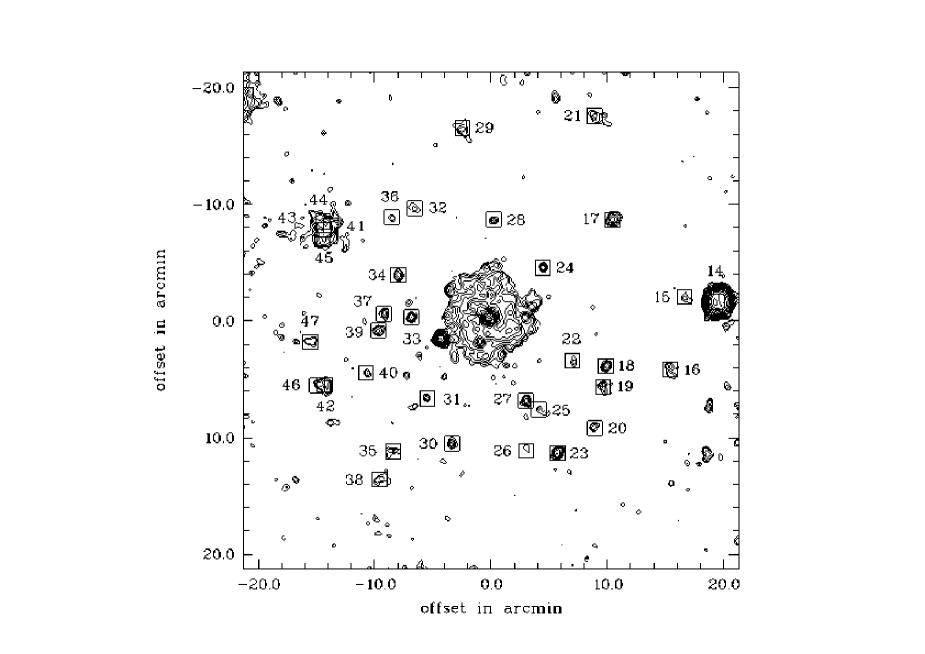
Figure 1 shows a contour plot of the broad-band emission of the whole inner 40\arcmin field-of-view of the PSPC. Around the extended emission of M83, several previously unknown X-ray point-sources and diffuse emission from a cluster of galaxies in the north-east are visible.
In Fig. 2 we show the contours of the broad-band X-ray emission of the inner part of the PSPC superimposed onto a digitized deep optical image from the 3.9-m Anglo Australian Telescope, reproduced by courtesy of the Anglo Australian Observatory.
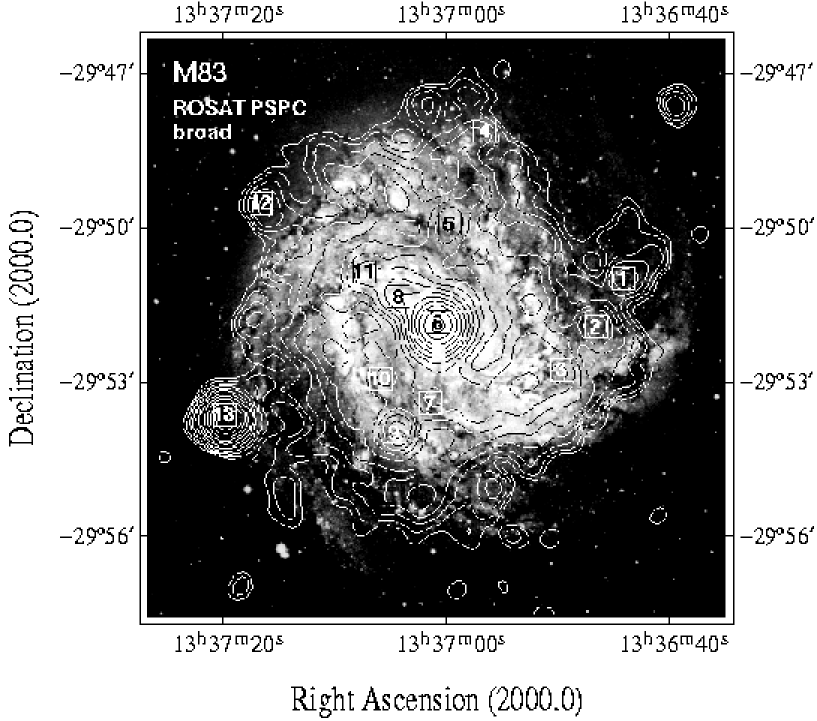
A number of point-like sources distributed throughout the plane of M83 and complex extended emission centered on, and filling almost the whole optically visible area of the galaxy, are evident.
Figure 3 gives the contour plots for the S (a), H1 (b) and H2 (c) ROSAT energy bands (see Table 3) to study the energy dependence of the X-ray emission in more detail.
2.2 Source detection and identification
Source detection and position determination have been performed in the inner 40\arcmin region of the ROSAT PSPC detector field of view where the FWHM of the point response function of the X-ray telescope/PSPC system is smaller than 100\arcsec. For better spectral sensitivity the source detections have been carried out separately in the five ROSAT energy bands. Details of these EXSAS detection procedures are given in Pietsch et al. (1994).
We detected a total of 47 sources with a likelihood of existence (see Table 4 and Figs. 1 and 2). The likelihood is defined as () where is the probability that the observed distribution of photons originates from a spurious background fluctuation which in turn is calculated from Poisson statistics. The source counts and its 1- errors are determined by the maximum likelihood method (cp. Zimmermann et al. 1994). They are background subtracted (using the smoothed background image created by cutting out sources with a cut-out radius of 1.5 FWHM at that position and performing a bicubic spline fit to the so-called cheesed image) but not corrected for mirror efficiency (vignetting).
Only those 13 sources inside of M83 which were not flagged as extended by the detection algorithms were accepted and displayed in Fig. 2. The detection of point sources inside the diffuse X-ray emission of M83 is difficult and the likelihood values of these sources might be underestimated. It is worth mentioning that the soft point source at RA , Dec (J2000) is detected with a likelihood value of 7 only, although it is clearly visible in Fig. 3 (a).
Table 4 gives the parameters of all ROSAT-detected and accepted X-ray sources. The position errors (Col. 5) of the sources have been calculated in the energy band with the highest likelihood at the 90% confidence radius. The likelihood obtained for the sources are given in Col. 6 together with the corresponding energy band in Col. 7. The counts from the sources in that band are listed in Col. 8. Count rates in the broad band, now corrected for exposure and vignetting, are given in Col. 9.
| ROSAT name | RA(J2000) | Dec(J2000) | Error | Lik. | in | Net counts | Count rates | |
|---|---|---|---|---|---|---|---|---|
| of exist. | band | in that band | in broad band | |||||
| () | (\degr \arcmin \arcsec) | (\arcsec) | s | |||||
| (1) | (2) | (3) | (4) | (5) | (6) | (7) | (8) | (9) |
| 1 | RX J133644-2950.9 | 13:36:44.1 | -29:50:59 | 9 | 14 | H2 | 1.50.4 | |
| 2 | RX J133646-2951.9 | 13:36:46.5 | -29:51:55 | 6 | 33 | H | 3.00.6 | |
| 3 | RX J133649-2952.7 | 13:36:49.7 | -29:52:46 | 10 | 10 | H2 | 2.10.6 | |
| 4 | RX J133656-2948.1 | 13:36:56.6 | -29:48:06 | 13 | 16 | H1 | 0.50.4 | |
| 5 | RX J133659-2949.9 | 13:36:59.6 | -29:49:54 | 7 | 25 | H | 3.00.6 | |
| 6 | RX J133700-2951.8 | 13:37:00.7 | -29:51:50 | 2 | 478 | H | 40.11.9 | |
| 7 | RX J133701-2953.4 | 13:37:01.4 | -29:53:24 | 8 | 13 | H | 2.50.6 | |
| 8 | RX J133704-2951.3 | 13:37:04.3 | -29:51:20 | 9 | 20 | H | 4.00.8 | |
| 9 | RX J133704-2953.9 | 13:37:04.6 | -29:53:59 | 5 | 45 | H | 4.50.7 | |
| 10 | RX J133705-2952.9 | 13:37:05.8 | -29:52:56 | 10 | 11 | H | 2.00.6 | |
| 11 | RX J133707-2950.8 | 13:37:07.3 | -29:50:51 | 7 | 23 | H | 3.20.7 | |
| 12 | RX J133716-2949.5 | 13:37:16.6 | -29:49:31 | 11 | 114 | S | 2.60.5 | |
| 13 | RX J133719-2953.6 | 13:37:19.9 | -29:53:38 | 3 | 1143 | H | 21.91.1 | |
| 14 | RX J133530-2950.5 | 13:35:30.5 | -29:50:31 | 2 | 4201 | B | 107.62.5 | |
| 15 | RX J133543-2950.1 | 13:35:43.2 | -29:50:06 | 18 | 10 | H | 1.30.5 | |
| 16 | RX J133548-2956.3 | 13:35:48.9 | -29:56:20 | 20 | 20 | H2 | 2.10.5 | |
| 17 | RX J133611-2943.5 | 13:36:11.8 | -29:43:32 | 10 | 66 | H | 4.50.6 | |
| 18 | RX J133614-2956.0 | 13:36:14.3 | -29:56:02 | 7 | 68 | H | 3.10.5 | |
| 19 | RX J133615-2957.8 | 13:36:15.5 | -29:57:50 | 14 | 27 | H | 2.40.5 | |
| 20 | RX J133618-3001.3 | 13:36:18.8 | -30:01:22 | 14 | 31 | H | 1.90.5 | |
| 21 | RX J133619-2934.6 | 13:36:19.0 | -29:34:37 | 26 | 12 | H | 2.30.5 | |
| 22 | RX J133627-2955.5 | 13:36:27.7 | -29:55:34 | 15 | 15 | H | 1.40.4 | |
| 23 | RX J133633-3003.4 | 13:36:33.6 | -30:03:29 | 7 | 116 | H | 4.20.6 | |
| 24 | RX J133639-2947.6 | 13:36:39.4 | -29:47:39 | 8 | 33 | H | 2.00.4 | |
| 25 | RX J133641-2959.8 | 13:36:41.0 | -29:59:48 | 14 | 11 | H | 1.10.4 | |
| 26 | RX J133645-3003.3 | 13:36:45.9 | -30:03:18 | 20 | 27 | H2 | 1.30.5 | |
| 27 | RX J133646-2959.0 | 13:36:46.1 | -29:59:02 | 7 | 51 | H | 2.90.5 | |
| 28 | RX J133658-2943.5 | 13:36:58.9 | -29:43:30 | 10 | 24 | H2 | 1.80.4 | |
| 29 | RX J133711-2935.6 | 13:37:11.3 | -29:35:40 | 15 | 31 | H | 2.30.6 | |
| 30 | RX J133715-3002.7 | 13:37:15.4 | -30:02:43 | 11 | 41 | H | 2.00.5 | |
| 31 | RX J133725-2958.8 | 13:37:25.2 | -29:58:50 | 12 | 15 | H2 | 1.20.4 | |
| 32 | RX J133730-2942.5 | 13:37:30.2 | -29:42:31 | 19 | 11 | H | 1.70.5 | |
| 33 | RX J133731-2951.8 | 13:37:31.5 | -29:51:52 | 7 | 44 | H | 2.40.4 | |
| 34 | RX J133736-2948.2 | 13:37:36.7 | -29:48:15 | 9 | 39 | H | 2.30.5 | |
| 35 | RX J133738-3003.3 | 13:37:38.9 | -30:03:21 | 14 | 23 | H | 1.60.5 | |
| 36 | RX J133739-2943.3 | 13:37:39.4 | -29:43:18 | 16 | 13 | H | 1.20.4 | |
| 37 | RX J133742-2951.5 | 13:37:42.4 | -29:51:34 | 8 | 44 | H | 2.30.5 | |
| 38 | RX J133744-3005.7 | 13:37:44.2 | -30:05:47 | 25 | 11 | H | 1.50.5 | |
| 39 | RX J133744-2952.9 | 13:37:44.6 | -29:52:59 | 10 | 39 | H | 2.50.5 | |
| 40 | RX J133749-2956.6 | 13:37:49.6 | -29:56:38 | 19 | 13 | H | 1.30.4 | |
| 41 | RX J133803-2943.9 | 13:38:03.4 | -29:43:59 | 12 | 38 | H2 | 7.80.9 | |
| 42 | RX J133806-2957.6 | 13:38:06.0 | -29:57:38 | 13 | 43 | H | 4.00.7 | |
| 43 | RX J133806-2944.3 | 13:38:06.1 | -29:44:22 | 10 | 161 | H | 17.81.3 | |
| 44 | RX J133806-2943.6 | 13:38:06.6 | -29:43:40 | 9 | 78 | H | 7.10.8 | |
| 45 | RX J133806-2945.2 | 13:38:06.8 | -29:45:12 | 10 | 67 | H | 6.10.8 | |
| 46 | RX J133809-2957.6 | 13:38:09.2 | -29:57:41 | 19 | 10 | B | 2.70.7 | |
| 47 | RX J133811-2953.9 | 13:38:11.6 | -29:53:59 | 17 | 21 | H | 1.90.5 |
The count-to-energy conversion factor for e.g. a 5 keV thermal bremsstrahlung spectrum, corrected for Galactic foreground absorption in the direction towards M83, is erg cm-2 cts-1. Under this assumption a cts s-1 source at the distance of M83 would have an X-ray luminosity in the broad ROSAT energy band of erg s-1.
Outside the 40\arcmin detection area two more strong X-ray sources are visible at RA , Dec (partly visible in the upper left corner of Fig. 1) and RA , Dec (J2000). Due to the large off-axis angles these positions have large errors (). The first of these sources can be identified as the F5V star HR 5128 (see above) which was already detected as the Einstein Source I8. The second one corresponds to Einstein Source I9 (Trinchieri et al. 1985) where it was interpreted as probably a 9th magnitude star.
The starburst nucleus of M83 was detected as an extended X-ray Source 6 and is the strongest source in that galaxy. Its X-ray position coincides very well with the central radio continuum source at RA , Dec (J2000) (Condon et al. 1982).
We searched for X-ray emission from cataloged historical supernovae in M83 (Richter & Rosa 1984, and references therein): no enhanced X-ray emission at the positions of the radio detections of SN1923a, SN1950b, SN1957d, SN1968l and SN1983n was found in any of the ROSAT energy band images.
We also compared the ROSAT-detected sources with earlier Einstein observations, maps of H, H i emission (Tilanus & Allen 1993) and optical ESO-SRC plates (Table 5).
| Sources in M83 | ||
| Source | Luminositya | Environment and Comments |
| 1 | H i hole, at the edge of an H ii region | |
| 3 | at the edge of an H ii region | |
| 4 | at the edge of an H ii region | |
| 5 | near H i hole | |
| 6 | nucleus, H i in absorption, H ii region, T: Einstein Source H1 (RA=2\arcsec, Dec=6\arcsec), | |
| (0.5-3.0 keV) erg s-1, C: radio position (6\arcsec, 1\arcsec) | ||
| 7 | H i hole | |
| 8 | T: Einstein Source H4 (0\arcsec, -2\arcsec), (0.5-3.0 keV) erg s-1 | |
| 9 | H ii region, CRB: near therm. radio Source 8 (19\arcsec, 3\arcsec) | |
| 11 | H ii region | |
| 13 | H i in absorption, T: Einstein Sources I2 (10\arcsec, -2\arcsec) (0.5-3.0 keV) erg s-1 | |
| or H2 (3\arcsec, 8\arcsec) (0.5-3.0 keV) erg s-1, ESO-SRC plates: diffuse faint object | ||
| Sources around M83 | ||
| Source | Fluxa | Environment and Comments |
| 14 | T: Einstein Source I6 (8\arcsec, 4\arcsec) (0.5-3.0 keV) erg cm-2 s-1, G: AGN MS1332.6-2935 | |
| 16 | ESO-SRC plates: several objects | |
| 23 | ESO-SRC plates: diffuse faint object | |
| 27 | ESO-SRC plates: diffuse faint object | |
| 28 | ESO-SRC plates: faint object | |
| 41,43-45 | T: Einstein Source I7 (background cluster, z=0.189, H km/s Mpc) | |
| (0.5-3.0 keV) erg s-1, (0.1-2.4 keV) erg s-1 | ||
| ESO-SRC R-plate: 3 diffuse objects (nothing visible on J-plate) | ||
| 42,46 | ESO-SRC plates: two faint objects | |
a - Assuming kT=5 keV, cm-2,
distance to M83=8.9 Mpc. Luminosities in units of erg s-1,
fluxes in erg cm-2 s-1
b - T: Trinchieri et al. 1985; C: Condon et al. 1982; CRB: Cowan et al. 1994; G: Gioia et al. 1990
2.3 Spatial analysis of the extended emission
Besides the detected X-ray sources, M83 shows complex extended X-ray emission in all ROSAT energy bands (see Fig. 3) covering essentially the whole optically visible galaxy.
The S-band contours are rather smooth and (neglecting Source 13 and the source at RA , Dec , see Fig. 2) probably do not contain a significant contribution from point sources because their soft X-ray emission is absorbed within the galactic disk of M83. In the H1- and H2-band the point sources are more clearly visible. This is partly caused by the harder spectra of the point sources but also because of the higher spatial resolution of the PSPC at these energies.
2.3.1 Comparison with Einstein HRI observations
The soft emission shows a central ridge structure starting from the nucleus in directions P.A. as well as P.A. (Fig. 3a). In contrast, the hard emission from this inner part of the galaxy is strongly asymmetric with respect to the central nuclear source: the north-eastern part of the ridge structure is still visible, but the south-western protrusion disappears. Here in the H1 band we see a reduction in the emission that becomes even more visible in the H2 band. In addition, the northern spur observed in the H2 band is pointing to a slightly different direction (P.A., Fig. 3b, c).
To study the central region at higher angular resolution, we reanalysed Einstein HRI observations (using data obtained through the High Energy Astrophysics Science Archive Research Center Online Service, provided by the NASA Goddard Space Flight Center) which were already published by Trinchieri et al. (1985). We combined the two Einstein observations (1980 Jan 15-16: 24575 s & 1981 Feb 13: 20003 s) after correcting for a positional offset, aligned them with our ROSAT maps and used adaptive filtering (cf. Ehle et al. 1995) to produce a new map which is displayed in Fig. 4 as a contour plot.
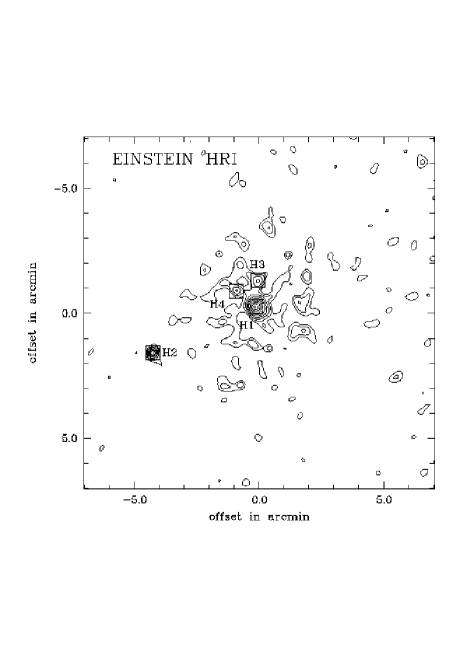
In the Einstein image we identify the north-eastern spur and the two emission peaks that are visible in the H2 band emission (Fig. 3c). It is worth mentioning that we do not detect Einstein Source H3 in any of our ROSAT energy bands and therefore conclude that this source is variable. The Einstein HRI contour plot shows emission extending from the nucleus in a south-western direction (P.A.), similar to the ridge structure in the soft image, but its radial extent is much smaller, probably owing to lack of sensitivity. Slightly enhanced X-ray emission south of the nuclear region is visible in the H1 band and is probably associated with the south-western spur that is visible in the Einstein observations as well.
2.3.2 Radial and azimuthal distribution of the diffuse X-ray emission
To quantify the distribution of the diffuse X-ray emission in our ROSAT maps, we subtracted the detected point-like sources and integrated the remaining diffuse emission separately in the north-western and south-eastern half of M83 out to a galactic radius of 5’. The two halves were separated by the galaxy’s major axis. While the emission in the two hard bands is enhanced in the north-western part by about relative to the south-eastern part, the soft-band emission shows the opposite asymmetry, with a lack of soft emission in the north-western half of M83 (decreased by about ).
In order to investigate if the diffuse X-ray emission of M83 originates from sources that are also responsible for the production of cosmic rays (as was suggested by Fabbiano et al. (1982) in the case of peculiar galaxies) we compared the extent of the radio continuum (Neininger 1992) and the diffuse X-ray emission. Figure 5 gives the the radial profiles of the extended X-ray emission for the soft and hard energy range, calculated by averaging counts in rings of 12\arcsec (0.5 kpc) which are centered on the position of the central X-ray source. Whereas the soft emission is smoothly decreasing with radius, the profile of the hard emission component has a local minimum at kpc (corresponding to the reduction in the emission south-west of the nucleus (cp. Fig. 3c)) followed by an enhancement. This local maximum is also visible as a distinct ‘hump’ in the radial distribution of the optical surface brightness (Talbot et al. 1979) where this region was found to contain the bluest light in the galaxy outside the nucleus. The radio continuum profiles at cm (Neininger 1992), however, are very smooth over the whole radial extent of M83.
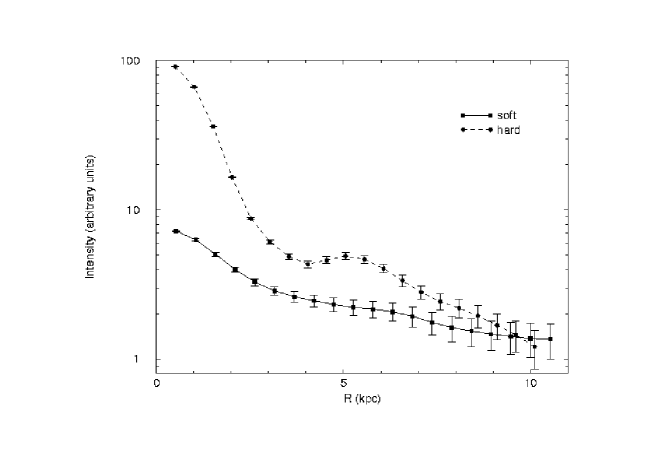
The scale length of the extended hard-band X-ray emission outside a radius of 5.5 kpc is kpc (neglecting the nuclear region with kpc as well as circular annuli around the local minimum at kpc). The scale length of the cm radio emission is kpc. Neininger (1992) separated the thermal and nonthermal radio continuum emission of M83 and calculated for the thermal emission at cm a scale length of kpc, consistent with that of the hard-band diffuse X-ray emission.
An important finding is that the radial profile of the soft diffuse X-ray emission shows a much larger scale length that is best fitted with a Gaussian of half FWHM kpc. In addition, the ‘hump’ in the profile of the hard X-ray emission does not exist in the soft energy image.
2.3.3 Separation of emission components
We calculated the count rates and hardness ratios (defined as hardness ratio 1 HR1=(hard-soft)/(hard+soft) and hardness ratio 2 HR2=(hard2-hard1)/(hard2+hard1), see Table 6) for the diffuse emission of M83. The extended emission in the different energy bands was integrated over a ring with an inner radius of 1\arcmin and outer radius of 5\arcmin and corrected for the background and time of exposure. The same was done for the nuclear region with radius 1\arcmin separately. The definition of the extent of the nuclear region is somewhat arbitrary, and it results from the qualitative inspection of the contour maps. We should note that this and all following calculations making use of the so called ‘diffuse emission’ are based on upper limits of this emission component. Part of it may be due to sources below our detection threshold (cf. Sect. 3.1).
To determine the emission resulting from detected point-like sources, we added up the count rates in the different energy bands as they were obtained from our source detection (Table 6).
| Emission component | Count rates | Hardness ratios | |
|---|---|---|---|
| cts s-1 | HR1 | HR2 | |
| Nuclear region | |||
| Extended emission | |||
| Point-like sources | |||
| Total emission | |||
The total X-ray emission of M83 is dominated by the complex extended emission in all ROSAT energy bands. All detected sources (excluding the nuclear Source 6 and Source 13) contribute only 9% to the total count rate. The hardness ratios show that the point-like sources in general have hard spectra and that the nuclear emission is harder than the extended emission.
2.4 Spectral analysis: derivation of X-ray colors and fits to models
Nearly all sources (1, 2, 4-11) in M83 are most likely bright X-ray binaries showing strong absorption of the soft-band flux as expected from their position in the galactic disk of M83. Source 12 shows enhanced soft X-ray emission. The very strong X-ray source 13 might be an AGN, a quasar, or a radio galaxy. Only this source and the nucleus are strong enough to allow a detailed spectral analysis. The best fit to Source 13 is a thermal plasma spectrum with fixed to the Galactic foreground value, yielding a temperature of K and a flux density of erg cm-2 s-1 (errors correspond to the 68.3% confidence level of our best fit with and 14 degrees of freedom).
A more detailed spectral analysis of other single point sources is very difficult because of the unknown contribution of the underlying diffuse emission.
To study the spectra of the diffuse extended X-ray emission we excluded circular regions (with a radius 1.5 FWHM of the point response function) at the positions found by our source detection. Source 13 was excluded because it is most likely a background source. We also excluded the central part of M83 (radius kpc around the position of the central Source 6) which we shall discuss as the nuclear region in Sect. 2.4.1. The remaining emission, integrated out to a galactic radius of kpc is discussed as extended emission in Sect. 2.4.2. Background values were derived by integrating counts in nearby emission-free regions. The resulting count rate spectra were binned so that each energy interval had a signal-to-noise ratio larger than 5.
2.4.1 Nuclear region
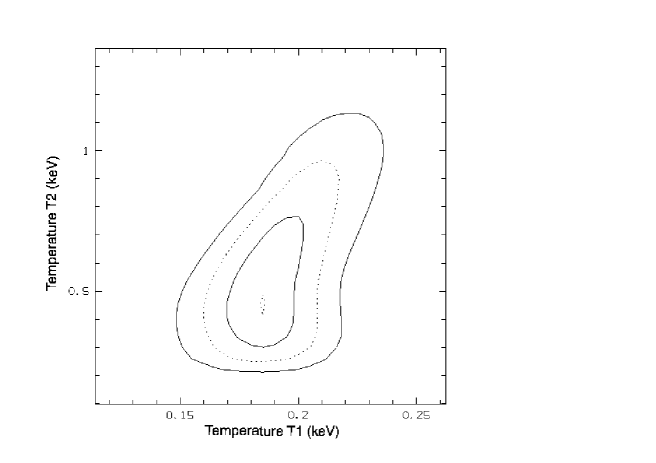
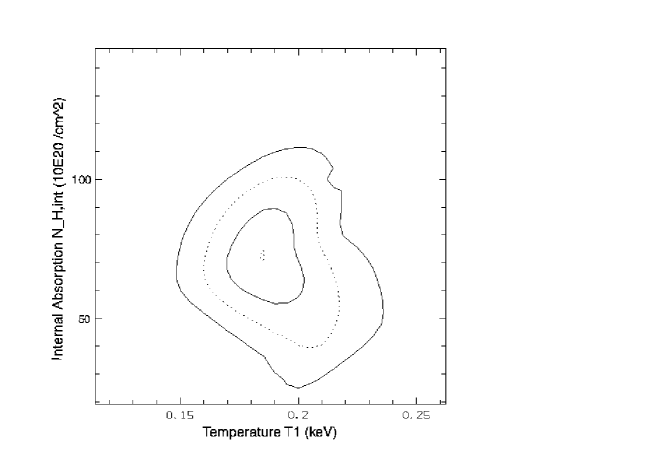
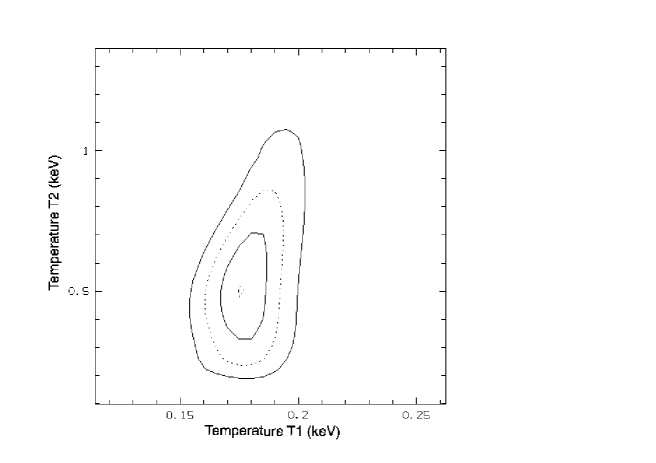
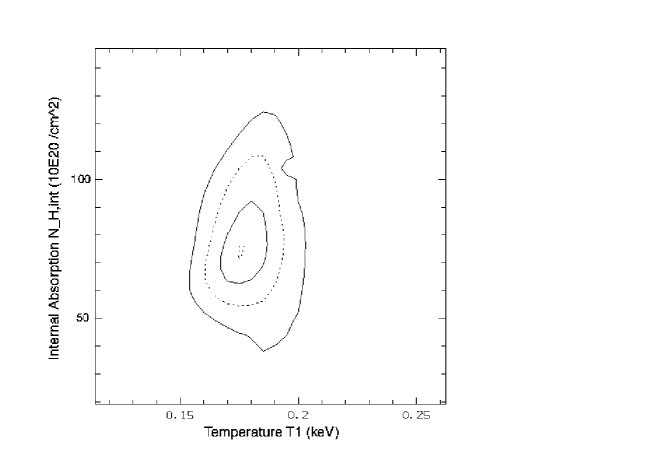
The background subtracted energy spectrum of the photons originating from the nuclear area cannot be fitted with sufficient statistical reliability by simple spectral models, like a power-law, a thermal bremsstrahlung or a thin thermal Raymond-Smith model with ‘cosmic’ abundances (Raymond & Smith 1977). Details of the used models are given by Zimmermann et al. (1994). Table 7 lists the fit results. Furthermore, for the thermal plasma model the best-fit foreground absorption is too low compared to the Galactic foreground value. However, an acceptable fit is produced by the combination of a thermal Raymond-Smith plasma of temperature with an internally absorbed thermal plasma of temperature , both affected by Galactic foreground absorption. Again, the model assumed ‘cosmic’ abundances to reduce the number of free parameters (see Table 7 for best-fit parameters and Fig. 6). As the largest uncertainties of the fit come both from the dependence of and as well as from that between and the internal absorption (), Fig. 7 shows confidence contours for these two sets of parameters.
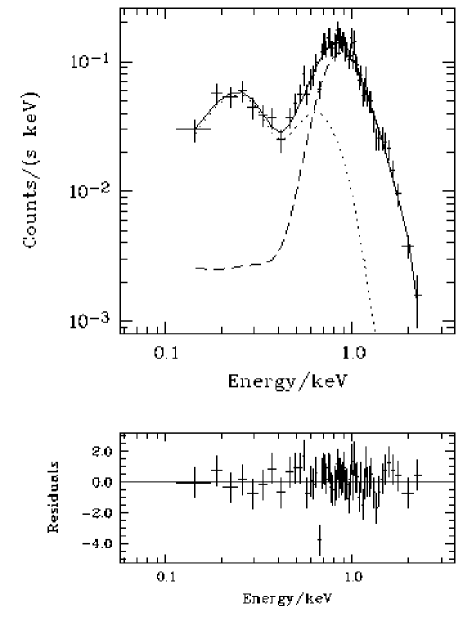
The physical motivation for a two-component thermal plasma model is the expectation that one observes a superposition of a soft halo and hard disk emission in face-on galaxies, as is supported by studies of edge-on galaxies like NGC 4631 (Wang et al. 1995, Vogler & Pietsch 1996) and NGC 253 (Pietsch 1993) where the differentiation of disk and halo regions is possible. Our best-fit model explains the X-ray emission originating from a warm gas component ( keV K; probably located in the halo region) and hot plasma ( keV K; probably the hot gas near to the nucleus and in the disk of M83). The harder X-ray emission from the hot gas component is strongly internally absorbed. This agrees with the result that the nuclear region shows a significantly higher HR1 than the point-like sources and the extended emission. Using the best-fit parameters, the X-ray luminosity of the M83 nuclear region in the broad ROSAT band is erg s-1 (53% due to the cooler and 47% due to the hotter gas component). The luminosity of the diffuse soft component is (soft) erg s-1 and originates almost only from the lower-temperature plasma. The soft X-ray luminosity is used to estimate the physical parameters of the emitting gas in Sect. 3.3.
2.4.2 Diffuse soft emission due to hot gas
We assume that, after subtraction of the detected sources and the nuclear area, the remaining broad-band emission of M83 is a mixture of hot thermal gas (in the disk and in the halo) and weak point sources that might not be detected in the present observations. Trying to fit the observed photon spectra with simple models again gave no acceptable results. However, the combined two-temperature spectral model already discussed for the nuclear region yields a good description of the observed spectra. The best-fit parameters for the extended emission are given in Table 7.
| Model | Index | |||||||
| external | internal | |||||||
| Nuclear Area | ||||||||
| Thermal bremsstrahlung | 60 | 2.1 | ||||||
| Power-law | 60 | 2.7 | ||||||
| Raymond-Smith | 60 | 1.7 | ||||||
| Raymond-Smith(e) | 3.97 | 61 | 4.3 | |||||
| Two-temp. Raymond-Smith(e) | 3.97 | 58 | 0.9 | 0.4 | ||||
| Extended Emission | ||||||||
| Thermal bremsstrahlung | 58 | 1.2 | ||||||
| Power-law | 58 | 1.6 | ||||||
| Raymond-Smith | 58 | 4.1 | ||||||
| Raymond-Smith(e) | 3.97 | 59 | 5.5 | |||||
| Two-temp. Raymond-Smith(e) | 3.97 | 56 | 0.9 | 1.4 | ||||
(a) in units of cm-2
(b) in units of keV
(c) numbers of degrees of freedom
(d) luminosity in the soft (0.1-0.4 keV) energy range (for a M83 distance of
8.9 Mpc), corrected for Milky Way absorption, in units of
erg s-1
(e) external fixed to Galactic value
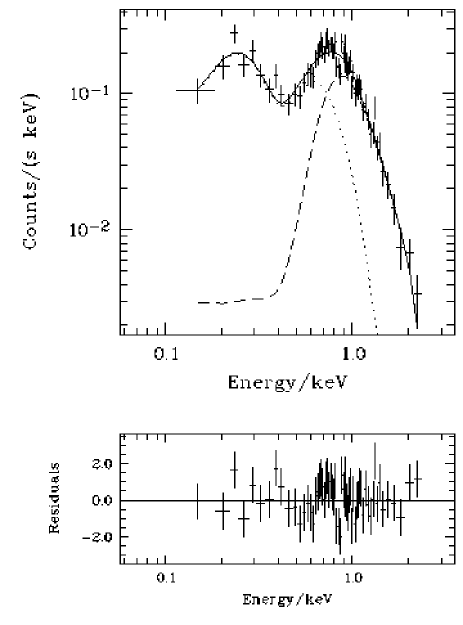
Again the best-fit is obtained by combining a soft X-ray emitting warm ( keV K) plasma with an internally absorbed hot ( keV K) gas (see Table 7 and Fig. 8). Figure 9 shows the confidence contours for this spectral fit. The X-ray luminosity of the M83 extended diffuse emission in the broad ROSAT band then is erg s-1 (75% due to the warm and 25% due to the hot gas component). The X-ray luminosity in the soft energy band, computed for the best-fit parameters, is erg s-1 and originates almost completely from the cooler gas component, as it is the case for the nuclear area (see above).
3 Discussion
3.1 Point-like sources
We detected 13 point-like sources in M83, 10 of which were previously unknown, down to a limiting sensitivity of erg s-1. Four of the seven Einstein detected sources could not be found again and are probably time-variable X-ray binaries. The number of background sources in the X-ray emitting area of M83 at our limiting luminosity is expected to be only 1.2, based on the luminosity function of sources from the ROSAT medium-sensitivity survey (Hasinger et al. 1991). We note that this value represents an upper limit as the absorbing material in the disk of M83 further reduces the chance to detect background sources.
Eight of the detected X-ray sources in M83 are positionally correlated with H ii regions and/or H i voids and could be giant bubbles of hot gas in star-forming regions, young supernova remnants (Marston et al. 1995), ultraluminous X-ray binaries or a combination of all these components (Williams & Chu 1995). Such a coincidence of X-ray sources and H i holes has been detected in the face-on galaxy M51 (Ehle et al. 1995) and M101 (Snowden & Pietsch 1995, Williams & Chu 1995). Kamphuis et al. (1991) showed for one of the holes in M101 that it is indeed associated with an expanding H i shell. Diffuse X-ray emission from hot gas in H i shells also was found within the LMC (Chu & Mac Low 1990; Wang & Helfand 1991; Bomans et al. 1994). The resolved shells in the LMC, however, only reach X-ray luminosities of about erg s-1, factors of more than 10 less than the one required for the M83 point sources. This indicates that hot gas confined in a giant bubble can not explain the high X-ray luminosity of these sources. A more detailed discussion of time variability, properties of individual sources and a comparison with H i channel maps should make use of sensitive ROSAT HRI observations of M83 (Blair, in prep.) which allow a more reliable source detection and separation of point sources from the surrounding diffuse emission.
Our PSPC observations of M83 allow a crude estimate of the amount of undetected point-like sources contributing to the luminosity of the extended emission (calculated in Sect. 2.4.2). As the number of detected sources in M83 is rather low, the integral luminosity distribution of sources in M31 (a single power-law with slope -0.8; Trinchieri & Fabbiano 1991) is assumed. Furthermore, assuming that only sources above erg s-1 contribute significantly to the luminosity due to point-like sources (this cutoff is based on observations of X-ray binaries in the Milky Way), we integrated the logN-logS distribution normalized to the total luminosity of detected point-like sources in M83. The luminosity due to undetected plus detected point-like sources is found to be erg s-1, a factor of higher than what has been detected. Undetected point-like sources might explain of the extended diffuse X-ray emission. Supper et al. (1997) found a flattening of the luminosity distribution with decreasing luminosities for the globular cluster sources in M31. If this is true also for point-like sources in M83, the X-ray luminosity due to undetected sources would be even smaller. This result is in good agreement with that from Ginga observations, namely that a thermal component is making a considerable contribution in the X-ray emission rather than LMXBs or X-ray pulsars (Ohashi et al. 1990).
3.2 Nuclear region
Earlier Einstein IPC observations could not be used to investigate the spectral properties of the extended and nuclear emission of M83 because of the short exposure time ( s) and detector gain variations (Trinchieri et al. 1985). Spectral observations of M83 with the Ginga satellite (Ohashi et al. 1990) also do not allow a separation of the nuclear emission from the remaining diffuse emission because of their low angular resolution. Spectral modelling based on ROSAT observations, however, tells us that the nuclear X-ray emission is complex. The nucleus itself is detected as a bright point-like source by our source detection algorithm and shows a relatively hard spectrum. The ROSAT observed luminosity of the nuclear region of M83 is (0.1-2.4 keV) erg s-1, in agreement with the Einstein observations within the range of uncertainties ((0.5-3.0 keV) erg s-1) and can be compared with other known starburst nuclei, such as NGC 7714 ((Einstein ) erg s-1; Weedman et al. 1981), NGC 253 ((Einstein ) erg s-1; Fabbiano & Trinchieri 1984, scaled to 2.58 Mpc distance), and NGC 1808 ((ROSAT ) erg s-1; Junkes et al. 1995).
A comparison of the observed spectra of the nuclear area and the disk (Figs. 6 and 8) shows that in the nuclear region the emission of the hard component is stronger than that of the soft component, in contrast to the extended disk and halo emission of M83 where both spectral components contribute equally. The harder spectral properties of the emission from the nuclear area are also visible in the different hardness ratios (see Table 6).
The soft X-ray emission of the nucleus of M83 (Fig. 3a) is clearly extended and shows a ridge-like structure pointing approximately in the direction of the optically visible bar. Neininger et al. (1991) showed that the magnetic field also follows closely that bar structure, favouring the idea of a link between the hot gas and magnetic fields.
However, the reason for the strong asymmetry of the hard nuclear X-ray radiation (Fig. 3b and c) is still unclear: No such asymmetrical emission features are detected at any other wavelengths. We do not expect that the nuclear hard X-ray protrusion results from very hot gas emerging from the nucleus and travelling through the relatively dense galactic disk. Instead we prefer the idea that the asymmetry is due to point-like sources distributed asymmetrically around the galactic nucleus. These sources are not resolved by the spatial resolution of the PSPC-detector and might be connected to strong star-forming regions. We will have to wait for sensitive M83 ROSAT HRI observations (Blair, in prep.) to study the structure and origin of the extended nuclear X-ray emission in more detail. Part of the extended nuclear emission of M83 might well be resolved into point-like bulge sources, as it is the case for the nucleus of M51 (Immler 1996).
3.3 Extended emission
If we account for diffusion of cosmic rays away from their sites of origin, the synchrotron scale length should be larger than that of the extended X-ray emission which is in agreement with our observations. The same result was found for the galaxy M51 (Ehle et al. 1995). The agreement of the scale length of the hard-band diffuse X-ray- and of the thermal radio emission favours the idea that the hard diffuse emission is due to hot gas produced by star-forming regions in the galactic disk. This hypothesis is further supported by the fact that the ‘hump’ at kpc is also visible in the optical light where it indicates the presence of active and recent star formation (Talbot et al. 1979).
The smooth profile of the soft, diffuse X-ray emission together with its shallow radial descent argue for the idea that this X-ray emission component is related to a different distribution of emitting sources. From observations of the H i velocity field (Tilanus & Allen 1993) and under the assumption of trailing spiral arms, it follows that the north-western part of the galactic disk is nearer to the observer. Hence, the asymmetric distribution of the soft X-rays supports the existence of a spherical gas halo: the galactic disk is opaque to soft X-rays so that we only see the emission from the front hemisphere. The asymmetric distribution of surface brightness (Sect. 2.3.2) is explainable as a projection effect caused by the galactic inclination and absorption (cp. Pietsch et al. 1994).
The idea that most of the soft X-ray emission is due to hot gas located in a huge halo above the disk of M83 is further supported by the spectral characteristics of the diffuse emission: The X-ray spectrum of the extended emission is complex and cannot be described by simple models. This is understandable, as observing a face-on galaxy like M83 must result in a superposition of different X-ray emission components from the disk and halo that are affected by internal absorption from the H i gas distribution in the galactic disk. This statement is supported by X-ray observations of edge-on galaxies where these components can be viewed separately in and above the disk. We note, however, that only observations of face-on galaxies allow the study of the distribution of X-ray emission with respect to the (underlying) disk. Our best fit (with a resonably small amount of free parameters) is a two-temperature Raymond-Smith plasma with both internal and external absorption, the latter fixed to the H i column density of the Milky Way in the direction to M83. A similar two-temperature model was found to give a good description of the diffuse X-ray emission from NGC 4631 (Wang et al. 1995). As these authors, we expect not only two discrete temperatures but probably a continuous temperature distribution in the real disk and halo gas. In future, more sophisticated spectral models in combination with X-ray telescopes, offering higher energy resolution, might allow a better description.
If the diffuse X-ray emission in the soft energy band is assumed to be due to hot halo gas, it is possible to calculate the gas density , mass and cooling time of that plasma. To this end we use the model of thermal cooling and ionization equilibrium of Nulsen et al. (1984) where . The unknown filling factor allows for some clumpiness of the gas. For the gas temperatures of the nuclear region and of the extended halo emission ( K) Raymond et al. (1976) give a cooling coefficient of erg cm3 s-1. To calculate the physical parameters of the hot gas component one has to make assumptions about the emitting volume : here we take into account that the soft diffuse X-ray emission from regions behind the disk of M83 is absorbed by the neutral hydrogen in the galactic disk. Column densities of cm-2 already lead to a nearly complete absorption of the soft-band emission. Such and even higher values are observed in the disk of M83 (Tilanus & Allen 1993). We assume that the nuclear soft X-ray radiation is emitted from a hemisphere with radius 1\arcmin (see above) and that the extended soft emission from the halo of M83 fills a hemisphere with radius kpc (see above), minus a cylinder of radius 1\arcmin around the center where the emission clearly is dominated by the gas of the nuclear area. The calculated gas parameters are presented in Table 8.
| Region | (cm-3) | (yr) | |
|---|---|---|---|
| Nuclear area | |||
| Rest of M83 |
The total mass of the detected hot gas (nuclear area plus halo) is which is only of the total gas mass (cp. Table 1). Similarly low mass contributions are found for the galaxies M51 (Ehle et al. 1995) and NGC 1566 (Ehle et al. 1996). The cooling times are longer than the time scale for starburst activity which is estimated to be around yr (Rieke et al. 1988, Trinchieri et al. 1985).
3.4 Hot gas, galactic winds and magnetic fields
From X-ray observations of the hot gas it is possible to calculate the thermal energy density of this component of the interstellar medium: . (It is, however, still not clear whether the ions are in thermal equilibrium with the plasma electrons (see Lesch 1990) and how strongly they contribute to ). A comparison of the nuclear area and the halo region of M83 (Table 8) shows that is a factor of 6 higher in the nuclear region. Here the gas can escape much more easily from the galactic disk and rise up into the halo, e.g. in the form of a galactic wind channeled by vertical magnetic fields (Breitschwerdt & Schmutzler 1994). High Faraday rotation measures and strong depolarization of polarized radio emission in the central part of M83 support this concept (Neininger et al. 1991, Ehle 1995). Further evidence of nuclear gas outflow comes from the detection of absorption lines blueshifted by 1000 km s-1 relatively to the system’s velocity (Bohlin et al. 1983).
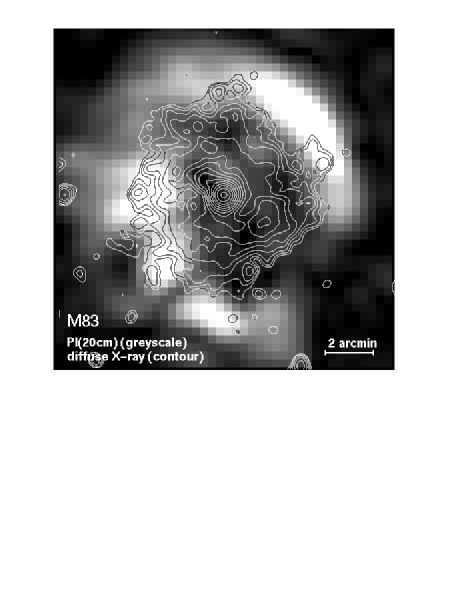
Whereas the electron densities of the hot gas (as derived from the presented X-ray data) are in general too low to explain the observed depolarization (see below), the density in the nuclear area is relatively high and may contribute to the Faraday effects. A comparison of the polarized radio emission at cm and the broad-band diffuse X-ray emission (Fig. 10) shows indeed a correlation of strong X-ray emission with low polarized intensities in the central area of M83.
This may indicate that the diffuse X-ray emitting hot gas in the nuclear area depolarizes by the effect of internal Faraday dispersion along the line of sight, produced by turbulent magnetic fields and thermal gas inside the emitting source (Burn 1966, Ehle & Beck 1993). Adopting a strength of the turbulent magnetic field of G (Neininger et al. 1993), a pathlength of kpc (see above) and a typical turbulence scale length of 50 pc requires electron densities of cm-3 to explain the depolarization of at cm in the central region of M83. This gas density is comparable, within the range of uncertainties, to that calculated from our X-ray observations (see Table 8).
The electron densities of thermal gas in the galactic halo required to explain the strong depolarization outside the nuclear area are in the range of cm-3 (e.g. Ehle 1995). These values are inconsistent with the halo densities as derived from our ROSAT X-ray observations. Either Faraday depolarization occurs in cooler ionized gas not radiating in X-rays (warm absorber), or the turbulence scale length in the halo is much larger than in the disk, or the assumption of ionization equilibrium (Raymond-Smith plasma with one specific temperature) is not valid. The latter possibility is supported by the model of galactic winds and delayed recombination (Breitschwerdt & Schmutzler 1994). In their simulation the soft X-ray emission can be explained by a cooler (typical K) gas which might have electron densities that are larger by a factor 3-5 (Schmutzler, priv. comm.) than the values given in Table 8.
From radio polarization observations it is possible to compare with the energy density of the magnetic field: . Assuming equipartition between cosmic rays and magnetic fields, Neininger et al. (1993) calculated, for a synchrotron emitting disk of kpc thickness, a total magnetic field strength of G for M83. To scale the disk field strength to that of the halo we use observations of the edge-on galaxy NGC 253 (Beck et al. 1994) where the field strength at a height of kpc above the galactic disk is found to be about 80% of the disk value.
Allowing the filling factor to vary between 0.1 and 0.8 and including a 0.1 keV uncertainty for the gas temperature, we obtain a rough estimate of the plasma parameters of both for the nuclear area and for the halo. The galactic wind model (see above) leads to an even lower .
Although there are other contributions to the total energy density of the hot interstellar medium (e.g. turbulent motions, cosmic rays) it is obvious that the magnetic field plays an important role for galactic haloes. How it might channel galactic winds, support or hinder the escape of hot gas from the galactic disk, or heat the gas via MHD waves or magnetic reconnection is still under discussion.
3.5 Comparison with other galaxies
Assuming that most of the mechanical energy supplied to the interstellar gas is from supernovae, one might ask whether this energy input is high enough to explain the thermal energy of the hot X-ray emitting gas (cf. Fabbiano et al. 1997). Based on an idealized model for the X-ray emission (a single spherical expanding bubble, cf. Heckman et al. 1996), the supernova rate of M83 (0.29 - 0.49 yr-1; see below) might produce a thermal energy of erg integrated over a typical starburst period of yr. This value is indeed above the thermal energy of the hot gas in the halo region of erg, using the same assumptions for the volume of the emitting halo and the soft-band X-ray luminosity as in Sect. 3.3. This agreement between model and observations supports the hypothesis that the diffuse X-ray emission arises from hot gas originally heated by supernovae.
The luminosity of the diffuse X-ray emission in M83 of erg s-1 in the broad ROSAT energy band is very high. Even if one assumes that only the soft X-ray emission of erg s-1 of the extended and nuclear component originates from a halo above the galactic disk (Sect. 3.3) this component is still much brighter than the halo emission of the edge-on galaxies NGC 4631 ( erg s-1; Vogler & Pietsch 1996) or NGC 253, a galaxy well known for its huge X-ray halo ( erg s-1; Pietsch et al. 1997).
Not only is the absolute value of the X-ray luminosity of the diffuse component in M83 high but it also strongly dominates the total emission. Even if we take into account that 20% of the so-called diffuse emission from the disk area could in fact be point-like sources below the detection-limit of erg s-1 (Sect. 3.1), the fraction of diffuse emission in M83 is 78% of the total luminosity, comparable to the corresponding value of 70% for NGC 253 (see Table 9). Values for NGC 253 are based on results of the data analysis by Pietsch et al. (1997) and Vogler et al. (1997) for an assumed distance of 2.58 Mpc.
| luminosity in erg s-1 | M83 | NGC 253 | ||
|---|---|---|---|---|
| total | 5.7 | 100% | 0.46a | 100% |
| halo b | 1.8 | 32% | 0.17 | 37% |
| disk + bulge, diffuse c | 2.7 | 47% | 0.15 | 33% |
| disk + bulge, point-like sources | 1.2d | 21% | 0.14 | 30% |
a - only half of the total halo emission is included
for comparison with the face-on galaxy M83
b - assuming that the soft diffuse emission originates from the halo
c - the remaining part of the diffuse emission is assumed to be
present in the disk and bulge. For M83 it is reduced by 20% to account for
undetected point-like sources
d - for M83 we give the sum of detected plus estimated undetected
point-like sources
Although the luminosities of the emission components in M83 are much higher than that of NGC 253 - a fact partly explainable by the still uncertain extragalactic distances - there is an agreement of the relative contributions to the total luminosity. The (distance-independent) mean surface brightness of the soft diffuse emission of M83 is about twice that of NGC 253 (Table 10). In edge-on view the X-ray halo of M83 would probably look even more spectacular than that of NGC 253.
To search for a common reason for this difference between M83 and NGC 253 we compare these two galaxies with other galaxies where diffuse X-ray emission is detected. We do this with respect to their supernova rates and discuss also distance-independent parameters like the X-ray surface brightnesses and the energy input per surface area, , a quantity that measures the activity in the galactic disk and seems to be important for the evolution of galactic radio haloes (Dahlem et al. 1995, Dumke et al. 1995, Golla 1997). Results for four galaxies are presented in Table 10.
| Galaxy | ||||||
|---|---|---|---|---|---|---|
| (1) | (2) | (3) | (4) | (5) | (6) | (7) |
| M83 | 8.9 | 9.9 | 0.29 | 0.49 | 3.2 | 2.9 |
| NGC 253 | 2.58 | 7.7 | 0.11 | 0.15 | 1.9 | 1.5 |
| 2.3† | 22.7 | |||||
| NGC 3628 | 6.7 | 7.0 | 0.04 | 0.06 | 0.9 | 1.0 |
| NGC 4565 | 9.7 | 16.9 | 0.02 | 0.04 | 0.1 | 0.5 |
- in NGC 253 most of the star formation is limited to the
inner disk (Scoville et al. 1985: extended inner stellar disk)
(2) - assumed distance in Mpc
(3) - radial extent of star-forming disk in kpc, estimated from IRAS CPC
observations (van Driel et al. 1993)
(4) - supernova rate in yr-1, calculated from the power of nonthermal
radio emission using formulae given by Dahlem et al. (1995)
(5) - supernova rate in yr-1, calculated from FIR luminosities given
by Young et al. (1989)
(6) - mean energy input rate per unit surface area (as defined in Dahlem
et al. 1995) in erg s-1 cm-2
(7) - X-ray surface brightness in erg s-1 cm-2,
calculated over the area of soft halo emission in NGC 253, NGC 3628 and
NGC 4565 and over the extent of the soft diffuse emission in M83,
respectively.
The supernova rates and consequently the energy input rates into the interstellar medium are well correlated with the X-ray surface brightnesses. The energy input rate in case of M83 is very high and even higher than that for NGC 253 (if averaged over the whole area of star formation). The energy input rate from the inner star-forming disk of NGC 253 alone is by far the highest, a result that might explain the extreme vertical extent of the X-ray halo emission of that galaxy.
While there is increasing evidence that star formation activity in the disks of spiral galaxies is related to the existence and structure of radio haloes, further studies are needed to test the correlation between the energy input by supernovae in the disk and the surface brightness and evolution of X-ray haloes. Future X-ray satellites, with their higher spatial resolution and sensitivity especially for the soft X-ray component, will help to disentangle the emission of hot gas in haloes and disks.
An important finding of our study is that outflow models for the transport of hot gas up into the halo should not be restricted to nuclear starbursts and superwinds (Suchkov et al. 1994), but should include the whole star-forming galactic disk. M83 is a good example of a X-ray halo produced by an active star-forming disk.
Acknowledgements.
We would like to thank David Malin, AAO, for providing the optical image on M83 and Stuart Ryder, Uni. of NSW, for the H map. Jürgen Kerp, RAIUB, is acknowledged for helpful comments on the manuscript as well as Andreas Vogler, MPE, for his help during the data reduction. Our anonymous referee is acknowledged for numerous helpful suggestions. The work of ME was supported by the Deutsche Agentur für Raumfahrtangelegenheiten (DARA) project number 50 OR 9206 and 50 OR 9405 and the Deutsche Forschungsgemeinschaft (DFG) grant number Eh 154/1-1. The ROSAT project is supported by the German Bundesministerium für Bildung, Wissenschaft, Forschung und Technologie and the Max-Planck-Gesellschaft.References
- [1] Aschenbach B., 1988, Appl. Opt. 27, 1404
- [2] Avni Y., 1976, ApJ 210, 642
- [3] Beck R., Carilli C.L., Holdaway M.A., Klein U., 1994, A&A 292, 409
- [4] Bohlin R.C., Cornett R.H., Hill J.K., Smith A.M., Stecker T.P., 1983, ApJ 274, L53
- [5] Bomans D.J., Dennerl K., Kürster M., 1994, A&A 283, L21
- [6] Breitschwerdt D., Schmutzler T., 1994, Nat 371, 774
- [7] Burn B.J., 1966, MNRAS 133, 67
- [8] Chu Y.-H., Mac Low M.-M., 1990, ApJ 365, 510
- [9] Condon J.J., Condon M.A., Gisler G., Puschell J.J., 1982, ApJ 252, 102
- [10] Cowan J.J., Roberts D.A., Branch D., 1994, ApJ 434, 128
- [11] de Vaucouleurs G., de Vaucouleurs A., Corwin H.G., 1976, Second Reference Catalogue of Bright Galaxies, Univ. of Texas Press, Austin
- [12] Dahlem M., Lisenfeld U., Golla G., 1995, ApJ 444, 119
- [13] Dickey J.M., Lockman F.J., 1990, ARA&A 28, 215
- [14] Dumke M., Krause M., Wielebinski R., Klein U., 1995, A&A 302, 691
- [15] Ehle M., 1995, PhD thesis, University of Bonn
- [16] Ehle M., Beck R., 1993, A&A 273, 45
- [17] Ehle M., Pietsch W., Beck R., 1995, A&A 295, 289
- [18] Ehle M., Beck R., Haynes R.F., Vogler A., Pietsch W., Elmouttie M., Ryder S., 1996, A&A 306, 73
- [19] Fabbiano G., 1988, ApJ 330, 672
- [20] Fabbiano G., Trinchieri G., 1984, ApJ 284, 491
- [21] Fabbiano G., Feigelson E., Zamorani G., 1982, ApJ 256, 397
- [22] Fabbiano G., Trinchieri G., Macdonald A., 1984, ApJ 284, 65
- [23] Fabbiano G., Schweizer F., Mackie G., 1997, ApJ 478, 542
- [24] Gioia I.M., Maccacaro T., Schild R.E., Wolter A., Stocke J.T., Morris S.L., Henry J.P., 1990, ApJS 72, 567
- [25] Golla G., 1997. In: Lesch H., Dettmar R.-J., Mebold U., Schlickeiser R. (eds.) The physics of galactic halos, Akademie Verlag, Berlin, p. 85
- [26] Hartmann D., Burton B.W., 1996, The Leiden-Dwingeloo Atlas of Galactic Neutral Hydrogen, Cambridge Univ. Press
- [27] Hasinger G., Schmidt M., Trümper J., 1991, A&A 246, L2
- [28] Heckman T.M., Dahlem M., Eales S.A., Fabbiano G., Weaver K., 1996, ApJ 457. 616
- [29] Huchtmeier W.K., Bohnenstengel H.-D., 1981, A&A 100, 72
- [30] Immler, S., 1996, Diploma Thesis, University of Munich
- [31] Junkes N., Zinnecker H., Hensler G., Dahlem M., Pietsch W., 1995, A&A 294, 8
- [32] Kamphuis J., Sancisi R., van der Hulst J.M., 1991, A&A 244, L29
- [33] Lesch H., 1990, A&A 239, 437
- [34] Marston A.P., Elmegreen D., Elmegreen B., Forman W., Jones C., Flanagan K., 1995, ApJ 438, 663
- [35] Neininger N., 1992, PhD thesis, University of Bonn
- [36] Neininger N., Klein U., Beck R., Wielebinski R., 1991, Nat 352, 781
- [37] Neininger N., Beck R., Sukumar S., Allen R.J., 1993, A&A 274, 687
- [38] Nulsen P.E.J., Stewart G.C., Fabian A.C., 1984, MNRAS 208, 185
- [39] Ohashi T., Makishima K., Tsuru T., Takano S., Koyama K., Stewart G.C., 1990, ApJ 365, 180
- [40] Pfeffermann E., Briel U.G., Hippmann H., et al., 1987, Proc. SPIE 33, 519
- [41] Pietsch W., 1993, In: Hensler G., Theis Ch., Gallagher J. (eds.) Panchromatic View of Galaxies, p. 137
- [42] Pietsch W., Vogler A., Kahabka P., Jain A., Klein U., 1994, A&A 290, 307
- [43] Pietsch W., et al., 1997, A&A (in prep.)
- [44] Raymond J.C., Smith B.W., 1977, ApJS 35, 419
- [45] Raymond J.C., Cox D.P., Smith B.W., 1976, ApJ 204, 290
- [46] Richter O.G., Rosa M., 1984, A&A 140, L1
- [47] Rieke G.H., Lebofsky M.J., Walker C.E., 1988, ApJ 325, 679
- [48] Sandage A., Tammann G.A., 1975, ApJ 194, 559
- [49] Sandage A., Tammann G.A.: 1987, A Revised Shapley-Ames Catalog of Bright Galaxies, Carnegie Institution of Washington Publication 635, Washington D.C., 2nd Edition
- [50] Schmitt J.H.M.M., Golub L., Harnden F.R., et al., 1985, ApJ 290, 307
- [51] Scoville N.Z., Soifer B.T., Neugebauer G., Matthews K., Young J.S., Yerka J., 1985, ApJ 289, 129
- [52] Snowden S.L., Freyberg M.J., 1993, ApJ 404, 403
- [53] Snowden S.L., Pietsch W., 1995, ApJ 452, 627
- [54] Snowden S.L., McCammon D., Burrows D.N., Mendenhall J.A., 1994, ApJ 424, 714
- [55] Sofue Y., Wakamatsu K.-I., 1994, AJ 107, 1018
- [56] Suchkov A.A., Balsara D.S., Heckman T.M., Leitherer C., 1994, ApJ 430, 511
- [57] Sukumar S., Allen R.J., 1989, Nat 340, 537
- [58] Supper R., Hasinger G., Pietsch W., Trümper J., et al., 1997, A&A 317, 328
- [59] Talbot R.J., Jensen E.B., Dufour R.J., 1979, ApJ 229, 91
- [60] Tilanus R.P.J., Allen R.J., 1993, A&A 274, 707
- [61] Trinchieri G., Fabbiano G., Palumbo G.G.C., 1985, ApJ 290, 96
- [62] Trümper J., 1983, Adv. Space Res. 2, 241
- [63] van Driel W., de Graauw Th., de Jong T., Wesselius P.R., 1993, A&AS 101, 207
- [64] Vogler A., Pietsch W., 1996, A&A 311, 35
- [65] Vogler A., Pietsch W., Kahabka P., 1996, A&A 305, 74
- [66] Vogler A., et al., 1997, A&A (in prep.)
- [67] Wang Q.D., Helfand D.J., 1991, ApJ 379, 327
- [68] Wang Q.D., Walterbos R.A.M., Steakley M.F., Norman C.A., Braun R., 1995, ApJ 439, 176
- [69] Watson M., Stanger V., Griffiths R.E., 1984, ApJ 286, 144
- [70] Weedman D.W., Feldman F.R., Balzano W.A., Ramsey L.W., Sramek R.A., Wu C.-C., 1981, ApJ 248, 105
- [71] Williams R.M., Chu Y.-H., 1995, ApJ 439, 132
- [72] Wilson A.S., Elvis M., Lawrence A., Bland-Hawthorn J., 1992, ApJ 391, L75
- [73] Young J.S., Xie S., Kenney J.D.P., Rice W., 1989, ApJS 70, 699
- [74] Zimmermann H.U., Becker W., Belloni T., Döbereiner S., Izzo C., Kahabka P., Schwentker O., 1994, EXSAS User’s Guide, Edition 4, MPE Report 257