Is the Fuzziness of GRB970228 constant?
Abstract
In view of the data gathered in September 1997, we review the flux values collected so far for the ”fuzziness” seen in the optical counterpart of GRB970228. Comparison between the ground based data collected in March and the data of September 1997 suggests a fading of the fuzz. Given the diversity of the data in hand, the magnitude of the effect and its significance are not easy to quantify. Only new images, both from the ground and with the Space Telescope, directly comparable to the old ones could settle this problem.
Introduction
After the SAX positioning of GRB970228 (Costa et al. 1997), and the discovery of an optical transient in the refined error box (van Paradijs et al, 1997), the optical counterpart of GRB970228 has been observed many times both with ground based instruments and with the Hubble Space Telescope. Several days after the event, an extended optical emission was detected where the Optical Transient (OT) had been seen in the discovery image, taken 21 h after the event (van Paradijs et al, 1997). Since then, the magnitude of such an extended emission has been measured many times, by several observers, using different instrumental set-ups. In this paper we review and compare the measurements gathered so far to investigate if the flux values recently measured by STIS on HST (Fruchter et al, 1997) and by the 5m Palomar telescope (Djorgovski et al., 1997) are consistent with the ground based ones obtained at early epochs.
The Data
Table 1 summarizes the data collected so far, both for the OT integrated magnitude (ground measurements) and for the contribution of the two components : point source and extended emission (HST data). The first claim for an extended object, using an 1 hour NTT exposure taken on March , gave (van Paradijs et al 1997). To this, one should add the Keck measurement (, Metzger et al, 1997a) obtained on March but announced after the discovery of the optical transient (Groot et al. 1997a).
![[Uncaptioned image]](/html/astro-ph/9711064/assets/x3.png)
Indeed, all the March ground measurements agree in describing the extended
object as elongated in the North-South direction with . HST
observations were carried out in late March and early April using the WFPC and
a broad V filter (F606). The extended source was resolved into a point source
superimposed to a ”fuzz”, which, according to Sahu et al. (1997), were detected
at and , respectively. Comparison
of the March and April images showed that the point source was most probably
fading, while nothing definite could be said on the diffuse emission (Sahu et
al. 1997). Using the same data, Galama et al (1997) estimate an R magnitude of
for the point source and for the
fuzz. In the same paper, the value of the magnitude measured by the NTT on March
was also revised, bringing it to . More Keck observations
taken on April and gave, for the total emission, a
(Metzger et al. 1997b) i.e. significantly lower than both the HST one and the
Keck March data. In April the source became unobservable from the ground and
from HST. The observability window opened again in late August when it was
pointed both from the Keck/Palomar (IAU Circ 6732) and from HST using, this
time, the newly installed STIS. Both observations show the overall flux to be
lower than that measured previsiously. On Sept , Djorgovski et al (1997)
used the Palomar 5m telescope to obtain an R image of the field where the
extended source was detected at . The STIS instrument on board
HST also observed the source on Sept with the Clear filter. Fruchter
et al, (1997) are barely able to detect the point source, now at , over a diffuse emission of , i.e. 0.8 magnitude
fainter than in the HST March observation. This prompted a reanalysis of the
March/April WFPC data which resulted in a reassessment of their magnitude value
now estimated at , i.e. half of the flux published by Sahu
et al (1997) for two independent WFPC observations. Although not stated, a
similar downward revision should apply also to the R magnitude values published
by Galama et al (1997) for the HST observations.
However, even accepting that
the HST data, after re-analysis, can be rendered consistent, it seems very
difficult to reconcile the September STIS/Palomar data with the NTT/Keck ones of
early March. Table 1 shows that a suggestion for fading of the extended
component of the OT seems to be present. However, magnitude values do not always
render easy the comparison of data taken through different filters. The
suggestion for a significant fading of the extended source, implicit when
comparing March to September data, becomes stronger when one computes the actual
energy fluxes. This is done in Table 1, where we have transformed the magnitude
values in .
HST vs NTT
In the following, we shall compare the NTT data (kindly provided to us by Jan van
Paradijs) with the HST ones. In order to do so we have to assume that the
extended emission seen from the ground is indeed the superposition of the
fuzziness seen by HST plus a point source. If we assume that the September
STIS/Palomar
flux values for the extended source are correct, and if we further assume no
fading, we have to explain the extended total emission seen both by NTT and by
Keck with a combination of the STIS/Palomar fluxes plus a point source of
suitable magnitude. Even considering the revised NTT mag value given by Galama
et al (1997), we have to account for a total flux of . Since the extended source observed in September provides
, the unseen point source should have been
, i.e. definitely brighter that the
extended one. However, in order to simulate the appearance of such a combination
one should be able to locate the HST point source into the NTT nebulosity. This
calls for an accurate superposition of the HST March data onto the NTT/SUSI
frame. To take care of geometric distorsion, we have used the task ”mosaic”
which re-scales the HST/PC image, rebinning it to pixel size of 0.1”. The
resulting image has been rebinned and rotated onto the SUSI one (0.13”/pixel)
using a standard technique which is certainly accurate to better than 1/2 pixel
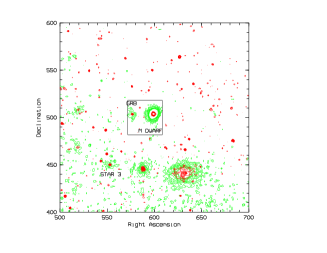
(actually 1/10 would be a more realistic estimate). Figure 1 shows the
superposition of the HST March frame onto the SUSI one. Only the central portion
of the actual images is given. Zooming on the OT, one sees clearly that the HST
point source falls in the central part of the NTT nebulosity, where the emission
is less intense and no hint of a point-like object is seen. However, the
central region of the nebulosity is just where one should put a hypothetical
point source of , corresponding to . This value is similar to the flux measured by the NTT for the faint
source just south of the GRB970228 counterpart. Such a source is in interesting
test case, since it is point-like in the HST/PC image (star #3 in Figure 1) but
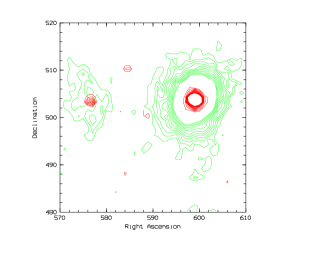
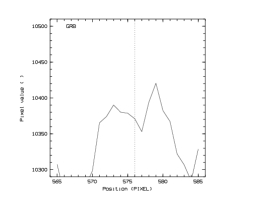
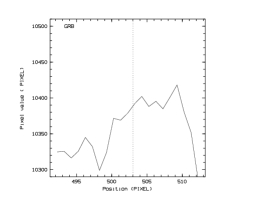
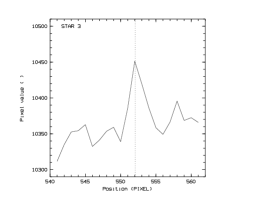
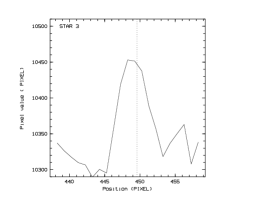
it looks extended in the NTT image. However, inspection of Figure 2, where we
have compared the Right Ascension and Declination tracings of the two sources,
shows unambigously their difference in shape for a comparable flux. While star
#3 is dominated by a clear peak superimposed to a region of higher background,
the GRB nebulosity does not show any obvious point-like contribution. This is
somewhat surprising, since a point source of should have been
far easier to detect than a extended one. Moreover, we note
that such a faint extended source would be hardly within reach of an 1 hour NTT
exposure.
Thus, the truly extended nature of the NTT source, coupled with the
lack of point source at the HST location, leads to the conclusion that the
nebulosity itself has faded away from March and Sept .
Conclusions
Although comparing fluxes obtained with different instruments, different filters and different observing conditions is not straightforward, the compilation of the magnitudes values measured so far for the optical counterpart of GRB970228 points toward a fading both of the point source and of the diffuse emission. While the fading of the point source is expected in all theoretical scenarios, the fading of the diffuse emission has far reaching consequences and, as such, is in need of a dedicated observing campaign. The data available are numerous, but too diverse to provide the constraints needed to assess with certainty if, and how much, the nebulosity has faded. Indeed, for GRB 970228, it looks as if every new observation results in a downward revision of the values previously published. Only more observations, directly comparable with those already in hand (i.e. obtained with identical instrumental-ups) can provide a definite aswer to this all important point. Of particular importance could be new HST/PC data since the unfiltered STIS image is not directly comparable to the PC ones, obtained with a broad V filter.
References
- (1) Caraveo P.A. et al,A & A. 326, L13 (1997).
- (2) Costa E. et al.Nature 387, 783 (1997).
- (3) Djorgovski S. et al IAU Circ 6732 (1997)
- (4) Fruchter, A. et al. IAU Circ. 6747(1997)
- (5) Galama T. et al. Nature 387 479 (1997)
- (6) Groot J.P. et al. IAU Circ. 6584 (1997a)
- (7) Groot J.P. et al. IAU Circ. 6588 (1997b)
- (8) Metzger M.R. et al. IAU Circ. 6588 (1997a)
- (9) Metzger M.R et al. IAU Circ. 6631 (1997b)
- (10) Sahu K. et al. Nature 387 476 (1997)
- (11) van Paradijs et al.Nature 386 686 (1997)