06 (08.13.2; 08.16.5; 08.03.4)
Myles Corcoran, E-mail: corcoran@discovery.saclay.cea.fr
Wind diagnostics and correlations with the near-infrared excess in Herbig Ae/Be stars††thanks: Based on observations made at the La Palma Observatory, the Caltech Submillimeter Observatory, and the European Southern Observatory/Max Planck Institute 2.2m Telescope.
Abstract
Intermediate dispersion spectroscopic observations of 37 Herbig Ae/Be stars reveal that the equivalent widths of their [OI]6300 and H emission lines, are related to their near-infrared colours in the same fashion as the T-Tauri stars. Such a correlation strongly supports the idea that the winds from Herbig Ae/Be stars arise in the same manner as those from T-Tauri stars, i.e. through accretion driven mass-loss. We also find that the [OI]6300 line luminosity correlates better with excess infrared luminosity than with stellar luminosities, again supporting the idea that Herbig Ae/Be winds are accretion driven. If one includes the lower mass analogues of the Herbig Ae/Be stars with forbidden line emission, i.e. the classical T-Tauri stars, the correlation between mass-loss rate and infrared excess spans 5 orders of magnitude in luminosity and a range of masses from 0.5 to approximately 10. Our observations therefore extend the findings of Cohen et al. (1989) and Cabrit et al. (1990) for low mass young stars and, taken in conjunction with other evidence (Corcoran & Ray 1997a), strongly support the presence of circumstellar disks around intermediate mass stars with forbidden line emission. An implication of our findings is that the same outflow model must be applicable to these Herbig Ae/Be stars and the classical T Tauri stars.
keywords:
Stars: mass-loss – Stars: pre-main sequence – Stars: circumstellar matter1 Introduction
Herbig Ae/Be stars (HAEBES) were first identified by Herbig (1960) as possible higher mass analogues of the classical T-Tauri stars (CTTS). Subsequent work has shown that the two classes of young stars share many observational characteristics in common over and above those one might expect on the basis of observational selection criteria alone. For example, like CTTS, the emission from a number of HAEBES is intrinsically and variably polarized (Jain & Bhatt 1995), many have IR excesses (Hillenbrand et al. 1992), water masers (Palla & Prusti 1993) and evidence for accretion as seen in the redshifted absorption components of their NaD lines (Sorelli et al. 1996). Moreover most HAEBES possess the signatures of strong mass loss, as indicated by P-Cygni line profiles (Finkenzeller & Mundt 1984; Pérez et al. 1992; Imhoff 1994), broad forbidden emission lines (Böhm & Catala 1994; Corcoran & Ray 1997a) and by their thermal radio continuum emission (Skinner et al. 1993). Estimates of their mass loss rates vary, and a number of different techniques have been used (for details see Nisini et al. 1995), but typical values are 10-8 to 10-6 M⊙/yr.
The high level of activity of this group (for a general review of HAEBES activity the reader is referred to Catala 1989) is perhaps initially surprising if one attempts to understand it from a purely stellar perspective. If its source is the star alone then one would expect the mass loss to be driven by a sub-photospheric convection zone. However, according to conventional theory (e.g. Gilliland 1986) energy transport in HAEBES is purely radiative. How then can one solve what Böhm & Catala (1995) call the “paradox” of HAEBES activity? Two approaches have been taken (Böhm & Catala 1995): the first assumes that there is an inherent source of energy, such as internal rotation (Vigneron et al. 1990), which powers a stellar dynamo, while the second attributes the activity to viscous disk accretion in a manner similar to the CTTS (Hillenbrand et al. 1992). The viscous accretion disk model might, at first sight, seem more plausible given the observed IR excesses of most HAEBES (e.g. Hillenbrand et al. 1992), however, alternative explanations for the IR excesses have been put forward, based on the idea that HAEBES are surrounded by quasi-spherical clouds of gas and dust (Berrilli et al. 1992; Hartmann et al. 1993; Miroshnichenko et al. 1997). At the same time, however, a number of HAEBES are associated with collimated optical and molecular outflows (Mundt & Ray 1994) and given, what appears to be, the intimate connection between disks and outflows in CTTS (see, for example, Edwards et al. 1993) this would lead one to think that disks are present at least around a significant fraction of the HAEBES population. Thus the question still remains whether the standard disk model, developed to explain many of the observational features of CTTS (e.g. Bertout et al. 1988), is applicable to the higher mass HAEBES, or at least to those which, like the CTTS, have forbidden line emission (see also Ghandour et al. 1994; Corcoran & Ray 1997a)?
If accretion disks, perhaps in association with stellar magnetic fields, provide the energy for driving HAEBES winds, one would expect a correlation to exist between the accretion rate, , and the wind mass-loss rate, . Such a correlation is found for the CTTS (Cabrit et al. 1990; Edwards et al. 1993), however, there are a number of important points that must be borne in mind before one can attempt a similar study for the HAEBES. Both and are difficult to quantify and so appropriate substitutes have to be found. In the case of the CTTS, Cabrit et al. (1990) and Edwards et al. (1993) used CTTS forbidden [OI] line emission as a measure of wind strength and their infrared excess as a measure of accretion rate. Such an approach for CTTS can be justified since there is clear evidence that the forbidden [OI] line emission originates in a wind (e.g. Edwards et al. 1993) and because the infrared excess in CTTS correlates with the veiling continuum flux (see, for example, Hartigan et al. 1995), supporting the notion that the excess arises from viscous accretion. Can one use an identical strategy for HAEBES?
In the literature there has been some question as to whether the forbidden line emission in HAEBES arises in the same manner as in CTTS (see, for example, Böhm & Catala 1994). A recent study by us (Corcoran & Ray 1997a) however shows clear parallels between the forbidden line emission as observed in HAEBES and CTTS (see, for example, Hartigan et al. 1995). In particular double line profiles, consisting of high and low velocity blueshifted components, are found in a number of HAEBES although, like CTTS (Hartigan et al. 1995), single low velocity blueshifted emission is by far the norm. The observation that the forbidden line emission of HAEBES is usually blueshifted, as with the CTTS, strengthens the conclusion that, it is formed in a stellar wind. Moreover the lack of any corresponding redshifted components also argues that an obscuring disk is present (Corcoran & Ray 1997a). We will therefore take the approach in this paper that the strength of the forbidden line emission can be used to gauge the strength of the wind from a HAEBES. There is some question whether the same approach can be taken in the case of the hydrogen emission lines. For example, it was thought in the past that the H line could be used as a gauge of wind strength; current modeling of H line profiles would suggest, however, that it is probably a better measure of accretion (Calvet 1997). In any event, we study both [OI] forbidden and H line strengths here to see whether the same phenomenological relationships exists between these quantities as in the CTTS. Moreover we also look at how both quantities depend on our more ‘traditional’ measure of accretion, again to test the analogy with CTTS.
Turning now to the measurement of in HAEBES, this is somewhat problematic for various reasons. Accretion disk theory would suggest that we use either the excess UV emission, which may arise from magnetic accretion columns close to the star, or that part of the infrared excess which derives from viscous dissipation in the circumstellar disk. The UV fluxes of these stars are poorly known (although, indications of a far UV excess in a number of cases is observed, Grady et al. 1993) so we are forced to consider the infrared excess. The infrared excess, however, has two components which are difficult to disentangle: the first is due to reprocessed starlight in the disk and the second is due to heating by viscous accretion. For an optically thick, but geometrically thin, flat disk up to one quarter of the luminosity of the star, depending on the viewing angle, can be “reprocessed” (see, for example, Adams et al. 1987 and Strom et al. 1993). Moreover if the disk is “flared” (Kenyon & Hartmann 1987) even more light can appear as an “excess” although the contribution due to flaring is thought to be only important at mid-infrared or longer wavelengths. In the case of the CTTS samples (e.g. Hartigan et al. 1995), one is dealing with a large number of stars of similar stellar photospheric luminosity but with widely different accretion rates, thus despite the “contaminating” effects of reprocessed light, statistically one can readily distinguish, for example, a correlation of the forbidden line strength with the accretion luminosity. The situation with HAEBES is not so clear-cut: HAEBES stellar luminosities can differ by factors of 105 (Hillenbrand et al. 1992) and one is dealing with statistical samples that are comparable in number to the CTTS samples. Thus a high degree of dependence on the stellar luminosity is introduced since, as one might expect, in absolute terms both the amount of reprocessed light and, to some extent, the accretion luminosity (see, e.g. Hillenbrand et al. 1992) tend to scale with the stellar luminosity. This tendency for both the accretion and reprocessed contributions to increase with stellar luminosity in HAEBES, coupled with their large range in luminosities, gives rise to, as we shall see, unavoidable correlations of the strength of the forbidden line emission not only with the infrared excess, as per CTTS, but with the stellar luminosity as well. A similar result was found by Nisini et al. (1995) when they studied a small sample of 14 HAEBES, although in their case they erroneously (see above) used the intensity of near-infrared HI recombination lines as a measure of the wind strength. Obviously any correlation between the strength of the forbidden line emission and the stellar luminosity, can be used to support the idea, expressed by several authors (e.g. Böhm & Catala 1994), that HAEBES winds are stellar rather than accretion driven. In the absence of a large sample of HAEBES within a narrow stellar luminosity range, statistically the question then becomes one of whether or not forbidden line emission is more tightly correlated with infrared excess than with stellar luminosity.
An alternative approach to circumvent any strong dependence on stellar luminosity is, in a sense, to “factor it out” as much as possible. In particular one can compare the equivalent width of forbidden line emission, and for that matter Balmer emission, with infrared colours since it is well known that the relative strength of the forbidden line emission, for example, increases with increasing redness in CTTS samples (Edwards et al. 1993). Moreover, Hartigan et al. (1995) found a clear correlation between the “veiling” index and K-L colour in CTTS, implying essentially a link between the ratio of the accretion luminosity and the stellar luminosity, Lacc/L∗, and near-infrared colour. If the equivalent width of the forbidden line emission in HAEBES is then found to vary in the same way with colour as with the CTTS, then this would clearly point to accretion as the driving force for HAEBES winds. We initially adopt this promising approach here before considering any correlations of our wind measures with stellar or excess infrared luminosities.
Finally, a relationship is also looked for between the strength of the HAEBES winds, as measured by the [OI] line luminosity, and the amount of circumstellar dust present, as indicated by mass estimates from mm continuum measurements. We find, in contradiction to the result of Nisini et al. (1995), who used a smaller sample, that there may be a weak correlation between the luminosity of the [OI] line and the amount of circumstellar matter. As will be described in the text, however, one has to be cautious in interpreting this result.
After outlining the details of our observations and data reduction techniques in §2, we present the results of our study in §3 and discuss its consequences in §4.
2 Observations and data reduction
Our data derive primarily from three observing runs in La Palma on the Isaac Newton Telescope (INT) with the Intermediate Dispersion Spectrograph (IDS) from 28 August – 4 September 1991, 6–12 July 1993 and 14–20 December 1994. Further observations were taken in La Silla with the ESO/MPI 2.2m Telescope using EFOSC-II from 23 December 1991 – 1 January 1992. The instrumental details are listed in Table 1.
| Spec. | Grating+CCD | Disp. | Res. | Range |
|---|---|---|---|---|
| (Å pixel-1) | (kms-1) | (Å) | ||
| IDS | R632V+GEC6 | 0.70 | 66 | 400 |
| R632V+EEV5 | 0.70 | 66 | 715 | |
| R1200Y+GEC6 | 0.36 | 34 | 205 | |
| R1200Y+EEV5 | 0.36 | 34 | 370 | |
| R1200Y+TEK3 | 0.39 | 39 | 500 | |
| H1800V+GEC6 | 0.22 | 21 | 120 | |
| EFOSC 2 | Grism 9 | |||
| +Thompson CCD | 1.11 | 105 | 1145 |
The combined dataset from the three La Palma observing runs and the La Silla run form a database of H and/or [OI]6300 observations of 57 Herbig Ae/Be stars. A subset was selected of this database of stars for which full photometric data was available in the literature (from the R to the N bands) and for which we had an exposure including the [OI]6300 region. A total of 37 stars met these two criteria and are listed in Tables 2 and 3. The excluded stars include both those for which we were unable to obtain (due to time constraints and/or weather problems) an exposure of the [OI]6300 region and those with photometric coverage insufficient to provide the necessary data for the calculation of the near infrared luminosity and excess.
Data reduction was carried out using standard IRAF111The IRAF software is distributed by the National Optical Astronomy Observatories under contract with the National Science Foundation routines. Bias subtraction and flat-fielding corrections were determined from zero second exposures and tungsten lamp exposures respectively. The adjacent sky spectrum was subtracted from the object spectra, and the dispersion solutions were determined from CuAr arc exposures.
Photometric data for HAEBES in the infrared and millimeter wavelengths were in most cases taken from the literature (Hillenbrand et al. 1992; Hamann & Persson 1992) although it was found necessary to supplement these data with additional mm observations in the case of some stars. These millimeter continuum data were obtained at the Caltech Submillimeter Observatory (CSO) on Mauna Kea in April 1992. A 3He-cooled germanium bolometer served as our detector with a beam size of 30′′ (FWHM). Uranus and 3C 273 were used as calibration standards. The CSO data was reduced as described in Beckwith & Sargent (1991).
| Name | SpTy | Dist | Grp. | W([OI]) | W(H) | H-K | K-L | L-M | M-N | 12-25m | |
|---|---|---|---|---|---|---|---|---|---|---|---|
| (pc) | (mag) | (Å) | (Å) | (mag) | (mag) | (mag) | (mag) | (mag) | |||
| LkH 198 | A5 | 600 | 2.5 | II | 1.37 | 40.50 | 1.43 | 2.08 | 0.28 | 2.95 | 2.71 |
| V376 Cas | F0 | 600 | 2.9 | II | 1.61 | 33.40 | 1.77 | 1.86 | 0.15 | 3.54 | 2.67 |
| BD+61 154 | B8 | 650 | 2.1 | I | 0.18 | 44.10 | 1.05 | 1.30 | 0.20 | 2.08 | 1.79 |
| Elias 1† | A6 | 160 | 4.1 | II | 0.02 | 20.60 | 0.98 | 1.00 | 0.40 | 3.14 | 2.80 |
| AB Aur | A0 | 160 | 0.4 | I | 0.11 | 26.30 | 0.67 | 1.08 | 0.38 | 2.52 | 2.14 |
| HK Ori | A5 | 460 | 1.2 | I | 1.75 | 63.10 | 1.01 | 1.36 | 0.71 | 2.39 | 1.68 |
| V380 Ori | B9 | 460 | 1.7 | I | 0.97 | 71.00 | 0.97 | 1.25 | 0.61 | 1.72 | 0.95 |
| BF Ori† | F2 | 460 | 0.0 | I | 0.02 | 3.70 | 1.04 | 1.43 | 0.80 | 1.54 | 1.22 |
| HD 37490† | B2 | 360 | 0.4 | III | 0.01 | 12.52 | 0.01 | 0.12 | 0.04 | 1.44 | 1.01 |
| MWC 137† | B0 | 1300 | 4.5 | I | 0.02 | 14.80 | 0.76 | 1.12 | 0.98 | 1.51 | 2.49 |
| LkH 215† | B8∗ | 800 | 2.1 | I | 0.02 | 26.70 | 0.63 | 0.98 | 0.54 | 1.10 | 1.85 |
| HD 259431 | B2 | 800 | 1.6 | I | 0.53 | 52.90 | 0.88 | 1.25 | 0.29 | 1.98 | 2.14 |
| R Mon | B0 | 800 | 4.3 | II | 3.16 | 93.10 | 1.47 | 2.16 | 0.70 | 2.44 | 2.50 |
| LkH 25 | A0 | 800 | 0.6 | II | 1.63 | 58.20 | 1.27 | 1.73 | 1.06 | 3.41 | 3.72 |
| HD 52721† | B1 | 1150 | 1.0 | III | 0.01 | 8.75 | 0.08 | 0.16 | 0.28 | 1.06 | 3.02 |
| LkH 218† | B9 | 1150 | 1.5 | I | 0.06 | 31.90 | 0.50 | – | – | – | – |
| HD 53367† | B0 | 1150 | 2.3 | III | 0.01 | 5.00 | 0.13 | 0.22 | 0.15 | 0.36 | 3.97 |
| NX Pup | A7∗ | 450 | 1.5 | I | 0.90 | 44.20 | 1.15 | 1.52 | 0.48 | 0.06 | 1.79 |
| HD 76534† | B3 | 870 | 1.0 | III | 0.02 | 14.30 | 0.01 | 0.28 | 0.29 | 0.04 | 2.49 |
| HD 97048 | B9 | 215 | 1.3 | I | 0.16 | 51.10 | 0.62 | 1.37 | 0.02 | 2.31 | 2.90 |
| HD 150193† | A2 | 160 | 1.5 | I | 0.04 | 7.82 | 0.71 | 1.25 | 0.36 | 2.68 | 1.37 |
| KK Oph | A6 | 160 | 1.6 | I | 1.69 | 44.90 | 1.23 | 1.58 | 1.39 | 1.08 | 1.65 |
| HD 163296† | A0 | 160 | 0.3 | I | 0.03 | 22.50 | 0.83 | 1.20 | 0.37 | 2.43 | 1.73 |
| MWC 297 | O9 | 450 | 8.3 | I | 8.20 | 102.60 | 0.92 | 1.43 | 0.30 | 1.37 | 1.93 |
| VV Ser | B9 | 440 | 3.0 | I | 0.44 | 31.80 | 0.90 | 0.95 | 0.04 | 1.90 | 1.31 |
| BD+40∘ 4124 | B2 | 1000 | 3.0 | I | 1.10 | 31.80 | 0.92 | 1.21 | 0.97 | 1.73 | – |
| BD+41∘ 3731† | B3 | 1000 | 0.9 | III | 0.02 | ABS | 0.16 | 0.26 | – | – | – |
| HD 200775 | B2 | 600 | 2.0 | I | 0.14 | 17.70 | 0.66 | 1.20 | 0.40 | 1.19 | 2.67 |
| LkH 234 | B7∗ | 1000 | 3.4 | I | 0.03 | 52.10 | 1.03 | 1.36 | 0.44 | 2.09 | 3.04 |
| BD+46 3471 | A0 | 900 | 1.0 | I | 0.45 | 19.70 | 0.89 | 1.20 | 0.48 | 1.26 | 1.56 |
| LkH 233 | A5 | 880 | 2.6 | II | 1.02 | 26.40 | 1.52 | 2.06 | 0.48 | 2.77 | 3.18 |
| MWC 1080 | B0 | 1000 | 5.3 | I | 0.24 | 94.20 | 0.93 | 1.54 | 0.24 | 1.37 | 1.78 |
| PV Cep | F2 | 500 | 7.0 | II | 13.80 | 87.20 | 1.15 | 1.78 | 0.52 | 2.8 | – |
| Z CMa | F5 | 1150 | 2.8 | II | 2.54 | 24.80 | 0.80 | 1.66 | 0.96 | 1.69 | – |
| V645 Cyg | A0 | 3500 | 3.1 | II | 6.00 | 57.40 | 1.98 | 1.95 | 1.25 | 1.88 | – |
| BD+65 1637† | B9 | 1000 | 1.9 | III | 0.04 | 12.71 | 0.03 | 0.51 | 0.41 | – | – |
| LkH 134 | B2∗ | 700 | 2.1 | – | 0.50 | 31.54 | 0.85 | 0.70 | 2.35 | 2.57 | – |

| Name | V | R | BC | L[OI] | LHα | Lire | L∗,nir | L∗ |
| (mag) | (mag) | (mag) | (L⊙) | (L⊙) | (L⊙) | (L⊙) | (L⊙) | |
| LkH 198 | 14.32 | 12.93 | -0.15 | 9.2e-04 | 2.7e-02 | 76.9 | 0.7 | 6.40 |
| V376 Cas | 15.50 | 14.28 | -0.08 | 4.1e-04 | 8.4e-03 | 74.6 | 0.5 | 2.90 |
| BD+61 154 | 10.38 | 9.92 | -0.85 | 1.8e-03 | 4.3e-01 | 131 | 22.4 | 371 |
| Elias 1† | 15.30 | 14.10 | -0.14 | 5.0e-06 | 9.5e-04 | 8.40 | 0.1 | 0.80 |
| AB Aur | 7.07 | 6.82 | -0.40 | 3.7e-04 | 8.9e-02 | 31.3 | 5.4 | 65.5 |
| HK Ori | 11.66 | 11.20 | -0.15 | 1.5e-03 | 5.2e-02 | 15.3 | 1.5 | 13.1 |
| V380 Ori | 10.37 | 9.95 | -0.66 | 3.6e-03 | 2.6e-01 | 49.7 | 7.0 | 109 |
| BF Ori† | 11.92 | 11.57 | -0.06 | 5.4e-06 | 1.0e-03 | 6.30 | 0.5 | 3.10 |
| HD 37490† | 4.57 | 4.57 | -2.23 | 1.5e-03 | 1.7e-00 | 551 | 349.4 | 17900 |
| MWC 137† | 11.84 | 10.74 | -3.17 | 1.8e-03 | 1.3e-00 | 639 | 173.1 | 29900 |
| LkH 215† | 10.36 | 9.94 | -0.85 | 2.9e-04 | 3.9e-01 | 108 | 41.6 | 573 |
| HD 259431 | 8.70 | 8.40 | -2.23 | 2.3e-02 | 2.3e-00 | 310 | 110.2 | 5950 |
| R Mon | 12.80 | 12.17 | -3.17 | 2.0e-02 | 7.3e-01 | 305 | 21.2 | 3890 |
| LkH 25 | 12.75 | 12.55 | -0.40 | 8.0e-04 | 2.9e-02 | 9.20 | 0.9 | 10.5 |
| HD 52721† | 6.62 | 6.63 | -2.50 | 2.4e-03 | 2.9e-00 | 1420 | 932.8 | 61600 |
| LkH 218† | 11.87 | 11.55 | -0.66 | 2.8e-04 | 1.5e-01 | 36.5 | 9.1 | 142 |
| HD 53367† | 7.02 | 6.65 | -3.17 | 6.3e-03 | 3.5e-00 | 3380 | 1456.0 | 261000 |
| NX Pup | 10.61 | 10.20 | -0.12 | 2.2e-03 | 1.1e-01 | 44.0 | 4.2 | 42.3 |
| HD 76534† | 7.96 | 7.83 | -1.77 | 1.2e-03 | 8.3e-01 | 260 | 122.4 | 5240 |
| HD 97048 | 8.46 | 8.20 | -0.66 | 4.9e-04 | 1.6e-01 | 21.0 | 5.5 | 95.7 |
| HD 150193† | 8.80 | 8.41 | -0.25 | 6.4e-05 | 1.3e-02 | 14.7 | 2.8 | 31.9 |
| KK Oph | 10.57 | 10.09 | -0.14 | 6.1e-04 | 1.6e-02 | 8.80 | 0.8 | 6.20 |
| HD 163296† | 6.83 | 6.77 | -0.40 | 9.9e-05 | 7.4e-02 | 26.0 | 5.8 | 74.5 |
| MWC 297 | 12.17 | 9.45 | -3.34 | 3.4e+00 | 4.2e+01 | 2830 | 449.1 | 102000 |
| VV Ser | 11.87 | 11.21 | -0.66 | 1.1e-03 | 7.8e-02 | 58.3 | 5.1 | 83.0 |
| BD+40 4124 | 10.54 | – | -2.23 | 5.8e-02 | 1.7e-00 | 1260 | 124.4 | 6190 |
| BD+41 3731† | 9.87 | – | -1.77 | 2.8e-04 | ABS | 51.3 | 28.2 | 1090 |
| HD 200775 | 7.36 | 6.88 | -2.23 | 1.8e-02 | 2.3e-00 | 738 | 308.0 | 16600 |
| LkH 234 | 11.90 | 10.90 | -1.04 | 6.5e-03 | 1.1e-00 | 183 | 42.1 | 855 |
| BD+46 3471 | 8.21 | 7.89 | -0.40 | 2.7e-02 | 1.2e-00 | 299 | 93.7 | 1260 |
| LkH 233 | 13.56 | 12.62 | -0.15 | 2.1e-03 | 5.4e-02 | 35.0 | 3.5 | 30.3 |
| MWC 1080 | 11.68 | 10.55 | -3.17 | 2.5e-02 | 9.8e+00 | 1430 | 235.6 | 42900 |
| PV Cep | 17.76 | 16.44 | -0.06 | 4.8e-03 | 3.0e-02 | 41.8 | 1.1 | 10.8 |
| Z CMa | 9.33 | 8.12 | -0.04 | 6.4e-01 | 6.3e-00 | 4250 | 335.8 | 2760 |
| V645 Cyg | 15.00 | 14.10 | -0.40 | 6.9e-02 | 6.6e-01 | 10600 | 17.6 | 254 |
| BD+65 1637† | 10.08 | 9.53 | -0.66 | 1.2e-03 | 3.7e-01 | 131 | 58.9 | 809 |
| LkH 134 | 12.00 | – | -2.23 | 1.5e-03 | 9.2e-02 | 16.8 | 3.3 | 345 |
The [OI] and H line luminosities were calculated from the absolute line equivalent widths and the continuum luminosity in the R band, centred on 7000Å, using , where is the distance to the source, Fλ is the flux density of the R band corrected for extinction and Wline is the absolute emission line equivalent width in angströms. This method was used as a number of the observations lacked suitable flux calibration standards that would allow a direct measurement of the line luminosities. In the case of three stars (BD+40∘ 4124, BD+41∘ 3731 and LkH 134) no R band observations were available and the V magnitude was used, extrapolated to the R band, e.g. from the SEDs in Hillenbrand et al. (1992). Estimated errors for the luminosities are typically no better than 20% depending on the uncertainties in the visual extinction and actual R band magnitude of the source at the time of observation. Uncertainties in the distance and visual extinction estimates can introduce sizable errors, see Discussion. Estimates of the visual extinction, particularly, vary greatly in the literature (e.g. LkH 198 with a quoted Av of 2.5 in Hillenbrand et al. 1992 and an Av of 5 in Berrilli et al. 1992) and reflect the uncertainty in the dust composition and distribution about these stars.

Table 2 lists the 37 HAEBES selected from our dataset according to the criteria described above. Of these 24 show [OI]6300 emission. The remaining 13 stars have no [OI]6300 emission and are marked with a (†) and the detection limit quoted is an upper limit for W([OI]). These will be discussed later. The broad band photometry values in Table 2 are taken from Hillenbrand et al. (1992) with the exception of the stars PV Cep, Z CMa, V645 Cyg and LkH 134 which are from Hamann & Persson (1992). All are corrected for interstellar extinction, using the visual extinctions quoted in Hillenbrand et al. (1992) and Hamann & Persson (1992), assuming the standard interstellar reddening curve with , and that the ratio of the absorption values, scale, with wavelength, as tabulated in Scheffler & Elsässer (1982). Table 3 presents the calculated luminosities of [OI]6300 and H, along with the infrared and stellar (photospheric) luminosities for the 37 HAEBES. The V and R magnitudes of the stars as well as the bolometric correction applied in each case is also listed.


3 Results
3.1 Relative wind strength and near-IR colours
A number of infrared colours were chosen to sample the dust temperature gradient and, indirectly, the accretion activity; H-K, K-L, L-M, M-N, and IRAS 12 and 25m fluxes converted to magnitudes (see Table 2). The near-infrared photometry (H; 1.65m, K; 2.2m, L; 3.6m, M; 4.8m, N; 10.2m) and the IRAS observations at 12m and 25m effectively sample different temperature regimes of the circumstellar dust, ranging from about 1700K (i.e. close to the dust sublimation point) at 1.65m to about 100K at 25m (these are approximate values from Wein’s displacement law). The IR colours are accurate to approximately 0.02 mag.
Fig. 1 plots the relationship between the absolute equivalent widths of [OI]6300 and H and the near-IR colours H-K and K-L, given in Table 2. The HAEBES are clearly separated into three distinct regions of the plot depending on their Hillenbrand et al. (1992) group (see Table 2). Here we recall that Hillenbrand et al. (1992) classified HAEBES by the slope of their near-infrared spectral energy distribution (SED). Group I stars show SEDs with a declining slope in the near-infrared that can be modeled with a geometrically flat optically thick disk with a T temperature law. The Group II stars have SEDs with flat or rising slopes in the near to mid-infrared, and the Group III Herbig stars have near-infrared SEDs with little or no deviation from a normal stellar spectrum. The Group III stars in our sample all show values of H-K and K-L close to the values expected for main-sequence B-type stars () and no detectable [OI]6300 emission. Their distinct separation from the Group I & II stars in Fig. 1 is analogous to the division between the weak-line T Tauri stars (WTTS) and the CTTS in the corresponding plots for lower mass stars (Edwards et al. 1993). All of the Group III stars in our sample show absolute equivalent widths of H 15Å. The possibility of the Group III stars being an intermediate mass analogue to the WTTS is discussed later. The cut-off colour indices for the Group I stars are H-K = 0.4 and K-L = 0.8 in line with the Hillenbrand et al. (1992) definition of this group (see also §4.1). The transition from Group I to Group II stars is then one of increasing redness as the relative contribution from the near-infrared to the SED goes up.
A clear result in Figs. 1a and 1b is that the equivalent width of [OI] emission, W([OI]), scales with H-K and K-L and, in particular, the 3 groups have very different [OI] emission line properties. While the Group III stars, i.e. those without optically thick disks (H-K 0.4 and K-L 0.8), have no detectable [OI] emission, the equivalent width of the [OI] emission for Group I stars rises by over 2 orders of magnitude with increasing K-L. The Group II YSOs then constitute those stars with the largest [OI] equivalents widths. The results for the W(H) vs. H-K & vs. K-L (Figs. 1c, d) are found to be comparable to those for W([OI]). A similar effect was discovered by Ghandour et al. (1994) for a smaller sample of HAEBES when looking for a correlation between the equivalent width of [OI]6300 and I-N colour. As Ghandour et al. (1994) were comparing the ratio of the flux at 0.9m (I) and 10.6m (N) they did not find as clear a separation (for reasons that will be discussed shortly) between the Group III stars and the Group I and II stars as we do here.
A very interesting finding, if we compare Figs. 1b and 1d with Fig. 2 of Edwards et al. (1993), is that the dependence of both [OI] and H equivalent width on K-L is virtually identical in both the HAEBES and CTTS. As in the CTTS, the absolute value of the [OI] equivalent width is found to vary in the HAEBES by approximately two orders of magnitude, from 0.1 to 10Å, as K-L is increased from 0.5 to 1.5 while the corresponding relative change in the H equivalent width, from 10 to about 100Å, is smaller, only one order of magnitude. Such close parallels in phenomenological relationships argue strongly that the same basic accretion/outflow process is operating in both groups of stars.
The good degree of correlation between [OI]6300 equivalent width and near-IR colours for the HAEBES does not extend to colours longward of 4.0m. Moreover in the corresponding plots at longer wavelengths, the 3 Hillenbrand et al. (1992) groups do not occupy distinct regions of IR colours as in Fig. 1. For example, comparisons of the W([OI]) vs. L-M show little correlation of the two variables. The circumstellar conditions giving rise to the L-M, M-N and IRAS 12m - 25m colours must depart significantly from the conditions in the inner region (as indicated by the H-K and K-L colours). Note that the material emitting at m is typically situated at about an AU from an A0 star (assuming a flat optically thick reprocessing disk with an temperature law). [Table 4, which will be discussed later, shows the results of two survival analysis tests on the W([OI]) vs. IR colours data. Both tests agree with the visual correlations seen in Fig. 1 and confirm the lack of correlation between W([OI]) and L-M, M-N & IRAS 12-25m colours.]
| Plotted Variables | Gen. Kendall’s Tau | Cox’s Prop. Hazard | ||
|---|---|---|---|---|
| Z-value | Prob. | Prob. | ||
| W([OI]) vs. H-K | 4.47 | 0.0001 | 23.90 | 0.0001 |
| W([OI]) vs. K-L | 4.74 | 0.0001 | 22.13 | 0.0001 |
| W([OI]) vs. L-M | 2.09 | 0.0371 | 3.43 | 0.0641 |
| W([OI]) vs. M-N | 1.60 | 0.1107 | 3.02 | 0.0824 |
| W([OI]) vs. 12m - 25m | 0.019 | 0.9847 | 0.002 | 0.9678 |
| W() vs. H-K | 3.73 | 0.0002 | 15.94 | 0.0001 |
| W() vs. K-L | 3.88 | 0.0001 | 15.13 | 0.0001 |
| W() vs. L-M | 0.86 | 0.3900 | 0.93 | 0.3338 |
| W() vs. M-N | 1.41 | 0.1588 | 2.73 | 0.0984 |
| W() vs. 12m - 25m | 0.078 | 0.94 | 0.005 | 0.9423 |
| K-L vs. Lire/L∗ | 3.38 | 0.0007 | 11.89 | 0.0006 |
| L[OI] vs. Lire | 3.67 | 0.0002 | 22.19 | 0.0001 |
| LHα vs. Lire | 4.96 | 0.0001 | 6.89 | 0.0087 |
| L[OI] vs. L∗ | 2.31 | 0.209 | 0.03 | 0.8575 |
| LHα vs. L∗ | 5.53 | 0.0001 | 2.81 | 0.0936 |
| Lire vs. L∗ | 3.87 | 0.0001 | 3.39 | 0.0655 |
| L[OI] vs. LHα | 3.13 | 0.0017 | 1.37 | 0.2415 |
| L[OI] vs. Mcs | 3.02 | 0.0025 | 8.59 | 0.0034 |
| Lire vs. Mcs | 2.97 | 0.0030 | 19.14 | 0.0001 |
| L∗ vs. Mcs | 1.85 | 0.0645 | 0.87 | 0.3503 |
Fig. 2a plots K-L colour against the normalized infrared excess, Lire/L∗. Lire and L∗ are listed in Table 3 and are defined more precisely below, but can be taken as the excess IR luminosity roughly over the range 1–10m and the stellar bolometric luminosity, as determined using the reddening corrected visual magnitude, respectively. From Fig. 2a it can be seen that K-L colour is correlated with Lire/L∗ and that the correlation extends to values of Lire/L∗ well beyond the expected regime for pure reprocessing disks. Moreover an identical correlation (e.g., Edwards et al. 1993) with approximately the same slope and a similar range in (K-L, Lire/L∗) space is found for the T Tauri stars (TTS). This clearly suggests that, as with the TTS, K-L is a measure of the normalized accretion luminosity (Lacc/L∗).
In Fig. 2b we have plotted our relative measure of wind strength, W([OI]), against W(H). Not surprisingly the two equivalents widths appear correlated and the correlation is exactly the same as found with the CTTS (e.g., Cabrit et al. 1990) with the same typical ratio between the [OI] and H line strengths. In particular Fig. 2b also shows that those Group I stars with no detected [OI]6300, have low absolute H equivalent widths.
3.2 Luminosity measurements
For the purposes of the analysis here, a number of quantities are defined. The observed near-IR luminosity, Lnir, is the luminosity of a given star over the spectral range 0.7m – 10.2m. The corresponding photospheric luminosity, L∗,nir, is calculated as the integrated emission from a blackbody of temperature Teff and radius as given by Hillenbrand et al. (1992). Consequently, the infrared excess, Lire, is = Lnir - L∗,nir. This is the value we use as a diagnostic of the accretion luminosity. The stellar luminosity, L∗ quoted in Table 3 is calculated from the reddening corrected visual magnitude of each star, with visual extinctions from Hillenbrand et al. (1992) and Hamann & Persson (1992), using L∗/ and main-sequence bolometric corrections (Zombeck 1990).
All the Lnir luminosities were calculated, assuming spherically isotropic emission, by a trapezoidal integration of the published photometry (Hillenbrand et al. 1992; Hamann & Persson 1992) over the spectral range covered by the bands R to N (roughly 0.7m – 10.2m)111This wavelength range was chosen because any signature of accretion is more likely to be dominant in the near-infrared whereas one expects a proportionally increased contribution from reprocessed light at longer wavelengths. This should be particularly notable in the case of a flared disk (Kenyon & Hartmann 1987) where the contribution from reprocessed light at 60m with a surface scaling as can be increased by a factor of 10, for z = 9/8 or a factor of 33, for z = 5/4, over that from a flat disk (z=0)..
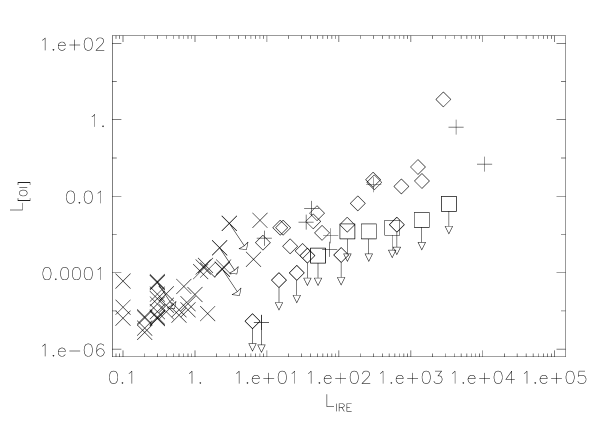
The results of the various luminosity correlation investigations are plotted in Figs. 3, 4 and 5. Figs. 3a, b compare the [OI]6300 emission line luminosity with Lire and L∗ respectively to determine the relationship between our diagnostic of wind mass-loss rate with the accretion and stellar luminosities respectively. Figs. 3c, d are the corresponding plots for the H line luminosity. Fig. 4 shows the Lire vs. L∗ relationship and the comparison of the two emission line luminosities against each other. Fig. 5 is a combined plot showing L[OI] line luminosity against Lire for our sample of HAEBES and the TTS sample of Cabrit et al. (1990).
The data points in Fig. 3 are separated by group (according to Hillenbrand et al. 1992), with downward arrows indicating those stars with upper limits to the observed [OI]6300 emission. One can see that there is a clear relationship between L[OI] our wind tracer, LHα, and Lire (Figs. 3a and c). As discussed in the Introduction, we expect, and find, that L[OI] and LHα also correlate with L∗ although the correlations (Figs. 3b and d) are not as good as with Lire(see also the results of the statistical tests which are described below). Note, once again, that all of the Group III stars show no detected [OI]6300 emission and have only upper limits plotted in Fig. 3. Fig. 4a shows the expected correlation between Lire and L∗ although we note that the Group II stars show the greatest scatter in the plot reflecting their wide range of accretion luminosities for a given L∗. In Fig. 4b we see that L[OI] is typically 1% of LHα underlying the point, already made by Fig. 2b, that, while we might expect some forbidden line emission even from those stars with weak H emission, it will be difficult to detect. Fig. 5, shows a plot of L[OI] against Lire again but this time we have included the corresponding data for 36 TTS from Cabrit et al. (1990). Note that the Lire calculated here is equivalent to the near to mid-IR excess luminosity, Lmir as defined in Cabrit et al. (1990). Comparing the data for the two classes of stars we find a smooth continuation of the correlation between the two variables over a luminosity range of 5 orders of magnitude. The mass range sampled covers to approximately 10 M⊙. In Cabrit et al. (1990) and Fig. 5 there are four TTS marked with arrows indicating that they are continuum sources (cont/e) in Cabrit et al. (1990) which may have incorrectly calculated visual extinctions. Cabrit et al. (1990) note that decreasing their by 1 moves them in the direction indicated by the arrows, reducing the degree to which they deviate from the trend shown by the HAEBES and the TTS.
The visual impression of correlations is supported by two statistical survival analysis tests. The Generalized Kendall’s Tau and Cox’s Proportional Hazard tests determine the probability that a random set of uncorrelated (x,y) points show the same observed degree of correlation (see, for example, Isobe et al. 1986). The tests deal with censored bivariate data and, therefore, the stars with no detected [OI]6300 emission are included in the set as having line emission equal to the upper limits determined from the minimum detection level in each case. The results of the survival analysis tests are shown in Table 4, and indicate that the likelihood of the observed correlation occurring by chance for L[OI] and LHα vs. Lire is very small.
It is interesting to note that the tests show the LHα vs. Lire correlation and the LHα vs. L∗ correlation are statistically equally probable, whereas the L[OI] vs. Lire correlation is much tighter than the correlation between L[OI] and L∗. We had already noted this to be the case on the basis of visual inspection. The fact that the relationship between the line luminosity L[OI] and the stellar luminosity is weaker than that between L[OI] and Lire clearly suggests that depends on . In particular, the root of the larger scatter in the L[OI] vs. L∗ correlation lies in the huge increase in W[OI] by over two orders of magnitude with increasing K-L. This creates a separation between the 3 groups at a given L∗, in the sense: L[OI] (Group II) L[OI] (Group I) L[OI] (Group III). Conversely, the much smaller difference in tightness between LHα vs. Lire and LHα vs. L∗ is a direct consequence of the much smaller span in W(H) between the 3 groups, compared with W[OI].
3.3 Millimeter measurements
A total of 16 Herbig Ae/Be stars with [OI] measurements were observed with the CSO in 1992. Two of the stars, LkH 257 and LkH 259, lacked complete optical and near-infrared photometric data and are therefore not in Tables 2 and 3. Henning et al. (1994) made millimeter observations of an additional 2 stars for which we have [OI] data. Table 5 gives the combined sample of 18 stars, with the relevant continuum flux at either 1.1 mm or 1.3 mm depending on the observations. By assuming that any mm emission is optically thin, it is possible to estimate an upper limit for the mass of the circumstellar material, , (see, for example, Mannings 1994).
| (1) |
Here is the flux density at wavelength , the distance to the source, the Planck function and is the mass absorption coefficient. is taken to be a power law characterized by . The value of is assumed to 0.1 at mm, as used by Mannings (1994), Beckwith et al. (1990) and Beckwith & Sargent (1991). Following Mannings (1994) we take the value of 222Note however that Pollack et al. (1994) suggest that over the millimeter range. Combined with their values for , the resulting would be a factor of approximately 2 smaller, resulting in somewhat larger estimates of the circumstellar masses. The calculated masses may need to be revised upward should the work of Pollack et al. (1994) prove more accurate. The masses quoted in Table 5 assume a gas to dust ratio of 100:1 (this factor is contained in the normalization of ) and are thus total gas+dust masses. A dust temperature of 37 K was assumed in all cases (Mannings 1994). These mass estimates are subject to some variation due to the differing beam sizes used in the different observations. Henning et al. (1994) used a 23′′ beam, as opposed to the 30′′ CSO beam. The difference in beam size will result in varying amounts of background contamination in the flux measurements and consequently overestimates of the target’s circumstellar mass. This effect is most pronounced for the most distant stars where the region sampled is much larger than that for the nearer stars. For example, V645 Cyg is calculated as having a circumstellar mass of nearly 90M⊙, which is clearly an overestimate. To compensate for this we assumed a 1/r2 density law for the dust and corrected the 1.1mm emission from V645 Cyg to the average distance of the rest of the sample. Note that even with this compensating factor the circumstellar mass of V645 Cyg is still anomalously high. At the distance of V645 Cyg (3.5 kpc) the 30′′ beam encompasses nearly a 0.5 pc diameter. There may be multiple sources in this region (see Corcoran & Ray 1997b), each of which might contribute to the 1.3 mm flux. Table 5 shows the two values for the V645 Cyg circumstellar mass. The masses listed in Table 5 are best treated as very rough estimates only although we note that for the many stars we have in common, our mass estimates agree with those of Mannings (1994). There are several reasons why we should treat the quoted values with suspicion: firstly as we have already stated opacity values at millimeter wavelengths are at least uncertain by a factor of 10 and besides they may vary from place to place (Men’shchikov and Henning 1997). Moreover assuming the dust distribution around a young stellar object (YSO) is isothermal is clearly artificial, one should use much more sophisticated models (Di Francesco et al. 1997).
| Star | SpTy | Distance (pc) | (Jy) | Mcs () |
|---|---|---|---|---|
| LkH 198 | A5 | 600 | 0.19 | 0.21 |
| V376 Cas | F0 | 600 | 0.07 | 0.08 |
| Elias 1 | A6 | 160 | 0.30 | 0.02 |
| AB Aur | A0 | 160 | 0.13 | 0.01 |
| MWC 137 | B0 | 1300 | 0.08 | 0.41 |
| LkH 215 | B5 | 800 | 0.05 | 0.10 |
| R Mon | B0 | 800 | 0.07 | 0.13 |
| HD 97048∗ | B9 | 140 | 0.45∗ | 0.04 |
| KK Oph∗ | A6 | 400 | 0.52∗ | 0.40 |
| HD 163296 | A0 | 160 | 1.21 | 0.09 |
| MWC 297 | O9 | 450 | 0.69 | 0.42 |
| BD+40∘ 4124 | B2 | 1000 | 0.50 | 0.15 |
| MWC 1080 | B0 | 1000 | 0.21 | 0.63 |
| PV Cep | A5 | 500 | 0.59 | 0.44 |
| Z CMa | F5 | 1150 | 0.45 | 1.79 |
| V645 Cyg | A0 | 3500 | 2.25 | 15.8/83.0 |
| LkH 257 | B5 | 900 | 0.16 | 0.40 |
| LkH 259 | A9 | 850 | 0.13 | 0.02 |

Figs. 6a and b show plots of the observed [OI] luminosity and Lire against derived circumstellar mass. Although the sample is relatively small, there appears to be a weak correlation between L[OI] and Mcs and Lire and Mcs. We will consider the possible origin of this correlation in our Discussion.
4 Discussion
4.1 Dust colours
The three groups of HAEBES, as defined by the shape of the spectral energy distributions (SEDs) (Hillenbrand et al. 1992) fall into distinct regions in the W([OI]), W(H) vs. H-K, K-L plots. The correlation observed between the relative strength of the forbidden emission and the near-IR colours for Groups I and II indicate a possible relationship between the relative strength of the wind and the temperature gradient in the circumstellar material, with the equivalent width of [OI]6300 in Group I varying by over 2.5 orders of magnitude with increasing K-L. This cannot be easily understood in terms of purely stellar processes, and points to some influence of circumstellar environment on the formation of the line. A plausible explanation for this behaviour, as we shall now demonstrate, is the presence of an optically thick disk (or a combination of disk plus halo) around Group I and II stars.
The expected near-IR colours from an optically thick, passive reprocessing disk or flat accretion disk (Bertout et al. 1988) can be calculated simply from the assumption of a relationship between the flux density and wavelength:
| (2) |
where is the spectral irradiance in erg Å-1 for an object of magnitude in the filter. Here = 1.65m and = 2.2m are the central wavelengths of the H and K filters respectively. Using the zero magnitude irradiance figures provided in Zombeck (1990), one finds a value of mH - mK = 0.4, or in commonly used notation, H-K = 0.4. Similar calculations for K-L yield a value of 0.82. For most of the Group I stars, and all of the Group II stars, the values of H-K, K-L exceed those possible from a flat reprocessing disk and three obvious explanations are possible. Firstly the disk could be flared in some manner increasing the amount of intercepted flux (see, for example, Kenyon & Hartmann 1987) and flattening or raising the 1.65–3.6 m portion of the SED. Flaring of the disk seems to us to be an unlikely explanation because of geometry: even in a very flared disk, the inner portion (r 10 AU; 1–10 m) should remain relatively flat in comparison to the outer disk which can intercept significantly more stellar photons. Another possibility is the presence of an unresolved IR companion that distorts the true near-infrared SED of the star. While this might be important in a small number of cases, recent searches in the infrared for HAEBES binaries (e.g., Leinert et al. 1997; Pirzkal et al. 1997) show that any companions are usually faint in comparison to the HAEBES and so cannot explain their infrared excesses. The final possibility is that the increased reddening is due to a dusty halo which scatters starlight back onto the disk and heats it at large radii (Natta 1993; Mannings 1994; Di Francesco et al. 1997). If one accepts that YSOs with halos plus disks tend to accrete at higher rates than comparable stars with disks alone, then the halo plus disk model explains not only the findings of Hartigan et al. (1995), who showed a correlation between the infrared colours and veiling in TTS but, by extension, our result that the relative strength of the forbidden line emission is correlated with infrared colour in HAEBES in the same way.
Looking at Figs. 1a and c, there are, however, a small number of stars (approximately half a dozen) that do not fit the general trend, i.e. they have very red colours but no detected forbidden line emission. Almost exclusively, they are Group I stars. In some cases, we may not be dealing with a bona fide HAEBES. For example, HD 163296 (MWC 275) is not in a star forming region, it does not appear to be associated with any reflection nebulosity, and its spectral characteristics are inconsistent with it being a HAEBES (Thé et al. 1985). Di Francesco et al. (1997) question whether MWC 137, originally miss-classified as a planetary nebula, is, in fact, a pre-main-sequence star. In some cases variability of the forbidden line emission may be the reason why it was not detected by us. For example, although we did not observe [OI]6300 emission from LkH 218, Böhm and Catala (1994) did at 3 times our detection level. Variability in forbidden line emission strength, by factors of 200–300% has also been found in a number of other HAEBES (Böhm and Catala 1994; Corcoran and Ray 1997a). Irrespective of their infrared colours, Fig. 2b shows that the Group I stars with no observed forbidden line emission, are also weak H emitters. This may imply a link between the current accretion and outflow rates: Hartmann et al. (1994) have shown that for TTS the bulk of the H line emission comes from infalling, magnetospheric material and is not formed in the wind. Thus the H equivalent width, as we mentioned in the Introduction, is probably better regarded as a signature of accretion than of wind strength. This begs the question, could some of the Group I stars without detected [OI] emission be undergoing episodes of reduced accretion activity? If this is the case then their near-infrared colours could be due to the presence of a optically thick reprocessing disk which would give H-K 0.5.
Finally we remark in connection with the other group for which we did not detect forbidden line emission, i.e. the Hillenbrand Group 3 stars, that a significant fraction may also not be genuine HAEBES. For example HD 37490 (Omega Orionis) and HD 76534 are almost certainly classical Be stars (Adelman 1992; Oudmaijer and Drew 1997). Similarly BD +41 3731 was also rejected as a member of the HAEBES class (Thé et al. 1994) consistent with our observation of H in absorption in this star.
In summary, the relationship between the [OI] and H equivalent widths with near-IR colours appears identical to that found for the TTS. It suggests, as with the TTS, that while some HAEBES are surrounded by disks, others have a spectral energy distribution that derives from a combination of a disk plus a halo. In a number of cases, the Group III stars, either no disks are present or at best they are optically thin, and it is precisely these stars that show very little sign of accretion and outflow activity. In contrast, their much redder counterparts, the Group II stars show strong H and [OI] emission.
4.2 Luminosity relationships
Figs. 3a and 3b show good correlations between L[OI], LHα and the infrared excess, Lire. As with the TTS, this suggests a link between and in the HAEBES. When combined with the results from Cabrit et al. (1990), in Fig. 5, the correlation between wind and accretion, in the form of the L[OI] vs. Lire plot, spans 5 orders of magnitude in Lire. It is difficult to imagine a purely stellar physical process that could produce such a correlation especially when one considers that the sub-photospheric, photospheric and chromospheric conditions that occur in TTS are thought to be very different in HAEBES (for example, Catala 1989; Palla & Stahler 1993). It is particularly interesting that the L[OI] vs. Lire plot (as well as the LHα vs. Lire plot which is not reproduced here) smoothly connects the two stellar groups. This clearly suggests that disk plus halo models, which have met with much success in explaining many of the characteristics of CTTS, must be appropriate in a “scaled-up” version to their somewhat more massive counterparts.
Other researchers’ investigations of possible relationships between and have produced similar results. Hamann & Persson (1992) used the strongest line of the calcium IR triplet, CaII8542, as a measure of in both TTS and HAEBES and compared it with the infrared excess calculated over a wavelength range 1 – 25m, using ground based photometry and IRAS data. The CaII8542 luminosities scale with the infrared excess in the same manner as the emission line data presented here. Hillenbrand et al. (1992) showed a correlation between LHα and for both TTS and HAEBES and found a result similar to Fig. 5. Hillenbrand et al. (1992) used the monochromatic IR excess at 3.5m, taking into account the passive reprocessing of starlight by the disk material, as a measure of . As pointed out earlier on, however, current models would imply that LHα is not a measure of wind strength and that any calculations of mass loss rates based on the flux of the hydrogen lines, both optical and infrared, are “meaningless” (Calvet 1997). This criticism would also apply to the work of Nisini et al. (1995) who claimed to have directly measure in HAEBE stars using infrared HI recombination lines (Pa, Br, Br and Pf). Moreover Nisini et al. (1995) suggested that TTS have higher (based on TTS data from Giovanardi et al. 1991) than one would expect from extrapolating the vs. Lbol relationship of the HAEBES to lower luminosities. Here Lbol is the bolometric luminosity of the source and thus includes not only the stellar but the disk and any halo component as well. Putting aside, for the moment, the claim by Calvet (1997) and others that the hydrogen emission lines in any event do not arise in the wind, the suggestion that TTS are somehow more “efficient” at losing mass than HAEBES is difficult to reconcile with our findings: we see a smooth transition in the relationship between wind strength and accretion across the TTS/HAEBES boundary (see Fig. 5). Moreover we also find a smooth relationship, between H line strength and infrared excess. It appears, however, that the TTS mass-loss rates calculated by Giovanardi et al. (1991) are in any event highly unreliable (Natta, private communication). In fact many of the TTS listed by Giovanardi et al. (1991) also had their mass loss rates estimated by Hartigan et al. (1995). These authors found values typically 10 times lower than Giovanardi et al. (1991), implying the “efficiency” of mass loss is not higher amongst TTS than HAEBES and implying a much smoother transition in vs. Lbol than found by Nisini et al. (1995; ibid Fig. 4). It is also worth remarking that a direct comparison of the Lire and L∗ values in Nisini et al. (1995) and ours reveals some distinct differences. It appears, however, that the calculated values of L∗ in Nisini et al. (1995) did not take account of the appropriate bolometric correction to Mv.
As can be seen from Figs. 4 & 5, there is a tendency for L[OI], LHα, and Lire to scale with the stellar luminosity, L∗. In particular Fig. 4a shows that there is a good correlation between Lire and L∗ and it is this relationship which, to some degree, masks whether L[OI] and LHα depend fundamentally on Lire or L∗. The form of the dependence is critical to understanding the origin of the forbidden line emission in HAEBES: Catala (1989) proposed a chromospheric origin for the winds from HAEBES that superficially might be in keeping with the dependence of L[OI], for example, on L∗. According to that paradigm, the observed correlations with Lire would then be coincidental and due to the tendency for the total amount of circumstellar dust to scale with L∗. Such an explanation, however, does not explain the tighter correlation we observe between L[OI] and Lire than between L[OI] and L∗. Moreover, a chromospheric model seems incapable of explaining why a number of HAEBES show infrared excess luminosities that are much greater than the underlying stars’ bolometric luminosities (Hamann & Persson 1992). Accretion must play a fundamental role as it is also impossible to imagine how such a situation can arise in a purely passive reprocessing disk or envelope. In fact, it may even be argued that the “reprocessing fraction”, particularly for the earliest stars, is lower amongst HAEBES than TTS due to dust clearing (Hillenbrand et al. 1992; Hamann & Persson 1992).
A final point should be made in connection with the apparent dependence of wind properties on L∗ amongst HAEBES. In the case of the TTS, Cabrit et al. (1990) found a poor correlation of L[OI] and LHα with TTS photospheric luminosity in contrast to what is found for the HAEBES. The probable explanation for this effect is that in the TTS sample one is dealing with a large number of stars within a rather narrow luminosity (and mass) range. The sample of Cabrit et al. (1990) ranges in spectral type from M1 to G2 or a mass range of roughly 0.4 – 1 M⊙. The scatter in such a sample of Lire, for a given narrow range in L∗, is then large enough that the stronger dependence on Lire of L[OI], for example, is readily seen.
It is interesting to compare the frequency of the occurrence of molecular (CO) outflows with the near-infrared colour, or effectively as one can see from Fig. 1, with Hillenbrand group. While none of our Group III stars are observed to be accompanied by molecular outflows and only 2 out of our 21 Group I stars are, 6 out of our 9 Group II stars are found to be associated with molecular outflows. Note that we used the molecular outflow database of Fukui et al. (1993) to check for associations. There thus appears to be a direct link between degree of embeddedness of the star and the presence or absence of large scale outflow phenomena. The Group II stars’ association with molecular outflows, and in some cases optical jets (Mundt & Ray 1994), may be due to their relatively early evolutionary state, as they disperse the dusty cocoons from which they formed. Strom et al. (1993) have suggested that the cessation of the outflow phase in TTS is intimately linked to the circumstellar disk surrounding the star becoming optically thin. The Group III HAEBES may possess optically thin circumstellar material and colder dust at large radii, a remnant of an earlier phase, responsible for the longer wavelength IR excesses observed in such stars.
4.3 Correlations with the circumstellar mass
In Fig. 6a we showed a plot of the luminosity of the [OI]6300 line against the calculated circumstellar mass. There is a clear correlation between the two quantities as is also the case for the infrared excess (Lire) and the circumstellar mass (see Fig. 6b and also Table 4). Obviously to an extent such correlations reflect the fact that the circumstellar mass tends to scale with the stellar luminosity L∗ and, given that L[OI] and Lire depend on L∗, are to be expected. Nevertheless, Table 4 shows that the correlations of L[OI] and Lire with Mcs are stronger than with L∗ suggesting some dependence of these quantities on Mcs alone.
The origin of the mm emission in HAEBES is not clear and this is partly due to the poor resolution of single dish mm measurements such as those reported here. As was stated in the Introduction, the SEDs of HAEBES have variously been modeled by extended dusty envelopes without disks (Berrilli et al. 1992; Di Francesco et al. 1994; Miroshnichenko et al. 1997) as well as by disk plus envelope combinations (Hillenbrand et al. 1992; Natta 1993). In order to determine whether there is a disk contribution to the millimeter emission, higher resolution mm-array observations are needed. To date, however, these have produced conflicting results (e.g., Di Francesco et al. 1997; Mannings & Sargent 1997) In any event it is clear that if a major fraction of the circumstellar material inferred from our mm observations is confined to scales of typically a few arcseconds then, given its mass (see Table 5), one would expect much higher visual extinctions towards these sources than observed where the material to be distributed spherically. We emphasize, however, that even if disks are present, as we believe they are, this does not exclude the possibility that some of the mm emission almost certainly arises from an extended dusty halo (Di Francesco et al. 1994).
The correlations we observe in Fig. 6 do not tell us anything about the origin of the mm emission. They would be expected in the event that most of the mm emission came from an accretion disk but equally they might be anticipated if the mm emission largely derived from a dusty envelope that in turn fed a disk.
Finally we add a note of caution that, given our beam size, our mm flux measurements may include contributions from unrelated dust, and/or embedded companions, at large distances from the HAEBES. It is interesting to note, however, that our circumstellar mass estimates are close to those derived by Mannings & Sargent (1997), from their much higher resolution observations, in at least the two stars common to both samples (i.e. AB Aur and HD 163296).
5 Conclusions
The work of Cohen et al. (1989), Cabrit et al. (1990), Edwards et al. (1993), Hartigan et al. (1995) and others has demonstrated a strong link between accretion and mass-loss in the case of the CTTS. Using various indicators of , the mass accretion rate, and , the mass-loss rate, they have shown that the mass loss rate scales with the accretion rate and that the mass-loss most likely derives from an accretion-driven disk flow. The motivation for the present, and related (Corcoran & Ray 1997a), work is to test whether the same basic inflow/outflow process occurs amongst the HAEBES. The approach in this paper has been to test whether the same relationships seen in the TTS between indicators of mass loss and mass accretion carry over to their higher mass counterparts. Obviously if clear parallels can be drawn between the two groups this would not only bolster the idea that a common inflow/outflow mechanism operates amongst the TTS and HAEBES but indirectly, that disks, as in the case of CTTS, surround HAEBES (or at least those with substantial infrared/mm excesses). Certainly we expect that the disk paradigm can be extended to some intermediate mass young stars given the presence of dusty disks/rings around main sequence A-type stars like Pic (Burrows et al. 1997). The crucial question is rather how common are disks around HAEBES? The data and analysis we have presented here shows that in the case of the HAEBES:
-
•
Relative strengths of [OI]6300 and H lines, as determined from absolute equivalent widths, typically scale with reddened corrected near-IR colours, H-K and K-L for the Hillenbrand et al. (1992) Group I and II HAEBES. As discussed by Edwards et al. (1993) for the CTTS, these near-IR colours sample the temperature distribution of the inner system dust around the star. As the HAEBES near-IR colours increase above the values expected from a passive reprocessing or geometrically thin accretion disk, it is found that the relative wind strength increases in an exactly analogous manner to the CTTS. Since Hartigan et al. (1995) have shown that, at least in the case of the CTTS, the reddening corrected IR colours correlate well with the degree of veiling and hence indirectly with the relative accretion rate, this strongly suggests that the same basic inflow/outflow process occurs in both CTTS and HAEBES. The idea that relative accretion is related to near-IR colour in HAEBES is further reinforced by the finding that for these stars K-L is correlated with Lire/L∗ where Lire is the infrared excess. Lire, if one ignores the effects of reprocessing, should be a rough measure of accretion.
-
•
There are indications of a small population of Group I stars with no detected [OI]6300 emission and the levels of which are well below that expected on the basis of their near-IR colours. It seems unlikely that their infrared excesses can be explained by the presence of companions and the absence of [OI]6300 emission may simply be due to variability as is certainly true in a number of cases. Another possibility is that their disks are currently quiescent and merely reprocessing starlight.
-
•
All Group II HAEBES have near-IR colours that are much redder than those of a passive reprocessing or geometrically thin accretion disk. As noted by Hillenbrand et al. (1992) their overall spectral energy distribution is best explained in terms of a star+disk+envelope model. These are found to be the the stars with the strongest evidence for accretion. We note that the Group II stars are, proportionately, by far the most likely sources of extended optical jets amongst all HAEBES (Corcoran & Ray 1997a).
-
•
No forbidden line emission was detected from any of our Hillenbrand et al. (1992) Group III stars in keeping with the small values of their near-infrared colours (i.e. close to that expected from a main sequence star of the same spectral type). Moreover the equivalent width of their H emission is 15Å in all cases. We propose that their lack of forbidden line activity and, in particular such an H equivalent width limit, may serve as a useful criteria when searching for members of the Group III HAEBES sub-class. That said, we should warn the reader that the weak-line HAEBES, “WHAEBES”, defined in this way are not exactly identical to the Group III stars as defined by Hillenbrand et al. (1992). The latter are characterised in terms of the near-infrared slope of their SEDs whereas the WHAEBES will also include those Group I/II stars with low line activity (e.g. BF Ori, MWC 137, HD 150193), the status of which is still unclear. While it seems some Group III stars are not pre-main sequence stars, nevertheless it appears likely that a number represent the HAEBES analogues of the weak-line T Tauri stars. Interestingly Group III stars are predominantly early B-type stars. Such stars evolve rapidly and will therefore not have wandered far from their formation sites. On the other hand the Group I and II stars are predominately of later spectral type. This begs the question where are the Group III late-type HAEBES? Such stars should be searched for, perhaps many of them lie well beyond the boundaries of their parent molecular cloud.
-
•
Using the luminosity of the [OI]6300 emission line as an indirect measure of and the IR excess luminosity over 0.7–10.2m as a measure of , a strong correlation is found between accretion and mass-loss. While the [OI]6300 line luminosity also tends to increase with stellar luminosity, as one might expect, the correlation with IR excess luminosity is stronger implying that accretion rate is an important factor in determining the strength of the [OI] emission.
-
•
Plotted to the same axes as our HAEBES data, the L[OI] vs. Lire of the sample of 36 TTS from Cabrit et al. (1990) extends the correlation between the two variables over 5 orders of magnitude in luminosity. The smooth progression from PMS stars of less than a solar mass all the way to B-type stars with masses 10M⊙ or more provides convincing evidence that the origin of the relationship is the same process in both groups of stars. Given the compelling evidence in the case of CTTS that matter is accreted via a disk, one must infer that accretion disks also surround many HAEBES.
-
•
Millimeter continuum observations of HAEBES reveal circumstellar masses typically in the range 0.02–1.0 M⊙, assuming a gas to dust ratio of 100:1 and optically thin emission. It is likely in a number of cases that these masses are somewhat overestimated due to our large beam size (30′′). If a significant proportion of the mm flux comes from a compact region on scales less than a few arcseconds then the masses inferred would imply much higher optical extinction towards these stars than observed unless the dust is not distributed spherically. Recent observations support the idea that the emission is compact (Mannings & Sargent 1997) and this again suggests that disks may be present around many HAEBES. The amount of circumstellar mass, Mcs, present is slightly better correlated with the luminosity of the forbidden line emission than with the photospheric luminosity of the star. Again this indicates that a disk or a disk+halo combination may be fueling HAEBES with forbidden line emission.