11 (11.19.3; 11.3.2; 11.9.5; 11.5.2;11.9.4)
Raymond and Beverly Sackler Faculty of Exact Sciences
Tel Aviv University, Tel Aviv 69978, Israel 22institutetext: Department of Physics, Lafayette College
Easton PA 18042, U.S.A.††thanks: Based on observations by the International Ultraviolet Explorer (IUE) collected at the Villafranca Satellite Tracking Station of the European Space Agency
N. Brosch
VCC 144: a star-bursting dwarf galaxy in the Virgo Cluster
Abstract
We describe results of a multi-spectral study of a blue compact dwarf galaxy in the Virgo Cluster. The object was observed with broad-band and H imaging, ultraviolet observations, and radio synthesis. Our data were combined with previously published optical observations, with HI single-beam observation and with far-infrared data, and were compared to results of evolutionary synthesis programs. The radio synthesis observations revealed a compact concentration of HI coincident with the optical galaxy, embedded in a diffuse, asymmetric HI cloud which has no trace of optical emission. While the overall velocity dispersion and size of the HI structure suggests that the total mass in stars and gas is not sufficient to gravitationally bind the system as a whole, the HI clump coincident with the optical galaxy requires little or no dark matter to be self-gravitating. The diffuse cloud has more complex velocity structure and is extended in a direction approximately perpendicular to the optical major axis.
The optical-UV data can be explained by a single population of stars formed in a recent burst, indicating that this is a genuine young galaxy. The efficiency of star formation is similar to that in large disk galaxies. The IR emission indicates the presence of dust; this must have been formed very recently, or was already present within the original HI cloud from which the galaxy was formed. The round and smooth isophotes, the correspondence of the optical and HI redshifts, and the lack of any suitable nearby galaxy, indicate that the starburst was probably not triggered by an external interaction with a visible galaxy. The distribution of HI fits better a blow-out scenario than an accretion or collision with a companion. We point out features in common with other actively star-forming dwarf galaxies and conclude that, at least in the southern outskirts of the Virgo cluster, intensive star formation, perhaps for the first time in some objects, takes place at present.
keywords:
galaxies: evolution - galaxies: interstellar medium - galaxies: starburst - galaxies: compact - galaxies: irregular1 Introduction
Star formation (SF) is a fundamental process in the evolution of galaxies. But this process is far from being well understood. The SF is usually characterized by the initial mass function (IMF) and the total SF rate (SFR), which depends on many factors such as the density of the interstellar gas, its morphology, its metallicity, etc.
According to Larson (1987), four major factors drive star formation in galaxies: large scale gravitational instabilities, cloud compression by density waves, compression in a rotating galactic disk due to shear forces, and random cloud collisions. In galaxies with previous stellar generations, additional SF triggers exist, such as shock waves from stellar winds and supernova explosions. In dense environments, such as clusters of galaxies and compact groups, tidal interactions and collisions with other galaxies probably play some role in triggering star formation (e.g., the blue compact dwarf and the Im galaxies apparently formed at the ends of the tidal tails of Arp 105: Duc and Mirabel 1994).
While “global”phenomena, such as the first two SF triggers of Larson (1987), play a large part in grand design spirals, random collisions of interstellar clouds may provide the best explanation for dwarf galaxies with bursts of SF. Therefore, understanding SF in dwarf galaxies should be simpler than in other types of galaxies. Understanding this type of objects has also cosmological implications, as some star forming dwarf galaxies may be genuinely young.
One way to derive the star formation history of galaxies is with a combination of credible spectral synthesis models and observations in as many spectral bands as possible, which should provide constraints on the IMF. This approach is usually followed for a sample of galaxies of similar type, in which the star formation parameters would be basically similar. Surface photometry in broad-bands, from which the spectral energy distribution (SED) is derived, together with a tracer of massive stars, such as H or UV measurements, makes it possible to obtain the total ongoing SFR. The H radiation is directly coupled to the radiation at wavelengths 912Å (e.g., Kennicutt 1983), indicating the ongoing star formation. UV radiation longward of the Lyman break, mainly emission detected by space experiments such as IUE and HST, which is longward of Lyman , is produced not only by the most massive stars, but also by cooler stars that do not ionize hydrogen significantly.
Almoznino (1995) studied a sample of BCDs in the Virgo Cluster selected from the Binggeli, Sandage, and Tamman (1985, hereafter BST) catalog, with HI measurements from Hoffman et al. (1987, 1989a). Among the objects in his sample he found one exceptional object, VCC 144, which could be a truly young galaxy. Here we describe our observations of this object, combine them with existing information, compare them with evolutionary population synthesis models, and present our interpretation.
The Virgo cluster contains a very unusual object (HI 1225+01), discovered serendipitously by Giovanelli & Haynes (1989) as an extragalactic HI cloud within the cluster. Subsequently, an optical counterpart was identified (e.g., Djorgovski 1990), was studied by Salzer et al. (1991), and was recently mapped in HI with the VLA (Chengalur et al. 1995). Salzer et al. showed it to be a system which witnessed a burst of star formation 1 Gyr ago, with signs of a recent (10 Myr) second burst. Chengalur et al. (1995) found rotation in the HI distribution and identified the star-forming clump as the only region where the HI surface density exceeds 4.6 1020 atoms cm-2. The system is probably the result of a tidal interaction between two HI components.
A general review of properties of dwarf galaxies was given by Thuan (1992) and a review of spectroscopic properties of star-forming dwarfs was presented by Vílchez (1995). Lately, a number of papers reported extended HI envelopes, or HI companions, of dwarf galaxies (e.g., Taylor et al. 1995; Van Zee et al. 1995; Hoffman et al. 1996; Szomoru et al. 1996a, 1996b). As will be seen below, we detected an extended HI envelope connected with VCC 144. It is possible that this object represents a more intensely star-forming case than HI 1225+01 and that dwarf galaxies with extended HI distributions have other common characteristics. Therefore, we will compare our measurements and derived properties for this Virgo BCD with those of the optical counterparts of the dwarf galaxies with extended HI and with HI 1225+01.
2 Observations
Below we first review published observations of VCC 144 and describe our own observations together with additional data collected from the literature or data banks. We adopt here a uniform distance of 18 Mpc to the Virgo cluster, and by inference to all its members, including VCC 144. A smaller cluster distance, Mpc, is suggested by the [OIII] distances to planetary nebulae (Jacoby et al. 1990), but Visvanathan & Griersmith (1979) give 17.9 Mpc, in agreement with Sandage & Tammann (1974). We note other values for the distance to the Virgo cluster, in particular 16.8 Mpc (Tully 1988) and the estimate of the distance to M100 from observations of Cepheids (17.1 Mpc: Freedman et al. 1995), while considering the depth of the cluster to be some 3-4 Mpc. Note that VCC 144 could be located in the W cloud (Hoffman et al. 1989b). If this is the case, its distance could be 1.7 to 2 times greater than adopted here.
2.1 Optical and UV observations
BST identified VCC 144 [optical peak at (J2000)=12h 15m 18s.35, (J2000)=+05∘45’ 39”.2], a BCD galaxy, as a member of the Virgo cluster, despite it being just outside the borders of the W cloud. Note that the coordinates given in BST are off the peak of the optical image by =–0s.65 and =4”.7. de Vaucouleurs et al. (1991) quote for this galaxy an optical heliocentric velocity v⊙=196052 km s-1. Gallagher & Hunter (1986) reported on single-aperture photoelectric photometry of this object, along with 64 other similar objects. They measured within a 19” aperture V=14.870.03, (B–V)=0.380.03, and (U–B)=–0.510.03.
Gallagher & Hunter (1989, GH89) surveyed spectroscopically BCDs in the Virgo Cluster. For VCC 144 they measured an H equivalent width EW[H]=35Å. The low resolution (15Å ) spectrum with the IRS on the KPNO 0.9 m telescope, shown as their Fig. 2, exhibits a blue-sloping continuum with strong and narrow emission lines. These are (in order of strength) [OIII] 5007, [OII] 3727, [OIII] 4959, H, H, H (very weak), and a blend longward of [OII], that can be mostly HeI 3888Å or an incomplete sky subtraction. The region between H and H is free of the HeII 4686Å and NIII 4641Å high excitation lines. GH89 correct upward the H line by 10% to account for underlying absorption (which is not evident in their spectrum), and obtain a line flux of 1.14 10-13 erg cm-2 s-1, with ratios of other lines to H: [OII] 3727=3.16, [OIII] 4959=1.03, and [OIII] 5007=3.68. To these we add, by measuring from their Fig. 2: [OIII] 4363Å 0.07, H0.4, H0.1, He I 3888Å 0.3 (if real).
VCC 144 was observed with the CCD camera of the Wise Observatory (WiseObs) on April 11, 1991. The galaxy was imaged through standard B, V, R and I filters. In total, we collected three B images each of 10 minute exposure, three 200 sec V-band images, and four 120 sec exposures for R and for I with the RCA-CCD. This is a thinned, back-illuminated chip, with 512320 pixels. Each pixel subtends 0”.87 at the f/7 focus of the 1m WiseObs reflector. A reference star close enough to appear on the galaxy’s CCD frame was imaged together with the galaxy. This star was calibrated against Landolt standards (Landolt 1973, 1992) with photoelectric photometry at the WiseObs using a 30” round aperture. The galaxy is shown as the combined B-band frame, underlying the contours in Fig. 4.
The galaxy was also imaged through narrow-band filters, to derive the H emission. Two filters were used: one containing the H line at the redshift of the object and the other sampling the continuum at ). Three 20 min exposures were obtained through each of the two filters. In addition, the HZ44 spectrophotometric standard star was measured several times each night through different air masses with the same filters, in order to derive the atmospheric extinction and the absolute photometric calibration for the H images.
EA observed VCC 144 with IUE in 19 Jan 93 for a full VILSPA observing shift with 6 hours of integration. The spectrum was obtained through the IUE large aperture with the short wavelength primary camera in low dispersion setup. VCC 144 is a very compact object, and the radiation comes almost entirely from its central 10”, thus IUE collected essentially all of its UV flux. The IUE spectrum (SWP 46761) was very weak after its extraction. We measured two regions 100Å wide and averaged the flux densities within each to obtain two UV photometric indices at 1350Å and at 1850Å . The monochromatic magnitudes in these two bands are [1350]=13.500.16 and [1850]=14.100.22 and the respective flux densities are 1.350.20 10-14 and 0.780.16 10-14 erg s-1 cm-2 Å -1.
2.2 IRAS and radio data
VCC 144 is not listed in the IRAS point source catalog. The IRAS data consist of flux densities in four infra-red (IR) bands centered at 12, 25, 60 and 100. IRAS scanned most of the celestial sphere several times, and it is possible to co-add the various IRAS scans for a given location to obtain a deeper detection or upper limit at this location in the sky. The IRAS Faint Source Catalog lists a source very close to the position of VCC 144 with the following flux densities: [12]=0.1500.023 Jy, [25]=0.3120.047 Jy, [60]=0.6220.093 Jy, and [100]=0.6570.099 Jy. We adopt this as the FIR emission from the galaxy.
As mentioned above, our sample is based on the HI measurements of Hoffman et al. (1987) and Hoffman et al. (1989) with the Arecibo radio telescope. They list for VCC 144 a flux integral of 230519 mJy km s-1 and a 135 km s-1 HI line width at 20% of the peak. The profile is triangular-shaped, asymmetric, and shows no sign of a two-horn profile expected for a flat rotation curve. While a solid-body rotation curve can give rise to a triangular profile (Skillman 1996), it is unusual to find evidence of significant rotation in dwarf galaxies which exhibit triangular central beam profiles as narrow as this one (Hoffman et al. 1996). The widths at 50% and 80% of the peak intensity are 82 and 44 km s-1. The heliocentric velocity from the HI measurement, adopted by Hoffman et al. (1989) as the mid-point of the HI profile edges at 50% peak intensity, is 2014 km s-1. Within the measuring accuracy, the optical and HI redshifts coincide.
VCC 144 was observed in HI and radio continuum at the Very Large Array (VLA) 111The Very Large Array is part of the National Radio Astronomy Observatory which is operated by Associated Universities, Inc., under cooperative agreement with the U.S. National Science Foundation.. Observations in the L band continuum and HI line were conducted for 15 and 82 minutes on-source, respectively, on 12 and 16 April 1988 in the C array; C band continuum observations were made for 52 minutes on-source on 10 September 1988 in the D array. The same pointing center (1950), , was used throughout. The spectral line observations used 32 channels with channel spacing of 10.45 km centered on heliocentric velocity 2014 km . Continuum observations were conducted with 50 MHz bandpasses at 6 and 20 cm. Calibration was performed using sources from the VLA calibrator list in the usual way, with map-making and deconvolution performed using the standard routine IMAGR within the NRAO AIPS software package. For the HI data, the continuum was subtracted in the domain, and zero-spacing fluxes were interpolated for each channel from the Arecibo spectrum. The rms noise achieved after CLEANing was 0.21 mJy/beam for the L band continuum data, 0.053 mJy/beam for the C band data, and 2.0 mJy/beam in each channel for the HI line data.
3 Results
We measured for VCC 144 the following integrated photometric properties: V=14.830.03, (B–V)=0.460.03, (V–R)=0.220.02, and (R–I)=0.230.02. The photometry was performed through a polygonal aperture, which traced the “limits” of the galaxy as estimated visually on the deepest (V-band) image. This corresponds to a surface brightness of 25.5 mag/square arcsec. This rather shallow limit is the result of the low exposure collected for VCC 144, which is one of the brightest galaxies in our sample.
Although the V magnitude we measure reproduces that by GH86, there is a possible discrepancy in the B band, as the color (B–V) is marginally redder (2) than what they measured. The difference could be related to a radial color gradient in the galaxy, as GH86 measured only the innermost 19” while we include an additional 10” external region. However, a test of the image profiles in the B, V, and R bands (Fig. 1, below) shows that they are identical, thus VCC 144 is not redder in its outer regions. With the measured photometry, and an adopted distance of 18 Mpc to the Virgo cluster, VCC 144 appears to be a low luminosity dwarf galaxy (M–16.4). If in Cloud W, as mentioned above and further away, M–17.6 mag, it would still be a dwarf galaxy, although on the brighter side.
7cm

The H frames were combined and the final image was shifted to match the broad-band images, and the galaxy was measured inside the same polygonal area used for its broad-band image. The method of measurement was basically the same as for the broad-band frames, with the exception that the sky background level was computed several times using different ’boxes’ around the objects (see Almoznino et al. 1993). The mean of these results was adopted as the object counts, while the error was taken as the largest of the errors of each measurement. The standard deviation of the results was smaller than this. The integrated H flux was measured to be 7.050.76 10-13 erg s-1 cm-2. The average line equivalent width, obtained by dividing the net line image by the off-line continuum image, is 15922Å , with a peak value of 390Å . The intense H emission implies that 13% of the R band photons originate from this line and from [NII] emission. We have not corrected the magnitudes and colors for line emission, either for H+[NII] in R, for [OIII] in V, or for [OII] in U. The contribution of line emission is strongest in the R band; the other lines have smaller equivalent width and are located near the edges of bands.
We smoothed all final images, combined from different images through the same filter, with a gaussian of full width at half-maximum of 4 pixels=3”.5, which corresponds to the typical seeing in our images. We then obtained an intensity profile for each image, by fitting ellipses to the isophotes. The intensity profiles for the B, V, R, and I bands, as well as that for the net-H image, were scaled to the same peak intensity (of the B image), and the widths of the profiles were compared. We found that all five images had virtually identical profiles, to within 5% of the peak intensity at 12 pixels11” galactocentric distance. The intensity profiles are plotted in Fig. 1. The images are all resolved, with very similar eccentricities of 0.6 in all colors. The surface brightness is high with an average value of =20.5 mag/”. Note that because of the smoothing, there are only very few “independent” points, thus fitting the light distribution to any of the usual profiles seems pointless.
The high surface brightness, the strong H emission, and the compact and blue appearance of the galaxy point to an interpretation favoring a strong burst of star formation taking place at present in VCC 144. We did not find any faint extensions or disturbances in our images; thus the triggering of star formation in VCC 144 cannot be attributed to a recent interaction with another visible galaxy.
Both VLA continuum images (Figs. 2 and 3) show a single Gaussian feature centered on the optical image of the galaxy. At 20 cm, the feature has a size after deconvolution with the beam. The peak intensity of a fitted Gaussian is mJy/beam and the integrated intensity over the feature is mJy. At 6 cm the galaxy is still only marginally resolved (the other features on the map are all well outside the optical and HI boundaries, and are almost certainly unrelated to VCC 144), with a size about after deconvolution with the beam, a Gaussian peak at mJy/beam and an integrated intensity of 1.780.19 mJy. This gives a global spectral index of 0.230.25 if the integrated intensities are used, or 0.130.15 if the peak intensities are used instead.
8 cm

8 cm

The 21 cm line data were processed at full resolution (16”) and at 45”, to bring out extended features at lower column densities. The maps at full and at reduced resolution are presented below and are discussed in detail.
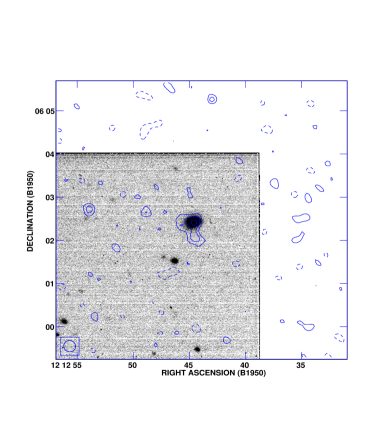
The total HI map at 16” resolution was computed by integrating over the emission-bearing channels with no blanking applied. The resulting contour map, overlaid on a grey scale version of the B-band image, is shown in Fig. 4 and reveals one concentration of about coincident in position with the optical image, with hints of more diffuse emission extending perhaps one beam width to the southwest, and about 1.5 arcmin to the northeast.
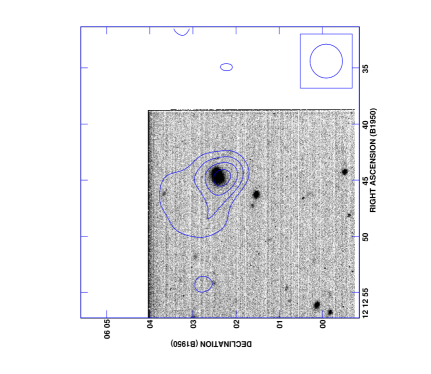
To confirm that the extension is real, we convolved the map with a Gaussian to smooth it to a resolution of 45 arcsec. The result is shown in Fig. 5, and the NE extension stands out clearly. In fact, the two figures show that the HI distribution extends on both sides of the minor axis of the galaxy.
Integrating over the entire HI distribution gives a total mass of , about 50% larger than the flux estimated from the single-beam spectrum obtained with the Arecibo telescope, which partially resolves the HI cloud. Our images and inspection of the Palomar Sky Survey copies show no optical counterpart within the NE extension to a surface brightness limit of 24 mag/square arcsec. The HI linear extent is about 11.5 kpc. All masses are appropriate to a distance of 18 Mpc as assumed throughout, and would be larger by a factor of if VCC 144 were at the W cloud distance.
8 cm
8 cm
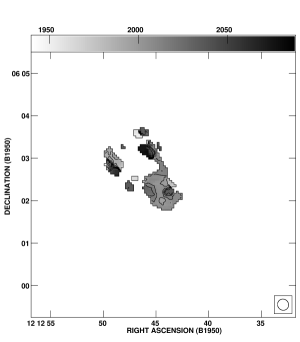
To obtain isovelocity contours at 16” resolution it was necessary to blank the cube in two stages: first everything outside the lowest contour on the smoothed total HI map (Fig. 5), presumably unrelated to VCC 144, was blanked. Then only features in each channel that exceeded 2 mJy/beam were retained for computation of the first moment map, shown in Fig. 6.
8 cm
8 cm
9 cm

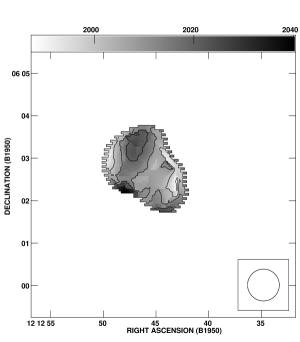
A 45” resolution first moment map was also produced, retaining only features in each channel of the spatially smoothed cube that exceeded 5 mJy/beam. Everything outside the lowest contour on the smoothed total HI map was then blanked from the smoothed first moment map, which is shown in Fig. 7.
8 cm

Inspection of the isovelocity contours in Figs. 6 and 7, and the individual channel maps shown in Figs. 8 and 9 as mosaics, leads us to the following interpretation: the dominant clump, centered on the optical image, has a mean velocity around 2010 km with a roughly Gaussian velocity profile of width about 80 km . The NE extension lies generally at higher velocity, but has a more complex velocity profile with prominent narrow features at about 2070, 2040 and 1980 km . This suggests some bulk motion of the diffuse gas with respect to the main concentration, but we cannot say conclusively from these observations whether that motion is more properly described as infall, ejection, or rotational motion. Other considerations, to be discussed below, lead us to favor a gas blow-out. We do not have adequate signal nor spatial resolution to determine whether the main concentration rotates about its own axis, or has purely turbulent internal motions. In any case, turbulent motions appear to be at least as significant as ordered motions in the dynamics of the clump and of the system as a whole.
4 Discussion
4.1 Total mass and masses of non-stellar components
We estimate here a representative total dynamical mass for the system, and masses of its different components (stars, gas, and dust). Dwarf irregular galaxies often show little rotation and their dynamics are dominated by turbulent motions (e.g., Sargent et al. 1983). It is possible to estimate an indicative gravitational mass MG for the galaxy using the half-width at half-intensity of the single beam 21 cm profile :
| (1) |
For a typical HI maximal extent from the center of the HI distribution of R=4 kpc the gravitational mass is MG=1.56 109 M⊙.
The total B magnitude measured by us, with the adopted distance to the galaxy, yields a total blue luminosity of 3.6 108 L⊙, making the indicative mass-to-blue light ratio MG/L4.2. This is somewhat higher than M/L values of blue star-forming galaxies. Note though that if we are witnessing a collision between two clouds, and if the relative velocities of the clouds are approximately perpendicular to our line of sight, there is no requirement for the gas to be bound to the system. In this case we might be seeing a tidal disruption taking place, or the blow-out of gas from a system experiencing strong star formation.
The indicative dynamical mass of the dominant clump, assuming a profile half-width of 40 km s-1 and a radius of 1.6 kpc, is 5.7 108 M⊙. For the densest part of the NE extension (visible as a distinct clump in the 16” resolution total HI map), taking “profile half-width” to be half the difference between the velocities of the two narrow peaks and a similar radius, we get 3.6 108 M⊙.
We calculated the HI content of VCC 144 from the HI flux density integrated over the entire map, following the prescription in de Vaucouleurs et al. (1991). The flux integral value from Hoffman et al. (1989a) yields a total HI mass of 1.80.4 108 M⊙, and the total integrated flux from the VLA map yields 2.7 108 M⊙ with similar uncertainty. The VLA map of the dominant clump, which coincides with the optical image, contains 1.2 108 M⊙ of HI. The HI mass is thus comparable with the stellar mass, as derived from the blue luminosity for a M/L1 assumption, but is only 20% of the indicative dynamical mass.
The location of VCC 144 in a FIR color-color diagram, such as that by Helou (1986), coincides with that of starburst, BCD, and extragalactic HII region galaxies, and the exact location of the point indicates that most FIR emission is produced by the current star formation, i.e., there is no significant “cirrus” cloud contribution. The total dust content can be estimated from the relations of Thronson et al. (1988), Bothun et al. (1989), or Thuan & Sauvage (1992). The harmonic mean of the three values yields Md=9.3 103 M⊙ as representative total dust mass and the dust-to-gas mass ratio is 3.4 10-5 if the dust is distributed within the entire HI entity or 7.8 10-5 if it is relegated to the optical galaxy and its HI cloud. Some 104 massive stars must have existed prior to the present star formation burst to have produced this amount of dust, or the dust could be pre-stellar in this galaxy.
7 cm

It is useful to consider the entire SED of the galaxy, displayed in Fig. 10. The points originate mainly from our WiseObs broad-band photometry and from measurements with the IUE. In order to derive the total U magnitude we assumed that the (U–B) color measured by GH86 for the inner 19” is representative for the entire galaxy. The SED shows a steep decline with increasing wavelength, both in the UV and in the optical. Since our derived SED is very sparse because of having only broad-band colors, it cannot be tested against detailed spectra, but can be compared, in general, to various typical SEDs of different stellar populations. A comparison with the experimentally-derived spectral templates of Kinney et al. (1996) in Fig. 10 shows a good fit to the “negligible extinction” [E(B–V)0.10] template of a starburst (their Fig. 2g). Thus, from the SED alone, we could conclude that VCC 144 is an unextinguished, star-bursting galaxy.
The “recent” star formation rate may be estimated from the blue luminosity (Gallagher et al. 1984, GHT) as:
| (2) |
averaged over the past 0.4–6 Gyrs. The assumption in GHT is that the SFR is constant over the lifetime of the galaxy and the IMF is a Salpeter law with an upper mass cutoff of 100 M⊙. A recent starburst would have correspondingly more blue and luminous stars, lowering the SFR resulting from the same LB.
The galaxy shows the most intense H emission among objects in our sample. The line has very high equivalent width, peaking at 390Å . The entire 1 kpc optical galaxy is a huge HII region. The line radiation comes from the entire galaxy and, as mentioned above, no optical extension to the galaxy is visible beyond the line emitting region even in the broad-band images. This intense H emission indicates a high SFR at present. The lower limit on the [OIII] line ratio from the Gallagher & Hunter (1989) spectrum indicates an electron temperature K.
The present star formation rate is estimated from the H, again using a relation from GHT:
| (3) |
This requires correcting the H emission for extinction. Adopting our H flux and comparing it with the H from GH89, we find H/H=6.18, apparently indicating a significant amount of extinction for Case B recombination theory. The comparison is valid, although our H measurement is global while that of GH89 was taken through a 22” aperture, because the H image of VCC 144’s is pixels22” wide, but is elongated. GH89 estimate E(B–V)0.0 from H/H. The H/H inconsistency, produced by two different observations, may result if GH89 missed part of the total H flux in their round aperture. We conclude that the extinction for VCC 144 is probably “negligible”, as indicated by the reasonable fit to the Kinney et al. (1996) SED. This yields SFRHα=0.29 M⊙/yr, assuming no extinction of the H line.
The discrepancy between SFRB and SFRHα found above may result from an incompatibility of the model. A similar result was found for an irregular galaxy by Thronson et al. (1988). As will be shown below, our preferred interpretation of VCC 144 is of a recent and first star formation burst. Therefore, the GHT method of deriving SFRB will not be correct. A comparison with the spectral energy distribution of different young starbursts may be more adequate. The lack of HeII and typical WR emission signatures indicates that high mass stars (M40M⊙) are missing from the present population mix, while GHT assumed an upper mass cutoff of 100 M⊙; only if the SF burst happened instantaneously a few 106 yrs ago, the most massive stars and their WR remnants could be absent now, which would explain the discrepancy between SFRB and SFRHα. Another hint about the present population of massive stars, derived from the radio continuum mapping, will be discussed below.
The far-IR flux, from e.g., Lonsdale et al. (1985), is:
| (4) |
For VCC 144, at the nominal distance of 18 Mpc, this implies a FIR luminosity of 7.6 107 L⊙, thus =4.7 and the galaxy is not a strong FIR source. The SFR in VCC 144 can also be estimated from the IRAS data, using the method of Thronson and Telesco (1986). This assumes that essentially the entire luminosity of the massive OB stars is absorbed by the dust and is reemitted in the infrared. This yields the following relation:
| (5) |
with the FIR luminosity given in solar units and approximated by:
| (6) |
where is the distance to the object in Mpc and and are the two IRAS flux densities in Jy. The SFR resulting from this method is similar to that derived from the H data (0.3 M⊙ yr-1), increasing our confidence in the “negligible extinction” case for this galaxy and, coincidentally, in the assumption that most photons from OB stars heat the dust.
It is worthwhile to consider a distance-free parameter, such as the star formation per unit galactic area. This can be derived using the size of the galaxy from its CCD image, or profile, as exhibited in Fig. 1. In this case, the ongoing SFR per unit area is given by:
| (7) |
where the SFR/area is in M⊙/yr/ and is the observed H flux per square arcsecond. The high SFR/area value, 2.28, originates from the strong luminosity and compactness of the object. Not surprisingly, with a high specific SF but small size VCC 144 undergoes strong star formation per unit galactic area, but shows only modest total SFR. For comparison, the Milky Way has a total SFR of and SFR/area of . Large, active, star forming galaxies have SFR/area similar to that of VCC 144 (e.g., Pogge and Eskridge 1987). Thus, once the star formation activity is triggered, its intensity, as manifested by the SFR/area, is similar in small and large galaxies.
This interpretation implies that mechanisms believed to be responsible for star formation in large galaxies but not in dwarf galaxies, such as compression due to density waves or from rotational shear forces, are as efficient as other mechanisms, such as random collision between clouds or gravitational instabilities caused by other effects. Otherwise, there would be significantly more star formation per area in large star-forming galaxies than in late-type dwarfs. It is worth mentioning that here the efficiency of the star formation process, caused by the various mechanisms, is tested, rather than how wide-spread these mechanisms are. Therefore, the conclusion at this stage is that once star formation is induced, its efficiency is approximately the same, regardless of the mechanism which induced it.
The radio synthesis observations indicate that the continuum source is connected with the presence of stars, as the emission is localized in the cloud which coincides with the optical counterpart. The spectral index is consistent with thermal emission processes. The thermal radio continuum can be calculated from the physical conditions in the HII region:
| (8) |
For the observations at 20 cm, with Te=1.3 104K (upper limit, from the [OIII] lines), with the number of ionizing photons calculated from H (see below) and at 18 Mpc, S(1420 MHz)=0.9 mJy. At 5 GHz the thermal radio continuum is 0.8 mJy and makes up 30% of the detected flux. The fraction of non-thermal 20 cm contribution is 1.5 mJy and at 6 cm it is 1.0 mJy. The resultant non-thermal spectral index is 0.3. With an average flux from a SNR at 18 Mpc of 1 mJy there should be at present at most a couple of radio SNRs in VCC 144. This is consistent with the present number of early-type stars; with 2000 O7 stars present (see below), with a lifetime to supernova explosion of 107 years and a radio SNR lifetime of 104 yrs, a couple of SNRs should be detectable at present in radio continuum.
4.2 Time scales and comparison with stellar evolution models
Above we derived a number of SFRs, which can be combined with the observationally-derived masses to yield two indicative time scales. In particular, it is possible to use the “star formation timescale”, defined by Hodge (1993) as:
| (9) |
where is the total mass in stars, estimated with the assumption of , and is the present SFR. For VCC 144 we obtain =1.2 Gyrs, similar to Hodge’s value for the most extreme starburst galaxy in his list. This is an indication on the production of the present-day luminosity with solar-type stars; for an IMF rich in young stars M/L is lower. Mateo (1992) found one Magellanic cluster with M/L0.1 for an age of 8 107 yrs. For three Magellanic clusters, Elson and Freeman (1985) found M/L between 0.11 and 0.56; if this is the case for VCC 144, the mass in stars would be lower and could be yrs or even less.
The Roberts time scale measures the time to exhaust the galactic HI reservoir given the present SFR:
| (10) |
We obtain for VCC 144 =0.9 Gyrs if the entire HI reservoir is considered, or 0.4 Gyrs for the HI coincident with the optical image. The estimate of the Roberts time scale assumes no recycling of material from the stars; otherwise, the time to exhaust the HI will be longer for a constant SFR. For a star formation proceeding in bursts followed by long periods of quiescence, the galaxy could survive for a Hubble time, provided the star formation duty cycle is 2%. This constraint can be relaxed if the total HI would include the diffuse extended cloud of hydrogen.
We compared our results with population synthesis models of Leitherer & Heckman (1995) and found reasonable matches for single star burst models 5-7 Myrs old. We emphasize that the matches are not perfect, but indicative. We tested also the H data through the number of ionizing photons, following Osterbrock (1989) for a simple Case B recombination theory and with the H luminosity in erg/s:
| (11) |
The color index (H–V) for the models, for this purpose, is obtained as
| (12) |
We compared the observed color index [H–V]=–2.5 log [F(H)]–V=15.56, (B–V), and MV with the model predictions. The indices fit a 6 Myr old single star burst model from Leitherer & Heckman (1995) but are not compatible with continuous star formation. These are much too blue to fit the observations. From the value of Nc found for VCC 144, using L(H)=2.7 1040 erg s-1 and adopting a Lyman continuum photon flux of 1049 s-1 from a typical O star, it appears that some 2000 late-O or B stars are needed in VCC 144 at present to ionize the hydrogen. For a Salpeter IMF, this implies that the present star burst produced some 106 M⊙ in stars of all masses.
The observational and derived parameters related to VCC 144 are summarized in the table below. For comparison, we included a few “typical” values from the compilation of Vílchez (1995, V) for star-forming dwarfs, from Huchra (1977, H) for Markarian galaxies, and from Thuan (1992, T) for late-type dwarfs. The metallicity was derived from the [OII]+[OIII] lines as measured from GH89 data and it compares well with the typical metallicity found by Vílchez (1995) for his sample of dwarf galaxies. We conclude that our observations, combined with data from the literature, indicate that a single, short and recent burst of star formation can account for the observed properties of this object.
| Observed properties | VCC 144 | SF DG |
|---|---|---|
| V | 14.83 | |
| B–V | 0.46 | 0. 4 (V) |
| U–B | –0.51 | –0.36 (H) |
| V–R | 0.22 | 0.08–1.17 (H) |
| R–I | 0.23 | |
| UV–V | –1.33 | |
| IRAS ? | Weak | |
| ddmin | 24”12” | |
| Velocity [km s-1]: Optical | 196052 | |
| Velocity [km s-1]: Radio | 2014 | |
| Total H flux [erg s-1 cm-2] | 7.050.76 10-13 | |
| ([OII]+[OIII])/H | 7.78 | |
| HI flux integral [Jy km s-1] | 2.31 | |
| Derived properties | VCC 144 | SF DG |
| d [kpc] | 1 | 0.5–20.6 (V) |
| LB [L⊙] | 3.6 108 | |
| L(Hα) [ erg s-1] | 2.7 1040 | 1038–1041 (V) |
| N(O7) | 2000 | |
| M(HI) [M⊙] | 1.8 108 | 108 (T) |
| M(HI)/LB [M⊙/L⊙] | 2.0 | 2, 4 (T) |
| M(dust) [M⊙] | 9.3 103 | |
| 12+log(O/H) | 8.2 or 7.7 | 7.7–8.9 (V) |
| MG [M⊙] | 1.6 1011 | |
| SFR [M⊙ yr-1] | 0.3 | |
| log(SFR/area) [M⊙ yr-1 pc-2] | –6.64 | |
| log [yrs] | 8.78 |
4.3 Comparison with similar objects
We mentioned in the introduction the unique object HI 1225+01, a faint blue dwarf galaxy with large amounts of hydrogen and a companion HI cloud, which are probably interacting (Chengalur et al. 1995). HI 1225+01 is only 1.6 Mpc away from VCC 144 (in projected distance) and both are located in the same general region of the Virgo cluster. Other similar objects are some of the HII galaxies with HI companions mapped by Taylor et al. (1995, 1996), and some of the BCDs found by van Zee et al. (1995) to have extended HI envelopes. Even the arch-type young galaxy I Zw 18 shows an extended HI envelope (Skillman et al. 1996). However, none are identical with VCC 144.
In many aspects, the optical counterparts of HI 1225+01 and I Zw 18 are similar to VCC 144. The objects are blue and can be understood as recent starbursts. Salzer et al. (1991) identified signs of an older starburst in HI 1225+01, which enriched it with nitrogen and now produces at most 30% of the B light. Chengalur et al. (1995) concluded that the present burst of activity in HI 1225+01 was produced by a recent tidal interaction with the second HI lobe. Thus, its star forming activity could be explained, despite the object being relatively isolated. VCC 144 appears to be similarly isolated from other optical galaxies at the southern outskirts of the Virgo cluster, with NGC 4197 at 54 kpc projected distance as nearest neighbor, but shows a much more intense star forming activity.
The BCDs studied by van Zee et al. (1995) are sometimes extended in HI (16/4140% of the cases). An extended ( size of the optical galaxy), but symmetrical, envelope was found for the nearby irregular galaxy Leo I (Young & Lo 1996). In most cases of diffuse HI near BCDs the HI extension is symmetrical around the optical object. However, in VCC 144 the diffuse HI appears in two extensions off the optical axis. As explained above, the iso-density contours of HI shown in Figs. 4 and 5 appear as two lobes on the extension of the galaxy minor axis. The extensions, mainly the large one to the NE, represent large amounts of kinetic energy, just from considering the mass and velocity difference with respect to the HI on the optical counterpart (5 1052 erg). At least an equal amount of mechanical energy was probably injected as turbulent motion in the blown-out gas. Leitherer & Heckman (1995) calculated a total mechanical energy injected by supernovae and stellar winds of 1.6 1055 erg (scaled to the present MV and for an instantaneous starburst 6 106 yrs old). This indicates that a scenario of ISM blow-out from VCC 144, as a result of a recent starburst event, is a viable proposition.
5 Conclusions
-
1.
Optical observations of VCC144 show a blue compact, elliptical, bright dwarf galaxy. The strong H emission coincides and overlaps the broad band optical image of the galaxy.
-
2.
HI mapping with the VLA shows a main concentration coincident with the optical galaxy and an asymmetric, diffuse extension which has no optical counterpart, and which is extended along the minor axis of the galaxy. Rather large mass is required for the structure to be gravitationally confined.
-
3.
Comparisons with evolutionary synthesis models indicate that a most probable explanation is of a first burst of star formation in the last 107 years. The object does, however, contain dust.
-
4.
Similarities with other dwarf galaxies with extended HI envelopes are noted. We argue that a blow-out scenario is more appropriate for VCC 144 to explain the shape of the HI envelope, than either accretion, or a collision with an HI companion. The conclusion is that galaxy formation, in the form of dwarf galaxies, takes place at present in the Southern outskirts of the Virgo cluster.
Acknowledgements.
Observations at the Wise Observatory are partly supported by a grant from the Israel Science Foundation. UV studies at the Wise Observatory are supported by special grants from the Ministry of Science and Arts, through the Israel Space Agency, to develop TAUVEX, a UV space imaging experiment, and by the Austrian Friends of Tel Aviv University. GLH was supported in part by US National Science Foundation grant AST-9316213 to Lafayette College. NB acknowledges the hospitality of Prab Gondhalekar and of the IRAS Postmission Analysis Group at RAL, as well as IRAS Faint Source catalog searches by Rob Assendorp. We are grateful to the referee, Daniel Kunth, for constructive remarks which improved the quality of this paper.References
- [1] Almoznino, E. 1995 PhD thesis, Tel Aviv University.
- [2] Almoznino, E., Loinger, F. & Brosch, N. 1993 MNRAS 265, 641.
- [3] Bingelli, B., Sandage, A., & Tammann, G.A. 1985 A.J. 90, 1681 (BST).
- [4] Bothun, G.D., Lonsdale, C.J. & Rice, W. 1989 ApJ 341, 129.
- [5] Chengalur, J.N., Giovanelli, R. & Haynes, M.P. 1995 AJ 109, 2415.
- [6] Davidson, K. & Kinman, T.D. 1985 ApJS 58, 321.
- [7] de Vaucouleurs, G., de Vaucouleurs, A., Corwin, H.G., Buta, R.J., Paturel, G., & Fouqué, P. 1991 The Third Reference Catalog of Bright Galaxies, New York: Springer.
- [8] Djorgovski, S. 1990 AJ 99, 31.
- [9] Duc, P.-A. & Mirabel, I.F. 1994 A&A 289, 83.
- [10] Elson, R.A.W. & Freeman, K.C. 1985 ApJ 288, 521.
- [11] Freedman, W.L., Madore, B.F., Mould, J.R., Hill, R., Ferrarese, L., Kennicutt, R.C., Saha, A., Stetson, P.B., Graham, J.A., Ford, H., Hoessel, J.G., Huchra, J., Hughes, S.M. & Illingworth, G.D. 1994 Nature 371, 757.
- [12] Gallagher, J.S. & Hunter, D.A. 1986 AJ 92, 557.
- [13] Gallagher, J.S. & Hunter, D.A. 1989 AJ 98, 806.
- [14] Gallagher, J.S. Hunter, D.A. & Tutukov, A.V. 1984 ApJ 284, 544.
- [15] Giovanelli, R. & Haynes, M.P. 1989 ApJ 346, L5.
- [16] Helou, G. 1986 ApJ 311, L33.
- [17] Hodge, P. 1993 in Star Formation, Galaxies and the Interstellar Medium (J. Franco, F. Ferrini, and G. Tenorio-Tagle, eds.), Cambridge: Cambridge University Press, p. 294.
- [18] Hoffman, G.L., Helou, G., Salpeter, E.E., Glosson, J. & Sandage, A. 1987 ApJS 63, 247.
- [19] Hoffman, G.L., Helou, G. Salpeter, E.E. and Lewis, B.M. 1989b ApJ 339, 812.
- [20] Hoffman, G.L., Salpeter, E.E., Farhat, B., Roos, T., Williams, H. & Helou, G. 1996 ApJS 105, 269.
- [21] Hoffman, G.L., Williams, H.L., Salpeter, E.E., Sandage, A. & Binggeli, B. 1989a ApJS 71, 701.
- [22] Huchra, J.P. 1977 ApJS 35, 171.
- [23] Jablonka, P. & Arimoto, N. 1992 in The Stellar Populations of Galaxies, (B. Barbuy and A. Renzini, eds.), D. Reidel Publishing Company, p. 435.
- [24] Jacoby, G.H., Ciardullo, R and Ford, H. 1990 ApJ 356, 332.
- [25] Kennicutt, R.C. 1983 ApJ 272, 54.
- [26] Kennicutt, R.C. 1989 in The Interstellar Medium in Galaxies (H.A. Thronson & J.M. Shull, eds.) Dordrect: Kluwer, p. 405.
- [27] Landolt, A. 1973 AJ 78, 959.
- [28] Landolt, A. 1992 AJ 104, 340.
- [29] Larson, R.B. 1987 in Starbursts and galaxy evolution (T.X. Thuan, T. Montmerle and J.T.T. Van, eds.), Gif sur Yvette: Editions Frontieres.
- [30] Leitherer, C. & Heckman, T.M. 1995 ApJS 96, 9.
- [31] Lonsdale, C.J., Helou, G., Good, J.C. & Rice, W. 1985 Cataloged Galaxies and Quasars Observed in the IRAS Survey, Pasadena: JPL.
- [32] Mateo, M. 1992 in The Stellar Populations of Galaxies, (B. Barbuy and A. Renzini, eds.), D. Reidel Publishing Company, p. 147.
- [33] Salzer, J.J., di Serego Alighieri, S., Matteucci, F., Giovanelli, R. & Haynes, M.P. 1991 AJ 101, 1258.
- [34] Sandage, A. and Tammann, G.A. 1974 ApJ 194, 559.
- [35] Sargent, W.L.W., Sancisi, R. & Lo, K.Y. 1983 ApJ 265, 711.
- [36] Skillman, E.D. 1996, in The Minnesota lectures on extragalactic neutral hydrogen ASP Conf. Ser. 106 (E.D. Skillman, ed.), p.208
- [37] Skillman, E.D., Palmer, R.C., Garnett, D.R. & Dufour, R.J. 1996 in From Stars to Galaxies, ASP Conf. Ser. (C. Leitherer et al. , eds.), p. 366.
- [38] Szomoru, A., van Gorkom, J.H. & Gregg, M.D. 1996a AJ 111, 2141.
- [39] Szomoru, A., van Gorkom, J.H., Gregg, M.D. & Strauss, M.A. 1996b AJ 111, 2150.
- [40] Taylor, C.L., Brinks, E. & Skillman, E.D. 1993 AJ 105, 128.
- [41] Taylor, C.L., Brinks, E., Grashuis, R.M. & Skillman, E.D. 1995 ApJS 99, 427 (erratum 1996 ApJS 102, 189).
- [42] Taylor, C.L., Thomas, D.L., Brinks, E. & Skillman, E.D. 1996 ApJS 107, 143.
- [43] Thronson, H., Hunter, D.A., Telesco, C., Greenhouse, M. & Harper, D. 1988 ApJ 334, 605.
- [44] Thronson, H.A., Jr. & Telesco, C.M. 1986 ApJ 311, 98.
- [45] Thuan, T.X. 1992 in Physics of nearby galaxies (T.X. Thuan, Ch. Balkowsky, and J.T.T. Van, eds.) Gif-sur-Yvette: Editions Frontieres, p. 225.
- [46] Thuan, T.X. & Sauvage, M. 1992 A&AS 92, 749.
- [47] Tully, R.B. 1988 Nearby Galaxies Catalog, Cambridge: Cambridge University Press.
- [48] Pogge, R.W. & Eskridge, P.B. 1987 AJ 93, 291.
- [49] Van Zee, L., Haynes, M.P. & Giovanelli, R. 1996 AJ 109, 990.
- [50] Vílchez, J.M. 1995 AJ 110, 1090.
- [51] Visvanathan, N. and Griersmith, D. 1979 ApJ 230, 1.
- [52] Young, L.M. & Lo, K.Y. 1996 ApJ 462, 203.