High-resolution near-infrared imaging of the Orion 114-426 silhouette disk111To appear in the special NICMOS/STIS ERO edition of the Astrophysical Journal (Letters), January 1998
Abstract
We present the first high-resolution near-infrared images of the edge-on silhouette circumstellar disk, Orion 114-426, made using NICMOS on the Hubble Space Telescope. Images taken against the bright nebular background of the ionized hydrogen Pa line at 1.87µm show the major axis of the disk to be approximately 20% smaller than at 0.6µm, from which we deduce the structure of the edge of the disk. Continuum images of diffuse polar lobes above and below the plane of the disk show a morphology and evolution with wavelength consistent with predictions for reflection nebulae in a diffuse envelope with large polar cavities, surrounding a thin, massless, Keplerian disk, centered on an otherwise hidden central star. We make use of our observations and reasonable assumptions about the underlying disk structure to show that the disk mass is at least 10 and plausibly .
Subject headings: accretion, accretion disks — circumstellar matter — ISM: individual (Orion Nebula) — stars: formation, pre-main sequence — infrared: ISM: continuum, lines and bands
1 Introduction
The discovery of a family of circumstellar disks seen as dark silhouettes in projection against the Orion Nebula using the Hubble Space Telescope provided strong confirmation of the disk paradigm of star formation (O’Dell et al. 1993; O’Dell & Wen 1994; McCaughrean & O’Dell 1996 [MO96]). The disks range in diameter from 50–1000 AU, and thus the 50 AU (0.1 arcsec at 450 pc) resolution of the HST observations was sufficient to examine their structure directly at optical wavelengths. An important finding was that the radial surface density profiles appear to be abruptly truncated at some outer radius, perhaps due to external effects from the surrounding H II region and dense cluster (MO96), and more detailed examination of this transition zone should lead to a greater understanding of the evolution of disks in harsh environments.
The discovery images were obtained over a relatively narrow wavelength range (5007–6585Å), and further insight should be possible through HST observations at shorter and longer wavelengths. In the blue/near-UV ( 2000–4000Å), the spatial resolution approaches 15 AU, while increased dust opacity at these wavelengths should also allow more tenuous structures to be traced to larger radii. Conversely, the considerable reduction in dust opacity at near-IR wavelengths should allow us to trace structures to smaller radii, albeit with commensurately poorer spatial resolution. Consequently, we are conducting follow-up HST studies from the near-UV to near-IR (0.3–2.5µm), and in the present paper, we report preliminary near-IR observations using NICMOS of one silhouette disk, Orion 114-426. The largest of the sample at 1000 AU diameter, this disk is seen near edge-on, and while the central star is not directly visible at optical wavelengths, its presence is betrayed by two polar nebulosities believed to be illuminated by it.
2 Observations
A comprehensive General Observer program (McCaughrean et al.: GO 7367) studying the Orion silhouette disks with NICMOS, STIS, and WFPC2 is being carried out during HST Cycle 7. Early Release Observations using NICMOS were subsequently proposed by the Instrument Development Team (Erickson et al.: SM2/ERO 7114) for scientific verification and media use. Due to this overlap, the ERO data were reduced and analysed collaboratively, resulting in studies of 114-426 (presented here) and of the 182-413/183-419 field (Chen et al. 1998).
NICMOS observations of the 114-426 field were obtained on 19 April 1997 during the Servicing Mission Orbital Verification following installation in the HST. Images were taken through broad-band, narrow-band, and polarimetric filters between 1 and 2.1µm as summarized in Table 1. Data reduction combined standard ground-based near-IR imaging techniques with parts of the NICMOS calibration pipeline. Multiple read-outs combined with multiple positions on the sky were used to reject cosmic-ray events; electronic offsets were removed with on-orbit dark images; quantum efficiency variations were removed with flat fields taken on-orbit where possible, otherwise from ground tests. Finally, mosaics were made registering the multiple images using stars or HST pointing information. Detailed photometric calibration was not attempted, but ground-based near-IR magnitudes for stars in the field were used to calibrate within .
Despite integration times significantly shorter than those planned for the GO program, important preliminary results were nevertheless obtained from the narrow-band imaging against the bright Pa background at 1.87µm, broad-band imaging at 1.1 and 1.6µm, and the polarization imaging at 2.0µm. The three polarizer position images were combined to form a 2µm continuum image, but due to remaining uncertainties in the correct analysis techniques for NICMOS polarimetry and incomplete on-orbit polarization calibration, the polarization results themselves are deferred to a future paper. The remaining narrow-band images did not provide useful additional information and are not further discussed.
3 Results
3.1 Narrow-band imaging in Pa
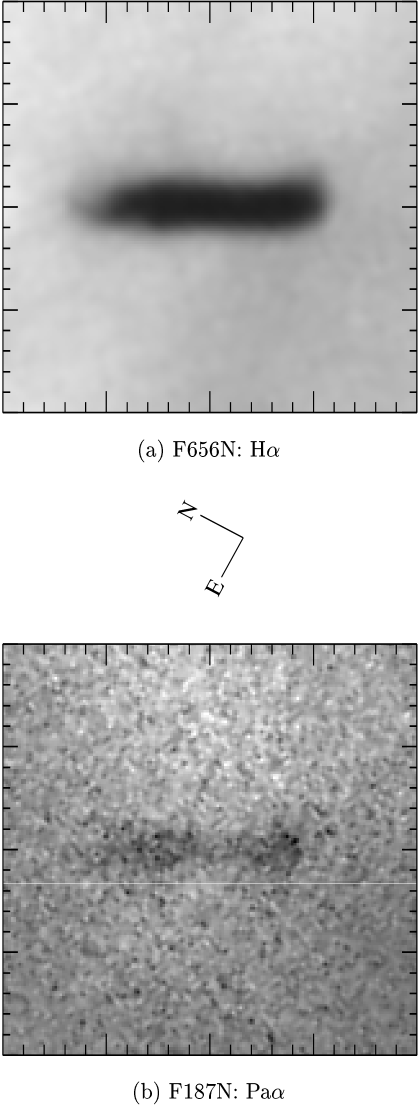
The highest S/N images of the silhouettes obtained by MO96 were through a narrow-band H (6565Å) filter, admitting the full emission line flux from the bright Orion Nebula H II region, while minimizing continuum emission from the central stars, or in the case of 114-426, its polar lobes. The brightest near-IR counterpart is the Pa line at 1.87µm, which cannot be detected from the ground due to atmospheric absorption. For typical H II region ionization parameters (104 K, 104 cm-3, Case B) and foreground to the nebula, the detected photon flux at Pa should be 60% of that at H: the brightest equivalent line available to ground-based observers (Br at 2.16µm) would be a further factor of ten fainter (Osterbrock 1989).
The Pa 1.87µm image of 114-426 is shown in Figure 1 with the H (6565Å) image from MO96. The S/N in the P image is poor (5:1) since the integration time was short (288 sec), and the NIC1 image scale of 0.0432 arcsec/pixel over-resolved the 0.19 arcsec FWHM diffraction-limited resolution of the telescope at 1.87µm. Nevertheless, the silhouette is clearly detected, allowing a preliminary measurement of its size. The data were binned by a factor of two to better match the appropriate pixel size (i.e., 2 pixels per FWHM) and then averaged across the minor axis. The resulting 1D major axis profile had high enough S/N to show the two ends of the disk as sharp dips separated by 1.8 arcsec. As discussed in detail by MO96, the apparent size and structure of a silhouette disk is a convolution of its real form with the instrumental point spread function, and following MO96, we adjusted the parameters of a model edge-on disk convolved with a model HST+NICMOS PSF calculated using the Tiny Tim software (Krist & Hook 1997) until the major axis length was reproduced. The resulting best-fit model disk has a major axis size of 800 AU at 1.87µm, 20% less than the 1012 AU measured at 0.6µm (MO96). The same procedure used on the 2µm continuum image (Section 3.2) yielded the same result to within 5%. Finally, we verified the overall procedure by degrading the high S/N [O III] image from MO96 to the same spatial resolution and S/N as the Pa image, then performing the same fitting process, before retrieving the correct size for the disk at optical wavelengths.
3.2 Continuum imaging of the polar lobes
The optical continuum image of 114-426 showed faint polar lobes, interpreted as reflection nebulae of tenuous dust above and below the plane of the disk, illuminated by the otherwise unseen central star (MO96). Similar reflection nebulae are seen above and below the plane of an edge-on disk in the HH 30 system (Burrows et al. 1996). The wavelength dependent morphology and polarization structure of the lobes in 114-426 should allow us to probe the underlying form of the disk, the geometry of polar cavities, the grain size, and scattering function.
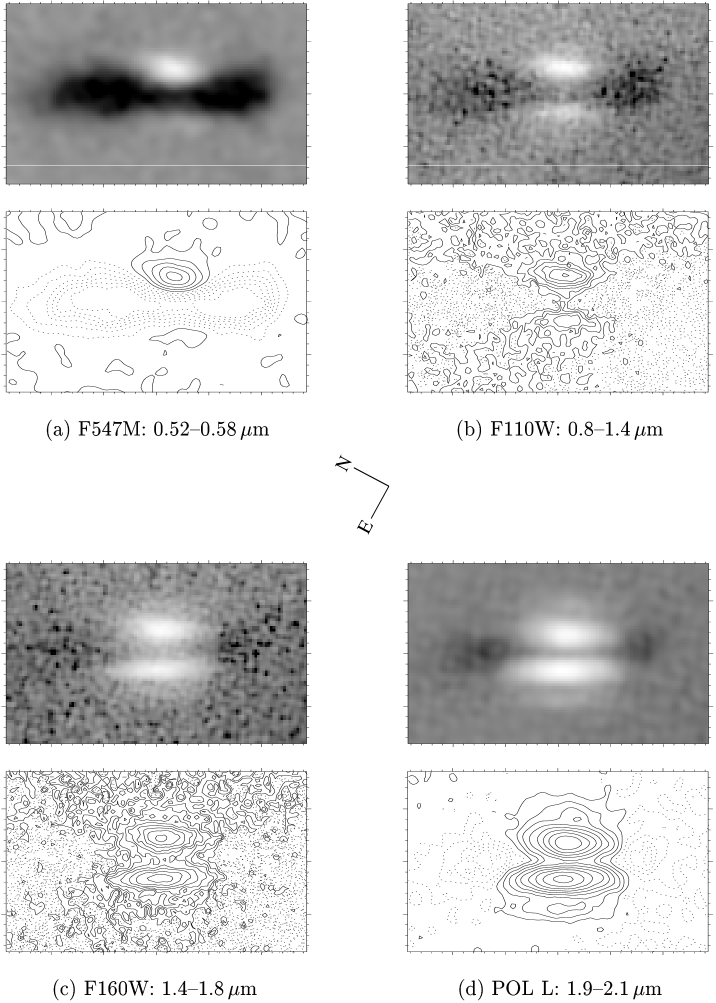
The near-IR broad-band continuum images, along with the F547M image from MO96, are shown in Figure 2 in grayscale and contour forms. As the wavelength increases, three effects are seen. First, the initially fainter SE polar lobe increases in brightness until it equals then outshines the intensity of the NW lobe. The peak intensities in the lobes (after background subtraction) are in the ratios 7.3:1, 2.2:1, 1.2:1, and 0.85:1 for the NW:SE lobes, at 0.57, 1.1, 1.6, and 2.0µm respectively. Second, the nebulae move closer together, as the reduced extinction allows us to probe closer to the disk midplane: the separations of the peak pixels in the two lobes are at 0.64, 0.43, 0.40, and 0.32 arcsec at 0.57, 1.1, 1.6, and 2.0µm respectively. Third, the nebulae appear to flatten from conical to slab-like.
These features can be compared to model disks and envelopes (e.g., Lazareff, Pudritz, & Monin 1990; Whitney & Hartmann 1992 [WH92], 1993 [WH93]; Fischer, Henning, & Yorke 1996 [FHY96]). The general broad fan shape and increasing flatness of the nebulae are best reproduced by model SH of FHY96, i.e., a thin, massless disk (in comparison to the central star) in Keplerian rotation, with an envelope and broad polar cavities. Models with thick, massive disks have more polar material and result in images with too much elongation perpendicular to the disk. The same is true of models with just a narrow, cylindrical polar hole rather than a broader, so-called “streamline” cavity (WH93).
Since the central star in 114-426 is not seen, the disk must lie within a few degrees of edge-on, as the thin disk of the SH model does not occult the central star unless this condition is met (FHY96). This degree of alignment is also argued for on the grounds that the two lobes have nearly equal brightness in the near-IR. The asymmetry between the two lobes in the optical continuum (Figure 2a) can probably explained by asymmetries in the outer, more diffuse parts of the envelope, perhaps due to external effects in the H II region.
4 Discussion
4.1 Disk structure
The disk appears 20% smaller at 1.87µm than at 0.6µm, and thus we are clearly resolving structure in its outer parts. In order to understand the implications of these observations, we need to examine the theoretical expectations. For a thin, massless, Keplerian disk that is hydrostatically supported and vertically isothermal (Shakura & Sunyaev 1973; Pringle 1981; Lazareff et al. 1990), the density as a function of radius, , and height above the midplane, , is:
| (1) |
where is the midplane density at the outer disk radius, , and is the disk scale-height:
| (2) |
where is the scale-height at . The disk surface density is then:
| (3) |
For typical Orion Nebula dust grains (R=5; Cardelli, Clayton, & Mathis 1989), the extinction at 1.87µm is one sixth of that at 0.6µm, and thus achieving the same effective optical depth requires six times higher column density at the longer wavelength. For a face-on disk with unity optical depth at 0.6µm at 506 AU radius, Eq. 3 shows that the equivalent optical depth at 1.87µm would occur at 46 AU, i.e., the disk would appear much smaller in the near-IR. For an edge-on disk, the calculation is harder: we are probing the midplane density of the disk, not the surface density, and the line-of-sight through the disk at a given “impact parameter” (i.e., the distance off-center) integrates over different densities at different radii. Assuming the disk is truncated at some outer radius, we can integrate the total column density through the midplane as a function of the impact parameter, . We have calculated profiles for disks in which the midplane density scales as , with and (Figure 3). These values were chosen since simple analytical integrals exist in each case, but they also closely correspond to plausible disk models: would yield a surface density independent of radius; yields the canonical ; yields , a commonly assumed density law for more massive circumstellar disks (cf. Adams, Shu, & Lada 1988).
Rough power laws can be fit to the inner section of each curve in Fig. 3, with the column density increasing as , and , and corresponding to and respectively. In the canonical case of , a disk with unity optical depth at 506 AU at 0.6µm would have the same optical depth at 84 AU at 1.87µm. Thus, even though an edge-on disk will shrink less with wavelength than a face-on one, it is clear that for 114-426, the observed decrease in size of only 20% (i.e., dex) for an increase in density of six (i.e., 0.78 dex) would require , and thus and , quite inconsistent with conventional understanding of disk structure.
The exception comes near the edge of a disk, where the integrated column density rises sharply as the path length increases most rapidly. Indeed, Fig. 3 shows that in the case, the density does increase by the required factor of six within 80% of the outer radius, as observed. Thus, the observed shift between the optical edge at 506 AU and the infrared edge at 400 AU could still be consistent with the midplane density following the canonical power law for a thin, massless disk, as long as the disk is physically truncated somewhere near the optical edge. As discussed by MO96, it seems plausible that the disk may be truncated due to physical processes present in the Orion Nebula H II region and/or Trapezium Cluster, and it may be possible to ascertain which particular process is responsible from our future HST observations, which will trace the radial structure of 114-426 over a full order of magnitude in limiting column density.
4.2 The disk mass revisited
The mass of the 114-426 disk remains unknown: in particular, does it exceed the 0.01 of the minimum mass solar nebula (MMSN), i.e., is it massive enough to form a planetary system similar to our own? O’Dell & Wen (1994) and MO96 discuss how the mass of a silhouette disk can be roughly estimated, noting that the minimum intensity seen towards it is typically 10% of that of the background H II region. Assuming this to be background emission attenuated by the disk, a line-of-sight column density is calculated for each point in the silhouette, and summing over the whole disk area, a total mass is estimated. However, virtually all of this “disk light” is an artifact, as the the background emission is blended into the disk by the instrumental PSF (MO96). Thus the usefulness of the “transmission technique” is diminished, but it at least provides an absolute lower-limit mass, an important counterpoint to the results from millimeter interferometry which are, as yet, generally provide only upper-limit masses for disks in the Trapezium Cluster (Mundy, Looney, & Lada 1995; Lada et al. 1996).
MO96 used the transmission technique to estimate lower-limit masses for the six silhouette disks based on their optical images. The masses were small, typically several orders of magnitude less than the MMSN. The most massive was 114-426 at 0.002 , but we must report here that an error was made in calculating the area and thus mass of 114-426 in MO96: its minimum mass should be revised downwards to . (The masses for the other disks given in Table 2 of MO96 remain unaffected by this error).
In principle, the transmission technique could be applied to our new near-IR images of 114-426, resulting in a significantly higher estimate of the minimum mass. Since the disk is only marginally smaller at 1.87µm, the reduced near-IR extinction should lead to a higher mass, on the order of the factor of six in . However, the present images are not good enough to make such estimates: the Pa image has very poor S/N, making a reliable measure of the disk/background flux ratio impossible, and while the continuum images have much higher S/N, the silhouette is contaminated by the reflection nebulae, making it difficult to measure the underlying disk/background flux ratio and the true silhouette area. Such calculations must wait until higher-quality Pa data are available.
In the interim, alternative approaches to estimating the disk mass can be taken. The non-detection of the central star in the POL 2µm continuum image can be used to set a lower limit on the total column density through the disk midplane, depending on the intrinsic brightness of the star. The integrated flux from the two reflection nebulae is K=, which clearly only represents a fraction of the flux we would see from the central star if it had no disk. Some estimate of this fraction can be made from WH92 and WH93, who tabulate (the total flux observed as a fraction of the flux that would be seen if the star had no disk or envelope) for a variety of models. While ranges from 0.01–10% depending on the disk and envelope structure, inclination angle, grain properties, and total opacity, 1% is typical for models inferred for 114-426 (i.e., near edge-on flared disk, e.g., WH92 models 3,4 with , perhaps with a tenuous envelope with broad polar cavities, e.g., WH93 models 5–8). The inferred intrinsic brightness of the central star is then K, corresponding to a 1 Myr old, 1.5 star at 450 pc (D’Antona & Mazzitelli 1994). Since the star is undetected in the 2µm image to a 5 point source detection limit of K=, the implied line-of-sight extinction towards it is at 2µm, or . Assuming the disk is exactly edge-on, the corresponding column density through the disk midplane to the central star is cm-2 (assuming 1 cm-2).
The disk outer radius, AU, is known from the data of MO96. The same data can be used to determine , the scale-height at : we fit a 1D average minor axis profile across the [O III] image of 114-426 (Fig. 4 of MO96) with a Gaussian characterized by Eq. 2, yielding AU. Finally, we assume the disk inner radius, AU: since the surface density increases towards the center with a power , our results are not too sensitive to this assumption. Integrating Eq. 1 (with ) through the midplane, we calculate the midplane density at the outer edge, cm-3. Then integrating Eq. 3 between and , the total number of particles (HI + 2H2) is , yielding a mass estimate of g or .
Although it is clear that very little mass is required to render the central star invisible, the disk mass is likely to be significantly greater. Using the analytical solution for the total column density seen through the midplane of an edge-on disk in the case (Section 4.1), and assuming cm-3 at an outer radius of 506 AU, we obtain values cm-2 or just inside the edge. Yet the disk must have a significantly higher column density there to be seen as an edge: the results of MO96 show that the attenuation at the edge of the disk is at least 85%, equivalent to , in turn implying cm-3. This is a plausible value if (for example) the location of the disk edge is set by pressure balance with the surrounding H II region: assuming a temperature and density for the latter of 104 K and 104 cm-3 and an outer disk temperature of 10–100 K, densities at the disk edge of – cm-3 would be predicted.
Inserting cm-3 into Eq. 3 along with our other derived disk parameters yields a disk mass of g or . While still considerably less than the MMSN, this is a lower limit, and the disk might be more massive. However, our present simple calculations based on lower-limit extinction measurements alone cannot be pushed much further. Burrows et al. (1996) have shown for HH 30 that more realistic mass estimates can be made by fitting the structure of the polar reflection nebulae, in particular the width of the dark lane of obscuration between them, and such an approach will be taken with 114-426 when our higher S/N and resolution Cycle 7 HST data are available. Ultimately, the most meaningful estimate of disk mass must come from measurements of optically thin tracers at millimeter wavelengths: such observations have been obtained for 114-426 and will be discussed in a future paper.
5 Conclusions
We have presented preliminary NICMOS images of the Orion 114-426 circumstellar disk. The disk appears to be roughly 20% smaller at 1.87µm than at at 0.6µm, which we attribute to a standard radial power-law density distribution inside a heavily truncated edge to the disk at 500 AU radius. The general wavelength-dependent morphology of the polar lobes is consistent with models of a thin, massless disk surrounded by a tenuous envelope with broad polar cavities, and their flux was used as an indirect way of estimating the mass of the central star to be 1.5 . The non-detection of the star at 2µm was then used to estimate the minimum total column density through the disk midplane, and thus a minimum disk mass of , assuming that it follows the standard form for a massless disk in Keplerian rotation. The hard edge of the disk was used to improve the lower-limit estimate under similar assumptions, resulting in a mass .
Acknowledgements
We thank the University of Arizona, Ball Aerospace, Rockwell, NASA GSFC, and the STScI for developing, managing, and commissioning NICMOS. MJM thanks Abi Saha for brokering the agreement between the NICMOS IDT ERO and Cycle 6/7 GO teams, Chris Skinner and Eddie Bergeron for data reduction help, and Matthew Bate, Olaf Fischer, Bob O’Dell, Peter Schilke, and Hans Zinnecker for useful discussions. Finally, we would like to thank the referee, Karl Stapelfeldt, for his insightful comments.
References
- adams (88) Adams, F. C., Shu, F. H., & Lada, C. J. 1988, ApJ, 326, 865
- burrows (96) Burrows, C. J. et al. 1996, ApJ, 473, 437
- cardelli (89) Cardelli, J. A., Clayton, G. C. & Mathis, J. S. 1989, ApJ, 345, 245
- chen (97) Chen, H., Bally, J., O’Dell, C. R., McCaughrean, M. J., Thompson, R. I., Rieke, M. J., Schneider, G., & Young, E. T. 1998, ApJ, in press
- dantona (94) D’Antona, F., & Mazzitelli, I. 1994, ApJS, 90, 467
- fischer (96) Fischer, O., Henning, T., & Yorke, H. 1996, A&A, 308, 863 (FHY96)
- krist (97) Krist, J., & Hook, R. 1997, Tiny Tim User Manual Version 4.3, http://scivax.stsci.edu/krist/tinytim.html
- lada (96) Lada, E. A., Dutrey, A., Guilloteau, S., & Mundy, L. G. 1996, BAAS, 189, #53.01
- lazareff (90) Lazareff, B., Pudritz, R. E., & Monin, J.-L. 1990, ApJ, 358, 170
- mccaughrean (96) McCaughrean, M. J., & O’Dell, C. R. 1996, AJ, 111, 1977
- mundy (95) Mundy, L. G., Looney, L. W., & Lada, E. A. 1995, ApJ, 452, L137
- odell (93) O’Dell, C. R., Wen, Z., & Hu, X. 1993, ApJ, 410, 696
- odell (94) O’Dell, C. R., & Wen, Z. 1994, ApJ, 436, 194
- osterbrock (89) Osterbrock, D. E. 1989, Astrophysics of gaseous nebulae and active galactic nuclei, (Mill Valley: University Science Books), p84
- pringle (81) Pringle, J. E. 1981, ARA&A, 19, 137
- shakura (73) Shakura, N. I., & Sunyaev, R. A. 1973, A&A, 24, 337
- whitney (92) Whitney, B. A., & Hartmann, L. 1992, ApJ, 395, 529 (WH92)
- whitney (93) Whitney, B. A., & Hartmann, L. 1993, ApJ, 402, 605 (WH93)
![[Uncaptioned image]](/html/astro-ph/9710371/assets/x1.png)