Evidence for Dust Related X-ray Emission from Comet C/1995 O1 (HaleBopp)11affiliation: Partially based on observations carried out at the European Southern Observatory (ESO), La Silla, Chile
Abstract
We report the discovery of X-ray emission from comet C/1995 O1 (Hale-Bopp) by the LECS instrument on-board BeppoSAX on 1996 September 10–11. The 0.1–2.0 keV luminosity decayed by a factor of 2 on a timescale of 10 hr with a mean value of erg s-1. The spectrum is well fit by a thermal bremsstrahlung model with a temperature of keV, or a power-law with a photon index of . The lack of detected C and O line emission places severe constraints on many models for cometary X-ray emission, especially those which involve X-ray production in cometary gas. The luminosity is a factor of at least 3.4 greater than measured by Extreme Ultraviolet Explorer (EUVE) 4 days later. This difference may be related to the emergence from the nucleus on 1996 September 9 of a dust-rich cloud. Over the next few days the cloud continued to expand becoming increasingly tenuous, until it had reached an extent of 3 105 km (or 2′) by the start of EUVE observation. We speculate that the observed reduction in X-ray intensity is evidence for dust fragmentation. These results support the view that cometary X-ray emission arises from the interaction between solar X-rays and cometary dust.
1 INTRODUCTION
The ROSAT observations of X-ray emission from comets C/1996 B2 (Hyakutake) and C/1990 N1 (Tsuchiya-Kiuchi) came as a considerable surprise (Lisse et al. 1996; Dennerl et al. 1996b) and despite considerable effort there is still no generally accepted model for cometary X-ray emission. The emissions were centered a few arc-minutes (2 104 km) from the nucleus and had an extent of 5–15′, or (3–8) 104 km, being elongated normal to the Sun-nucleus line. The observed fluxes are a factor of 103 greater than predicted by early models in which X-rays are generated by fluorescent emission and scattering of solar X-rays in the coma (see Krasnopolsky (1997) for a review). Models which generate X-rays in the coma via solar wind proton, or electron, interactions also suffer from low efficiencies. In view of these difficulties, several models have emerged which predict higher cometary X-ray intensities (see Table 1). In the solar wind models of Häberli et al. (1997) and Cravens (1997) X-rays are generated following charge exchange excitations of highly ionized solar wind ions with neutral molecules in the comet’s atmosphere. Bingham et al. (1997) propose that cometary X-rays are produced by energetic electrons generated by plasma wave turbulence. The turbulence is assumed to result from the relative motion of the cometary plasma and the solar wind. The attogram dust models of Wickramasinghe & Hoyle (1996) and Krasnopolsky (1997) produce X-rays from the scattering, fluorescence and bremsstrahlung of solar X-rays in attogram (10-18 g) dust particles, such as those detected in the wake of comet Halley (Utterback & Kissel 1990). Recently sub-micron sized grains have been observed in the coma of Hale-Bopp (Williams et al. 1997).
At the time of the BeppoSAX observation, Hale-Bopp (C/1995 01; Hale & Bopp 1995) was 2.87 AU from the Earth at a heliocentric distance of 3.13 AU and at a relatively constant brightness of m. The Sun was at a Position Angle of 274∘ and the comet phase angle (Sun-comet-Earth angle) was 187. The size of the coma was estimated to be 20′ (2.5 106 km) and some observers reported a short dust tail of up to 15 (107 km). The diameter of the nucleus is estimated by the Hubble Space Telescope to be 27–42 km (Weaver et al. 1997). In 1996 September Hale-Bopp was observed by the Extreme Ultraviolet Explorer (EUVE), ROSAT, ASCA, and BeppoSAX satellites. We present here results from the BeppoSAX observation briefly reported in Owens et al. (1997). Results from ASCA can be found in Kellett et al. (1997) and EUVE in Mumma et al. (1997) and Krasnopolsky et al. (1997a).
2 X-RAY OBSERVATION
The Low Energy Concentrator Spectrometer (LECS, 0.1-10 keV, Parmar et al. 1997) is one of five instruments on-board BeppoSAX (Boella et al. 1997a). It comprises an imaging mirror system and a driftless gas scintillation proportional counter. The energy resolution is 32% at 0.28 keV, the field of view (FOV) is 37′ diameter (4.6 106 km at the comet) and the full width at half-maximum (FWHM) of the encircled energy function is at 0.2 keV, falling to 51 at 1 keV. The effective area just below the C edge at 0.28 keV is 20 cm2. The in-orbit background counting rate is 9.7 10-6 arcmin-2 s-1 keV-1. BeppoSAX was launched into a 600 km equatorial orbit on 1996 April 30.
Hale-Bopp was observed by BeppoSAX between 1996 September 10 04:55 and September 11 04:21 UTC. The LECS exposure is 11.5 ks. A weak (2.1 0.3) 10-12 erg cm-2 s-1; 0.1–2.0 keV) source is visible 35 off-axis. The source position is 2′ (2.6 105 km) from the comet’s nucleus (see below) and examination of the ROSAT All Sky Survey catalog (Voges et al. 1996) reveals no known X-ray sources at this position. Using the ROSAT logN-logS relation of Hasinger et al. (1993) the probability of randomly detecting an X-ray source as bright as this within the extraction region is . We exclude a UV leak as being responsible for the counts since the LECS has made a number of deep observations of UV bright stars such as Polaris and Capella and no unexpected features were found. In addition, there are no unusual objects in the SIMBAD database and inspection of several deep LECS exposures revealed no “hot spots”, or other instrumental features at this position. The Medium Energy Concentrator Spectrometer (MECS; 1.3–10 keV; Boella et al. 1997b) detected excess 1.3–2.0 keV emission at a position consistent with the LECS detection (at 1.3 confidence) with an intensity of 10-14 erg cm-2 s-1. This is in good agreement with LECS 1.3–2.0 keV intensity of 10-14 erg cm-2 s-1. Based on the above, we identify comet Hale-Bopp as the source of the detected X-rays.
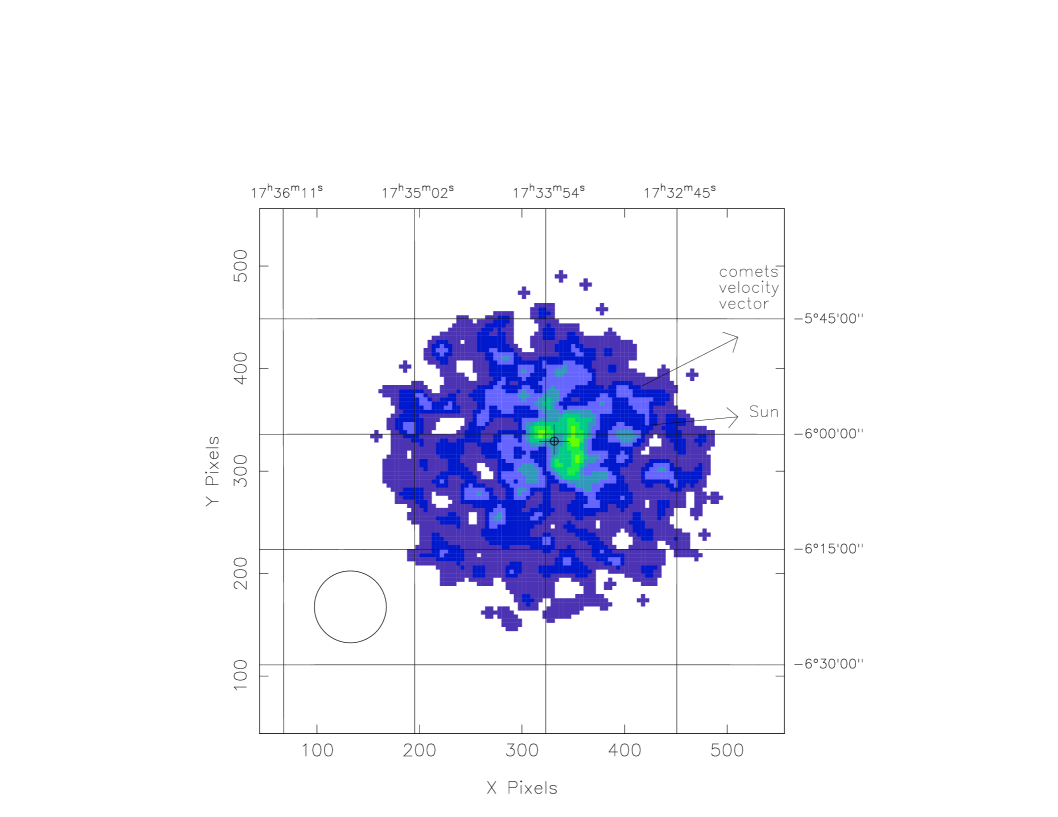
A motion corrected image of the region of sky containing Hale-Bopp is shown in Fig. 1. The image is re-binned to a 56″ 56″ pixel size and smoothed using a Gaussian filter of width 15 (1.9 105 km). The direction of the comet’s motion and the position of the Sun are indicated. The bulk of the emission originates on the sunward side of the comet in agreement with ROSAT images of comet Hyakutake (Lisse et al. 1996). The extent of the emission is consistent with the LECS point spread function (PSF) of 95 FWHM at the mean energy of the detected emission, although the width normal to the Sun-nucleus axis appears wider than in the direction of motion, similar to that observed in other comets. The 68% confidence limit to any source extent is 65 or km. At the start of the LECS observation, the source position is RA = 17h 33m 434, decl. = 6∘ 01′ 12″ (J2000) with a 68% confidence uncertainty radius of 10. This is , or km, from the position of the nucleus, in the general solar direction.
The source spectrum was extracted from within an 8′ radius of the mean source position and analyzed using version 1.4.0 of the SAXLEDAS data analysis system. No correction for the comets 17″ hr-1 motion was applied since most of the events arrive within the first s (see Fig. 2) when the movement of 25 is small compared to the size of the extraction region. The total number of counts is 246, whereas 113 are obtained at the same position in the standard background exposure. The comet’s position at the time of the LECS observation was near the southern tip of the North Polar Spur. The low-energy X-ray background in this area is higher than in the areas used in the standard LECS background field (e.g., Snowden et al. 1995). For this reason the background spectrum was extracted from the image itself using an 8′ radius region centered 16′ diametrically opposite in the LECS FOV. A small correction for mirror vignetting was applied. After background subtraction, the count rate is s-1.
The extracted spectrum is equally well fit (with ’s of 9 for 9 degrees of freedom (dof)) by a thermal bremsstrahlung model of temperature keV or a power-law model of photon index (Fig. 3). A blackbody gives a less acceptable fit with a of 18 for 9 dof (P()=3%). The 0.1–2.0 keV spectrum predicted by the Solar wind model of Häberli et al. (1997) was also fit to the LECS data. This spectrum consists of a series of narrow lines resulting from the excitation of highly charged states of O, C, and Ne ions (see Table 2 of Häberli et al. 1997). The line species are not expected to vary appreciably from comet to comet, and so the line energies were fixed at the values given in Häberli et al. (1997). The best-fit is 44 for 6 dof, with 3 of the lines requiring zero flux. The 95% confidence limits to C and O narrow line emission at 0.28 and 0.53 keV are and erg s-1, respectively. This implies that any such narrow line luminosity must be 18% of the 0.1–2.0 keV continuum luminosity.
The 0.1–2.0 keV luminosity is erg s-1, or erg cm-2 s-1, for the best-fit thermal bremsstrahlung spectrum and erg s-1, or erg cm-2 s-1, for the best-fit power-law spectrum. Using the 0.07–0.18 keV EUVE Deep Survey camera, Krasnapolsky et al. (1997), assuming spectrally uniform emission, derive 0.095–0.165 keV fluxes of and photons s-1 for radii of and km, respectively. This narrower energy range is used by Krasnapolsky et al. (1997) to reflect the “effective” instrument bandpass. In addition, the LECS source is point-like (with an extent of km), while that observed by EUVE is extended. It is therefore not straightforward to compare LECS and EUVE fluxes. Using the EUVE flux within the upper-limit LECS source extent, gives a LECS to EUVE flux ratio of . (Note, the EUVE flux was derived assuming spectrally uniform emission.) Using the larger source radius reduces this ratio to . The above uncertainties include the contribution from the error on the LECS temperature determination. Although the measured extent of the dust cloud (2–4 km) at the time of the EUVE observation is comparable to the smaller radius, we take the worst case LECS to EUVE flux ratio to be 3.4.
Figure 2 shows light curves for the same source and background regions as for the spectrum. The integration interval is 2000 s. A best-fit constant count rate to the background region data yields a of 14 for 15 dof, whereas for the source region the is 44 for 13 dof. Figure 2 indicates that the X-ray intensity of the comet gradually decreased during the observation and is variable by a factor of 2 on a timescale of hours. Modeling the light curve by an exponential decay, reduces the to 18 for 12 dof for a 1/e time of 9.3 hr.
3 OPTICAL OBSERVATIONS
Contemporary optical observations were carried out on the 2.2 m telescope at La Silla using the multi-mode EFOSC II instrument in 3 narrow bands to differentiate between dust (=4467 Å , =56 Å FWHM) and C2 (=5117 Å , =56 Å FWHM) and CN (=3849 Å , =87 Å FWHM) gas emissions. Hale-Bopp was observed at about 01:00 UTC on the nights of 1996 September 10 to September 17 with exposure times of 180 s (dust), 180 s (C2) and 300 s (CN). Each image was divided by the previous one so that temporal changes in the coma become apparent. This technique removes the strong smooth intensity profile of the coma so that superimposed time variable structures become visible (Schulz 1991).
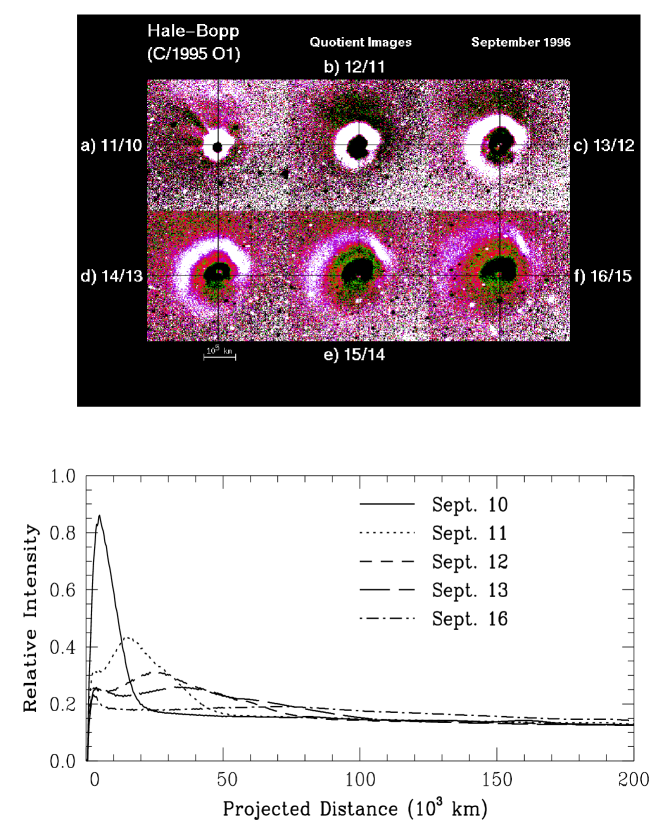
The quotient images (Fig. 4, top) and differential brightness profiles (the lower panel of Fig. 4) show that a dust cloud was ejected from the nucleus which expanded outwards and appeared as a shell when integrated over the line of sight. The original images show that the bulk of the dust was emitted towards the North and North-West. Additionally, four jets are apparent in Fig. 4 confirming the observations of Kidger et al. (1996). They are suppressed in subsequent images because the exposures were taken at intervals of very nearly twice the rotation period (11.5 hr) of the nucleus. The jets are unlikely to be related to the cloud as multiple jets were continually observed during 1996 August and September (Kidger et al. 1996).
The transverse dust velocities were determined by measuring the position of maximum emission in radial brightness profiles derived from the original images (see the lower panel of Fig. 4). By extrapolating backwards, the onset of the outburst occurred on 1996 September 9 ( UTC. The thickness of the shell is a function of the outburst lifetime and the velocity distribution of the dust. The images indicate that the outburst lasted for 1 day, after which dust ejection ceased and the shell expanded outwards at an average velocity of 0.11 km s-1, becoming increasingly tenuous. The temporal evolution of the dust radial intensity profiles is shown in the lower panel of Fig. 4. The quiescent intensity is taken to be that measured 2 105 km from the comet on 1996 September 10. This distance is a factor of 10 times further than the outburst dust had traveled, and so provides an uncontaminated measure. Assuming the dust column density is proportional to its optical intensity, the ratio of maximum to quiescent intensities gives an estimate of the change in dust column density. This is at least a factor of 7 greater at the time of the LECS observation. After September 10, the dust cloud density decreased at an initial rate of 40% per day as the shell expanded outwards. On September 11 the cloud had an angular extent of 08 or 105 km and by the start of the EUVE observation (September 14), it had increased to 2′ or 3 105 km. At this time, the cloud occupied a volume of 1031 cm3 and the column density of dust had returned to within a factor of 2 of its “quiescent” level. The cloud can hardly be discerned in the CCD image of September 16. EUVE continued observing until September 19.
For the gas images, only a CN shell was detected and only on September 10. It had a radial extent about twice that of the dust, but with a relative change in column density of 10 times less. However, CN is a daughter product which is believed to be partially released from the dust (A′Hearn et al. 1995) and is therefore not representative of the gas outflow from the nucleus. At these heliospheric distances, dust activity is driven largely by CO and H2O emission (Weaver et al. 1997) to which the CCD images are insensitive. Biver et al. (1997) measured the outflow velocities of CO and OH (the main by-product of H2O photo-dissociation) around the time of the LECS observation to be 0.5–0.7 km s-1 i.e., at least 5 times that of the dust. Additionally, while the nucleus was out-gassing significant quantities (3 1029 s-1) of both molecules, there is no evidence of a large gas outburst in the data of Biver et al. (1997). We caution however, that such an event could be missed since the lifetimes of CO and H2O are of the order of days, and the data are infrequently sampled.
4 DISCUSSION
The best-fit LECS bremsstrahlung temperature of keV is similar to that determined by ROSAT for comets Hyakutake and Tsuchiya-Kiuchi (0.40 keV, Lisse et al. 1996; Dennerl, Englhauser, & Trümper 1996b). Figure 1 indicates that the bulk of the X-ray emission originates on the sunward side of the nucleus, also in agreement with previous observations. The emission may also show a characteristic elongation normal to the Sun-nucleus line. The similarity in properties between the LECS measurement of comet Hale-Bopp and ROSAT observations of Hyakutake and Tsuchiya-Kiuchi further supports the view that the X-rays originate from Hale-Bopp. The 0.1–2.0 keV luminosity of erg s-1 is a factor 12 greater than observed from comet Hyakutake at a heliocentric distance of 1.0 AU and a factor 2.5 greater than from comet Tsuchiya-Kiuchi at a heliocentric distance of 1.4 AU. As we demonstrate below, the intense X-ray emission observed from comet Hale-Bopp by BeppoSAX is probably related to the large amount of dust present at the time.
The LECS spectrum is inconsistent with that expected from models which predict the bulk of emission to be in the form of lines, such as the solar fluorescent and the solar wind charge exchange models. In the case of comet Hyakutake, the plasma turbulence model of Bingham et al. (1997) predicts an O vii 0.57 keV line with an intensity 10 times greater than the underlying bremsstrahlung continuum (Kellett et al. 1997). For comet Hale-Bopp, the 95% confidence upper limit to any such line emission is 16% of the 0.1–2.0 keV continuum intensity or 10% of the total luminosity. Models which involve perturbations of the solar wind or interplanetary magnetic field can also be excluded by contemporaneous Geostationary Observational Environmental Satellite-8 (GOES-8) and Solar Wind Experiment (SWE) data which show that the solar X-ray and particle fluxes and the local magnetic field were stable at very low levels around the time of the LECS observation.
Krasnoplosky (1997) has shown that the attogram dust model can successfully explain the measured fluxes from comet Hyakutake. Scaling the Hyakutake X-ray flux by the quiescent gas and dust production rates and heliospheric distances of Hyakutake and Hale-Bopp, the predicted Hale-Bopp X-ray flux is in good agreement with that measured by , under the assumption that the X-ray emissivities are similar (Krasnopolsky et al. 1997b). Since X-ray intensity is expected to scale with the amount of dust, at least a factor of 3.4 (and more probably 8) more dust is required to account for the X-ray intensity observed by BeppoSAX, assuming the dust size distribution and solar X-ray flux remain the same. The dust production rate before the outburst is estimated to be kg s-1 and the ratio of dust to gas production 3 (Rauer, Arpigny, & Boehnhardt 1997). The estimated dust production rate during the outburst is at least 3 105 kg s-1, an increase by a factor of 7 compared to before the outburst, sufficient to account for the observed X-ray flux with the attogram dust model. We cannot directly measure the corresponding change in the amount of gas surrounding the comet. However during previous outbursts the gas production rate increased by a factor of only 1–3 depending on the species (Weaver et al. 1997). Since the shell in Fig. 4 is thickening and expanding with time, its density is expected to vary as v-3, rather than v-2 expected for a shell of constant thickness. Thus, assuming constant gas and dust velocities and spherical outflow, the gas density will decrease 200 times more rapidly than the dust, purely due to its higher expansion velocity.
By the start of the EUVE observation the dust density had decreased to a maximum of twice its quiescent level and the cloud had a size of 2′ or 3 105 km. By the end of the EUVE observation, the cloud filled most of the aperture providing an explanation for the source of extended emission reported in Mumma et al. (1997). The bulk of the dust outburst occurred towards the North and North-West of the nucleus. It is interesting to note that the majority of the X-rays observed by EUVE also originated to the North of the nucleus (see Fig. 1 of Krasnopolsky et al. 1997a). The reason that EUVE observed a lower flux than BeppoSAX is probably a combination of the continuation of the decay of the X-ray flux shown in Fig. 2 and poorer signal-to-noise caused by the spread of the signal over a much larger area of sky. In the absence of a more convincing explanation, we attribute this decay to dust fragmentation to sizes which are increasingly inefficient in producing X-rays.
Based on the following arguments we conclude that the observed X-rays are most likely produced in dust rather than gas. (1) the increase of dust produced during the outburst can explain the X-ray flux measured by the LECS, (2) sub-micron grain sizes have been observed in the coma of Hale-Bopp (Williams et al. 1997), (3) the measured spectrum is inconsistent with that predicted by gaseous models but consistent with that predicted by the attogram dust model, (4) the spatial distribution of X-rays measured by EUVE is similar to that of the dust from the outburst, and (5) X-rays were not observed from comet Bradfield 1979X - a highly gaseous but the least dusty comet observed (Hudson et al. 1981).
COMETARY X-RAY EMISSION MODELS
| Emission Mechanism | Ref. | |
|---|---|---|
| Ionization by solar wind protons | 10-6 | 1 |
| Current sheets in the solar wind | 10-6 | 2 |
| High velocity dust-dust collisions | 10-5 | 1 |
| X-ray scattering in coma | 10-3 | 1 |
| Solar X-ray fluorescence | 10-3 | 1 |
| Bremsstrahlung from cometary electrons | 10-2 | 3 |
| accelerated by plasma turbulence | ||
| Charge exchange of heavy solar wind ions | 1 | 4 |
| with neutral cometary molecules | ||
| Solar X-ray scattering, fluorescence and | 2 | 1 |
| bremsstrahlung in attogram dust particles |
References
- (1) A′Hearn, M. F., Millis, R. L., Schleicher, D. G., Osip, D. J., Berch, P. V. 1995, Icarus, 118, 223
- (2) Bingham, R., Dawson, J. M., Shapiro V. D., Mendis, D. A., Kellett, B. J. 1997, Science, 275, 49
- (3) Biver, N., et al. 1997, Science, 275, 1915
- (4) Boella, G., Butler, R. C., Perola, G. C., Piro, L., Scarsi, L., Bleeker, J. A. M. 1997a, A&AS, 122, 299
- (5) Boella, G., et al. 1997b, A&AS, 122, 327
- (6) Bowyer, S., & Malina, R. F. 1989, in Extreme Ultraviolet Astronomy, ed. R. F. Malina & S. Bowyer, Pergamon press, New York, 397
- (7) Brandt, J. C., Lisse, C., & Yi, Y. 1997, BAAS, 189, 25.05
- (8) Cravens, T. E. 1997, Geophys. Res. Lett., 24, 105
- (9) Dennerl, K., Englhauser, J., & Trümper, J. 1996a, IAU Circ., 6495
- (10) Dennerl, K., Englhauser, J., & Trümper, J. 1996b, IAU Circ., 6404
- (11) Häberli, R. M., Gombosi, T. I., de Zeeuw, D. L., Combi, M. R., Powell, K. G. 1997, Science, 276, 939
- (12) Hale, A., & Bopp, T. 1996, IAU Circ., 6187
- (13) Hasinger, G., Burg, R., Giacconi, R., Hartner, G., Schmidt, M., Trümper, J., Zamorani, G. 1993, A&A, 275, 1
- (14) Hudson, H. S., Ip, W. H., Mendis, D. A. 1981, Planet. Space Sci., 29, 1373
- (15) Ibadov, S. 1990, Icarus, 86, 283
- (16) Kellett, B., Negoro, H., Nagase, F., Bingham, R., Dawson, J. M., Mendis, D. A., Shapiro, V. D. 1997, preprint
- (17) Kidger, M. R., Serra-Ricart, M., Denicolo, G., Torres-Chico, R., Bellot-Rubio, L. R., Casas, R., Gómez, A., Licandro, J. 1996, ApJ submitted
- (18) Krasnopolsky, V. 1997, Icarus, submitted
- (19) Krasnopolsky, V. A., et al. 1997a, Science, 277, 1488
- (20) Krasnopolsky, V. A., et al. 1997b, Annales Geophysicae, 15, supp. III, C802
- (21) Lisse, C. M., et al. 1996, Science, 274, 205
- (22) Mumma, M., Krasnopolsky, V. A., Abbott, M., Flynn, B. C., Yeomans, D. K., Feldman, P. D., Cosmovici, C. B. 1997, IAU Circ., 6625
- (23) Owens, A., Oosterbroek, T., Orr, A., Parmar, A. N., Antonelli, L. A., Fiore, F., Maccarone, M. C., Piro, L. 1997, IAU Circ., 6614
- (24) Parmar, A. N., et al. 1997, A&AS, 122, 309
- (25) Rauer, H., Arpigny, C., & Boehnhardt, H. 1997, Science, 275, 1909
- (26) Schulz, R. 1991, in Proc. 3rd ESO/ST-ECF Data Analysis Workshop, ed. P. J. Grossbol & R. H. Warmels (Garching: ESO), 73
- (27) Snowden, S. L., et al. 1995, ApJ, 454, 643
- (28) Utterback, N. G., & Kissel, J. 1990, AJ, 100, 1315
- (29) Voges, W., et al. 1996, A&A, submitted
- (30) Weaver, H. A., et al. 1997, Science, 275, 1900
- (31) Wickramasinghe, N. C., & Hoyle, F. 1996, Ap. Space Sci., 239, 121
- (32) Williams, D. M., et al. 1997, ApJ, 489, L91
- (33)