Abstract
We summarize recent work on the structure and dynamics of the Galactic bar and inner disk. Current work focusses on constructing a quantitative model which integrates NIR photometry, source count observations, gas kinematics, stellar dynamical observations, and microlensing. Some avenues for future research are discussed.
1 Introduction
There is substantial, and still growing, evidence for a bar in the inner Galaxy. This includes the NIR light distribution, various source counts, the atomic and molecular gas morphology and kinematics, and probably the large optical depth to microlensing. See Gerhard (1996) and Kuijken (1996) for recent reviews.
The existence of a rotating bar in the inner of the Milky Way is therefore no longer controversial. This is an important development in that it changes the way in which we have to think about the Galaxy’s evolutionary history.
The emphasis of recent work has shifted towards determining parameters like the orientation, size, and pattern speed of the bar, and towards constructing a unifying quantitative model, within which the various observational results can be coherently explained, and which predicts the dynamical state of the Galactic bulge and inner disk. The purpose of this Joint Discussion Session is to present current work towards this goal, and to discuss the necessary next steps for arriving at such a model.
To make further progress, we must answer several questions. What are the detailed shape, orientation, length, and pattern speed of the bar? Should a distinction be made between the barred bulge and the bar in the disk, between components of different age and metallicity? Do the NIR light, clump giants and IRAS sources trace the same component? What is the mass distribution? Can we understand the kinematics of the Galactic centre gas and the arm? Can we predict the locations of the Galactic spiral arms? How does the large microlensing optical depth fit in? Do dynamical models predict the observed stellar kinematics in Baade’s window and the correct microlensing duration distribution? Many of these questions might be answered in the next year or two.
2 Photometric structure (Ortwin Gerhard)
The currently best models for the distribution of old stars in the inner Galaxy are based on the COBE/DIRBE NIR data. The COBE data have complete sky coverage, and broad-band emission maps are available over a large wavelength range from the NIR to the FIR. These aspects outweigh the disadvantages of this dataset: the relatively low spatial resolution, the residual effects of dust absorption, and the fact that it contains no distance information. Because extinction is important towards the Galactic nuclear bulge even at m, the first task is to correct (or ‘clean’) the DIRBE data for the effects of extinction. Arendt et al. (1994) did this by assuming that the dust lies in a foreground screen, while Spergel, Malhotra & Blitz (1997) and recently Freudenreich (1997) used a fully three-dimensional model of the dust distribution.
Dwek et al (1995) were the first to model the inner Galaxy’s NIR emissivity by matching parametric models to the cleaned data of Arendt et al. Recently, Binney, Gerhard & Spergel (1997, BGS) used a Richardson–Lucy algorithm to fit a non-parametric model of to the cleaned data of Spergel et al. This algorithm has built in the assumption of eight-fold (triaxial) symmetry with respect to three mutually orthogonal planes of arbitrary orientation with respect to the Sun–Galactic centre line. It exploits the fact that for such triaxially symmetric bars the perspective effects from the location of the Sun contain information about the bar’s shape and orientation (Blitz & Spergel 1991). When the orientation of the symmetry planes is fixed, the recovered emissivity appears to be essentially unique (Binney & Gerhard 1996, Bissantz et al. 1997), but physical models for the COBE bar can be found for a range of bar orientation angles, (BGS). measures the angle in the Galactic plane between the bar’s major axis at and the Sun–centre line. Zhao (1997b) has given an illustration of this non–uniqueness in terms of the even part of the bulge density distribution (see Fig. 4 below).
Fig. 1 shows the resulting deprojected luminosity distribution for . This shows an elongated bulge with axis ratios 10:6:4 and semi–major axis , surrounded by an elliptical disk that extends to on the major axis and on the minor axis. There is a maximum in the NIR emissivity down the minor axis, which is probably due to incorrectly deprojected strong spiral arms (see below), and which corresponds to the ring–like structure discussed by Kent, Dame & Fazio (1991). We favour the model because the dynamics of the large gas velocities in the Galactic centre (Binney et al. 1991) and the distribution of clump giants in the OGLE fields (Stanek et al. 1997) point towards a near–end–on bar.


The largest point-source catalogue used for analysing the structure of the Galactic bulge is that of the clump giant stars identified in the OGLE colour-magitude diagrams (Stanek et al. 1997). These stars have a small intrinsic luminosity spread ( mag); thus their apparent-magnitude distributions contain significant distance information. They are visible throughout the inner Galaxy, and reddening corrections can be made. The drawback of the present samples is that only a small number of lines–of–sight have been observed. Stanek et al. (1997) fitted a number of parametric models from Dwek et al. (1995) to their data. Their best bulge model is one with an exponential density distribution, axial ratios 10:4:3, and a bar angle of . This model does not have a disk component, whereas the COBE data imply that the foreground disk contains of the light even in Baade’s window. The Stanek et al. model must thus approximate the bulge and disk luminosities along the 12 fitted lines–of–sight. Because the number of lines–of–sight is small, and the fitted density models contain only few parameters, systematic errors in the derived parameter values are likely.
Nikolaev & Weinberg (1997) have reanalyzed the IRAS variable population. This sample has a large spatial coverage near the plane and distance information from the known range of AGB star luminosities, but suffers from selection effects and incompleteness. Reconstructing the density with a likelihood approach from about 5500 stars that satisfied their selection criteria, Nikolaev & Weinberg (1997) find a barred distribution (again, including the disk bar) with length , axial ratio in the plane 10:4, and orientation .
While this combined work shows that the bar angle is probably close to , there is less agreement in the axis ratios of the bar. The work of BGS shows that the disk contribution in the central few is large. A simple bulge–disk decomposition will not be possible. Clearly then, the next step is to combine the area coverage of the COBE data with the distance information in the clump giant samples, and perhaps later add the IRAS source population, in a non-parametric approach. Work along these lines has begun. This may constrain the shape parameters and the orientation of the bar much more tightly if all works out, or it may tell us that different tracers of the Galactic bulge and inner disk represent components with different spatial distributions. Both would be interesting.
3 Gas dynamics (Ortwin Gerhard)
It has long been suspected that the non–circular and forbidden velocities in the HI and CO –diagrams are caused by a non–axisymmetric component of the gravitational potential in the inner Galaxy (for references see Gerhard 1996). With quantitative models of the old stellar mass distribution now becoming available, we can make detailed models of the Galactic gas flow, and ask whether prominent structures in the observed –diagrams such as the arm, the ring, the Galactic centre parallelogram, etc, can be obtained.
In a first attempt Englmaier & Gerhard (1997) have used the luminosity distribution derived by BGS from the cleaned COBE L–band data of Spergel et al. (1997) for various . With the assumption that the NIR light traces mass, i.e., constant , models for the mass distribution and gravitational potential of the inner Galaxy were constructed. The main uncertainties in these models concern the inner disk, because the details of the in–plane dust distribution are uncertain, and because the Richardson–Lucy deprojection algorithm is unable to reliably deproject spiral arms (BGS).
In the resulting gravitational potentials, quasi–equilibrium gas flow models were computed, using an effective 20000 SPH particles in two dimensions, and assuming point symmetry with respect to the Galactic centre. The most important parameter to be determined is the pattern speed; this is restricted by the requirement that the arm must lie inside corotation and the ring (actually, a pair of spiral arms) at or beyond corotation. The best current models have for a pattern speed .
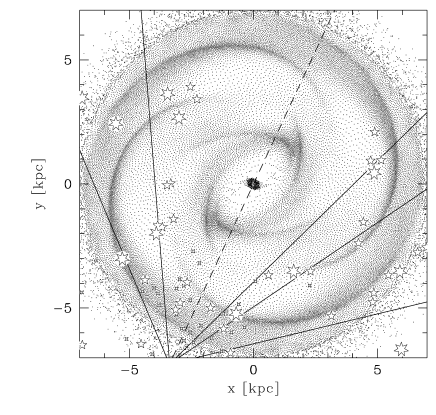
These models clearly show a four–armed spiral structure outside corotation, as indicated by observations (Vallée 1995). They also show that the luminosity concentrations along the bar’s minor axis at central distance must be at least partially real; removing these from the mass model results in an unstructured gas disk outside , rather unlike observations. Most likely, these concentrations represent the NIR light from stellar spiral arms near–coincident with the gas arms. Inside corotation the arm is one of the arms emanating from the nearby end of the bar. The transition between and orbit flow in these models is highly dynamical; thus in these models, the molecular parallelogram is non–stationary and not well–resolved.
The current best model includes a dark component with asympototic circular velocity . With a galactocentric solar radius of , a bar angle and corotation radius of and , this does a rather good job at reproducing the observed spiral arm tangents as seen from the Sun (Fig. 2). The bar angle is not very well–constrained; is equally possible. From fitting grid–based hydrodynamic models in analytic Galaxy potentials to the low–column density contours in the HI –diagram, Weiner & Sellwood (1997) favour bar angles around . The low–density regions are not well–resolved in the SPH models, so no direct comparison is currently possible.
Fux (1997) has computed a large number of combined N-body and SPH models from a grid of initial conditions, and has fitted these to the COBE NIR surface brightness contours and the observed –diagrams. These models appear to be similar to those of Englmaier & Gerhard (1997) in several respects; they too reproduce a number of features in the observed gas morphology and kinematics. While they cannot be exactly made–to–measure, they include effects from asymmetries (well–known to be of some importance in the Galactic centre molecular gas) and are not necessarily stationary.
With this recent work we may be close to understanding the gross structure of the inner Galactic gas flow. Comparing the results from the two approaches, ab–initio versus model–inferred–from–observations, and comparing results obtained with different hydrodynamical techniques, will be particularly helpful in isolating the model–independent results.

4 Dynamical Models of the Galactic Bulge (James Binney)
While the inner Galaxy is now generally agreed to be barred, the orientation, length and pattern speed of this bar remain controversial. Since dynamics must connect these parameters, the obvious next step is to upgrade photometric models of the inner Galaxy to fully dynamical models.
We believe that the photometric model of BGS is the best available because (i) it is based on COBE/DIRBE data cleaned with a fully three-dimensional model of the dust distribution, and (ii) because their non-parametric technique fits the cleaned data more exactly than does the previous parametric approach of Dwek et al. (1995). Zhao (1996) matched a dynamical model to the photometric model of Dwek et al. In Oxford we have used an extended version of the fitting technique introduced by Zhao to do the same thing for the photometric model of BGS. This work is still in progress (Häfner et al. in preparation) so we show only a few preliminary results, concentrating on our methodological innovations.
Like Zhao we start by choosing a pattern speed and use an enhanced version of Schwarzschild’s technique. Hence, we calculate orbits in an assumed potential and then populate them so that the sum of the densities contributed by every orbit in our orbit library reproduces the originally assumed density distribution.
Schwarzschild was primarily concerned with the case in which all relevant orbits are regular – that is, have three effective isolating integrals. Much of the phase space of a rapidly rotating bar is not occupied by such orbits, but by stochastic orbits. Stochastic orbits are liable to evolve on long timescales. Consequently, they can be included in the orbit library only after they have been followed for a Hubble time. When they are followed for so long, one finds that all stochastic orbits of a given energy closely resemble one another. This being so one can eliminate stochastic orbits from the library completely if one (a) includes for each energy a ‘composite orbit’ and (b) permits the weights of regular orbits to become negative in certain cases.
The concept of a composite orbit was introduced by Zhao (1996). It is the phase-space distribution that is produced by a distribution function that is a -function in the Hamiltonian . A stochastic orbit is formed by subtracting from the composite orbit of the same energy appropriate amounts of every regular orbit of that energy. Hence we can replace stochastic orbits with composite orbits provided we permit the weights of regular orbits to be negative. The only snag is that we must not permit these weights to be so negative that the overall phase-space density becomes negative anywhere in phase space.
While Zhao replaced stochastic orbits with composite orbits, he did not allow weights to be negative because he had no way of determining the overall phase-space density . Our technique for determining is as follows. We choose a sampling density that we believe lies close to the final phase-space density in regular regions of phase space. is normalized such that its integral throughout phase space evaluates to unity. Then each orbit in the library is launched from the phase-space volume with probability , and, as the orbit is integrated, we evaluate the time average of along the orbit. If a given orbit is subsequently assigned weight , one may show that along this orbit the final phase-space density in the model is , where is the weight assigned to the composite orbit of the same energy.
We used Liapunov exponents to select regular orbits from initial conditions in the potential that one obtains by assigning some mass-to-light ratio to the photometric model of Binney et al. A Richardson–Lucy algorithm was then used to assign weights to both these orbits and 2000 composite orbits.
As we saw above, the BGS photometric model contains structures at pc that are probably incorrectly deprojected spiral arms. We would not expect to be able to reproduce such structures with the present technique. Therefore in Fig. 3 we compare the projection from pc upwards for (a) our final dynamical model (full contours) and (b) the BGS photometric model (dashed contours). While the two contour sets resemble each other in many respects, they do not agree precisely. This disagreement is not unexpected because the original mapping from the COBE data to a photometric model is surely not unique and one does not expect to be able to model an arbitrary density distribution dynamically. Therefore our next step will be to calculate orbits in the potential of our dynamical model and to populate them so as to optimally reproduce the COBE brightness distribution on the sky. We anticipate obtaining a good fit, which we shall be able to improve by calculating orbits in the potential of the new dynamical model and again fitting to the COBE data.
5 Microlenses towards the Galactic Bulge/Bar (HongSheng Zhao)
Galactic microlensing started out as a unique technique of detecting the Galactic dark matter when in the form of compact baryonic dark objects (such as brown dwarfs in the Galactic disc, and Machos in the Galactic halo) by obtaining light curves of of stars towards the LMC/SMC and the Galactic bulge and searching for occasional transient gravitational amplification of light by these dark objects (see review of Paczyński 1996). While more than 200 microlenses towards the bulge and about a dozen towards the LMC have been detected so far (Udalski et al. 1994, Alcock et al. 1997a,b), it is still unclear whether they are the baryonic dark matter which we have been searching for or simply ordinary faint, low-mass stars. Towards the LMC, some non-conventional models predict that the Magellanic Clouds are shrouded with a common faint stellar halo created by tidal interaction of the binary in their recent close encounter and these stellar tidal debris in the near/far side can significantly microlens or be microlensed by stars in the LMC (Zhao 1997a and references therein) with an optical depth comparable to the observed value of (Alcock et al. 1997b). These predictions need to be tested observationally before one can draw conclusions of any Machos in the halo, and the ratio of baryonic to non-baryonic dark matter. Towards the Galactic bulge/bar, microlensing by low-mass stars in the near side of the bar is expected to dominate the lenses in the disc (Zhao, Spergel & Rich 1995), and brown dwarfs should not make up most of the mass in the bar and the disc (Zhao, Rich & Spergel 1996). However, as I will point out, previous models which try to bring together the microlensing data with the COBE/DIRBE maps of the bar still suffer two serious problems.
First, we have seen that the 3D distribution of the bar cannot be uniquely recovered from the COBE/DIRBE maps (BGS, Zhao 1997b). Moreover, with Schwarzschild’s method one can probably generate photometrically acceptable and dynamically consistent bars with a range of different pattern speeds and streaming-velocity fields. Consequently, the potential of the bar and the velocity distribution of stars in the bar will be non-unique (cf Fig. 4). This non-uniqueness propagates to the predicted lens masses because , where and are the proper motion and distance of the lens, and and are that of the source. For the same data of the event duration distribution, the predicted lens masses could differ in some cases by as much as a factor of 2 in different models of the bar (Zhao & de Zeeuw 1997). This renders it meaningless to derive details of the mass spectrum using lensing data without first lifting the degeneracy in the dynamical models.
Second, current theoretical models of the bar and the disc cannot fully account for the very high optical depth observed towards the bulge. As shown in Zhao & Mao (1996), even when the geometry of the bar is artificially tailored to enhance microlensing (cf. Fig. 4), the maximum optical depth is still lower than the observed by at least . More physical bar models that fit either the star-count data for bulge red clump giants (Stanek et al. 1997) or the COBE/DIRBE infrared surface-brightness distribution (Bissantz et al. 1997), yield , which is about smaller than the value determined from observations of bulge red-clump giants (Alcock et al. 1997a) .
While there is every prospect of breaking the degeneracy in the first problem by integrating microlensing data with star-count data for bulge red-clump giants and data for the gas/stellar kinematics, the implied extra lenses of the second problem are puzzling. Models that go beyond the standard COBE bar-plus-disc model would seem inevitable if the high optical depth derived by the experimental teams holds up over the next years as the number of microlensing events increases and our understanding of the experimental efficiency improves.
References
- Alcock et al. 1997a, ApJ, 479, 119
- Alcock et al. 1997b, ApJ, 486, 697
- Arendt R.G., et al. 1994, ApJ, 425, L85
- Binney J.J., Gerhard O.E., 1996, MNRAS, 279, 1005
- Binney J.J., Gerhard O.E., Spergel D.N., 1997, MNRAS, 288, 365 (BGS)
- Binney J.J., Gerhard O.E., Stark A.A., Bally J., Uchida K.I., 1991, MNRAS, 252, 210
- Bissantz N., Englmaier P., Binney J.J., Gerhard O.E., 1997, MNRAS, 289, 651
- Blitz L., Spergel, D., 1991, ApJ, 379, 631
- Dwek E., et al. 1995, ApJ, 445, 716
- Englmaier P., Gerhard O.E., 1997, in preparation.
- Freudenreich H.T., 1997, preprint (astro-ph/9707340).
- Fux R., 1997, in preparation.
- Georgelin Y.M., Georgelin Y.P., 1976, A&A, 49, 57
- Gerhard O.E., 1996, in: Unsolved Problems of the Milky Way, IAU Symp. 169, eds. L. Blitz, P. Teuben, Kluwer, Dordrecht, 79.
- Kent S.M., Dame T.M., Fazio G., 1991, ApJ, 378, 131
- Kuijken K., 1996, in: Barred Galaxies, IAU Coll. 157, eds. R. Buta, D.A. Crocker, B. G. Elmegreen, ASP, San Francisco, 504.
- Nikolaev S., Weinberg M.D., 1997, preprint (astro-ph/9701060)
- Paczyński B. 1996, ARAA, 34, in press
- Spergel D.N., Malhotra S., Blitz L., 1997, in preparation
- Stanek K.Z., et al. 1997, ApJ, 477, 163
- Udalski A., et al. 1994, AcA, 44, 165
- Vallée J.P., 1995, ApJ, 454, 119
- Weiner B., Sellwood J.A., 1997, in preparation.
- Zhao H.S., 1996, MNRAS, 283, 149
- Zhao H.S., 1997a, MNRAS, accepted
- Zhao H.S., 1997b, MNRAS, submitted
- Zhao H.S., de Zeeuw P.T., 1997, MNRAS, submitted
- Zhao H.S., Mao S., 1996, MNRAS, 283, 1197
- Zhao H.S., Rich R.M., Spergel D.N., 1996, MNRAS, 282, 175
- Zhao H.S., Spergel D.N., Rich R.M., 1995, ApJ, 440, L13