The STIS Parallel Survey: Introduction and First Results111 Based on observations made with the NASA/ESA Hubble Space Telescope, obtained from the data archive at the Space Telescope Science Institute, which is operated by the Association of Universities for Research in Astronomy, Inc., under NASA contract NAS 5-26555..
Abstract
The installation of the Space Telescope Imaging Spectrograph (STIS) on the Hubble Space Telescope (HST) allows for the first time two-dimensional optical and ultraviolet slitless spectroscopy of faint objects from space. The STIS Parallel Survey (SPS) routinely obtains broad band images and slitless spectra of random fields in parallel with HST observations using other instruments. The SPS is designed to study a wide variety of astrophysical phenomena, including the rate of star formation in galaxies at intermediate to high redshift through the detection of emission-line galaxies. We present the first results of the SPS, which demonstrate the capability of STIS slitless spectroscopy to detect and identify high-redshift galaxies.
Accepted for publication in the ApJ Letters HST Second Servicing Mission special issue
1 Introduction
The low sky background seen by the Hubble Space Telescope (HST), and the two-dimensional capability of the Space Telescope Imaging Spectrograph (STIS; Kimble et al. 1997) enables a survey of faint spectroscopically selected objects for the first time. The STIS Parallel Survey (SPS) uses slitless spectroscopy of random fields to identify and study objects selected by their spectroscopic properties. STIS slitless spectra provide unprecedented sensitivity in the range Å, where ground based spectroscopy is difficult due to the variability of the night-sky lines. SPS observations include, as a fiducial for the spectra, unfiltered images of each field, utilising between 1/6 and 1/4 of the exposure time. The goals of the SPS include studying the evolution of the star formation rate with redshift as measured by emission-line strengths, the evolution of the luminosity function of galaxies, the size and morphological evolution of galaxies with redshift, the study of active galactic nuclei (AGN), weak gravitational lensing, stellar luminosity functions in nearby galaxies, low-mass stars and Kuiper Belt objects. The images will be used to construct magnitude-limited samples and to identify the morphological types of the galaxies in the spectroscopically selected samples. SPS data are also a valuable source of calibration information for the STIS CCD detector.
The SPS is being conducted as a service to the astronomical community by the Space Telescope Science Institute (STScI), and the data are made available immediately through the archive. Further information is available on the world wide web at the STIS Investigation Definition Team (IDT) parallel page, http://hires.gsfc.nasa.gov/stis/parallels/parallels.html, the STScI parallel page, http://www.stsci.edu/ftp/instrument_news/STIS/parallel/parallelstis.html, and the Space Telescope – European Coordinating Facility parallel page, http://ecf.hq.eso.org/parallel. In this Letter we describe the survey data, demonstrate the capabilities of random-field slitless spectroscopy with STIS, and show results from some of the first fields to be observed, with an emphasis on star formation at high redshift.
The observational study of galaxy evolution is the study of star formation as a function of lookback time. Determining the star-formation history of the universe, its variation with galaxy morphological type, and its relationship to spectral type and color, places strong constraints on theoretical models. Ground-based imaging and redshift surveys, in combination with the HST Medium Deep Survey key project (MDS; Griffiths et al. 1994), and the Hubble Deep Field (HDF; Williams et al. 1996), have built up a consistent picture of evolution in which the population of early-type galaxies have undergone little star-formation at redshift (Lilly et al. 1995), while a population of morphologically complex and active star-forming galaxies were numerous at (Cowie, Songaila & Hu 1991; Glazebrook et al. 1995; Driver, Windhorst & Griffiths 1995), but have disappeared by the present epoch. Star-forming galaxies has recently been discovered at (Steidel et al. 1996), but the relatively small number of “UV-dropout” galaxies in the HDF indicates that the bulk of star formation takes place at (Madau et al. 1996). Although there is still considerable debate about this picture, it is clear that the poorly studied redshift range is of considerable importance.
Galaxy formation may not be a dramatic process, but might be a slow and steady accumulation of hierarchical merging and constant star formation (Cole et al. 1994). Lanzetta, Yahil & Fernandez-Soto (1996) argue that many of the galaxies in the HDF are at , and Cowie et al. (1988) and Gardner (1995) argue on the basis of surface brightness considerations that the star-formation which produced the locally-observed metals occurred in galaxies already detected in the deep photometric surveys. While the small scatter in the color of cluster elliptical galaxies has normally been taken to mean a common epoch of formation, and thus an old age, recent theoretical work has managed to reproduce this observation with a hierarchical merging model (Baugh et al. 1996). In such a picture, the redshift range of greatest interest might be rather than higher redshifts. SPS observations are sensitive to H emission at , [O iii] emission at , [O ii] emission at and Ly emission at .
While searches for Ly emission from forming galaxies have for the most part been unsuccessful (for a review see Pritchet 1994), there are several reasons the SPS might be at an advantage. Primeval galaxies may not emit much Ly, due to partial obscuration by dust, although Pritchet (1994) calculates that of primeval galaxies should be visible in Ly, a percentage which is roughly consistent with the observations of Steidel et al. (1996). Primeval galaxies may be large, low surface-brightness objects, but the high resolution of the HST may be able to detect individual regions of star-formation (i.e. H ii regions) within a larger low-surface brightness galaxy, Dalcanton & Schectman (1996). It is also possible that biasing, or strong clustering of galaxies makes individual pencil-beam surveys of random fields a hit-or-miss proposition.
2 The SPS Data
The STIS Parallel Survey began on 1997 June 2. The HST instruments are distributed around the focal plane of the Optical Telescope Assembly (OTA) and a primary instrument aperture is selected by offsetting the pointing of the OTA from the optical axis. The remaining instruments then view a random field in the sky between 5 and 8 arcminutes away from the primary object. Prior to the installation of STIS and the Near Infrared Camera and Multi-Object Spectrometer (NICMOS) during the second servicing mission in 1997 February, parallel observations were only scientifically useful when taken with the Wide Field and Planetary Camera 2 (WFPC2). The MDS, along with the Guaranteed Time Observer’s parallel survey, has used the WFPC2 in parallel to study many aspects of cosmology and stellar populations, obtaining data in about 600 orbits per year. Now, with three cameras capable of making parallel observations, and the greater flexibility provided by the installation of a higher storage capacity Solid State Recorder, the opportunity for random field surveys has increased by a factor of 6 or more.
“Scripted” parallel observations, in which the choice of exposure times, filters and spectroscopic modes depends on the Galactic latitude or the available exposure time, will not be implemented for scheduling the STIS until late in 1997. The observations made to date have been in a “non-scripted” mode with two images, and two to spectroscopic exposures per orbit, repeated for multiple orbit pointings. The images are taken in the 50CCD clear camera mode, and are sensitive to Å wavelengths (see Baum et al. 1996). The spectral images use the G750L low resolution grating, with central wavelength 8975Å, and have spectra covering about 4000Å between 5500 and 11490Å, depending on the position of the objects on the field. The images are read out in a binned pixel mode while the spectra are binned by two pixels in the spatial direction only, resulting in pixels. SPS images taken after 1997 August, will be unbinned to make the data more suitable for weak lensing measurements, and other scientific programs. The central wavelength of the spectra will be changed to 7751Å to take greater advantage of the sensitivity of the CCD, which drops rapidly at wavelengths longer than 10000Å. At the time of writing, 7 weeks after the start of observations, 125 fields have been observed, with spectroscopic exposure times up to . Table 1 lists the longest exposures made to date, and the full list is available on the STIS IDT web page.
2.1 Data Reduction
The data reduction of SPS data has three main stages: (i) image reduction, including bias and dark subtraction, hot pixel correction and flat fielding; (ii) co-addition of images from multiple and dithered pointings; (iii) object detection and slitless spectrum extraction. We implement these procedures in the Interactive Data Language (IDL), except for the object detection, which is done using the SExtractor package (Bertin & Arnouts 1996).
If the prime observations are dithered, the parallel observations will also be dithered. Visits to the same prime target done at different times can result in offsets between parallel observations of the same field due to change in the roll angle of the spacecraft. The SPS data are put into groups within of each other ( of the size of the STIS CCD), and subgroups within of each other. The images in each subgroup are treated as co-pointed for the purpose of cosmic ray (CR) removal.
Cosmic rays (CRs) are removed using multiple exposures of the same fields. A one-dimensional bias is computed from the overscan portion of the detector and subtracted from the raw image. Two-dimensional bias and dark images are subtracted. Some pixels with high dark rates are not accounted for by the dark frame, since new “hot pixels” are continually generated by the CR flux on orbit, and periodically reduced by annealing. These pixels are tabulated weekly. The hot pixels corrected in the data reduction are the union of the latest list made before the given image and the earliest list made afterward. The correction is done by linear interpolation between neighboring pixels. The images are flat fielded using a median sky flat of the SPS images. Dithered data are co-registered, and the resulting images are co-added by a final step which rejects CRs and hot pixels using all the available data. The processing for slitless spectra is similar to what is described above, except that the dither offsets are computed from those found for the direct images, the spectra are not flat fielded, and a background determined by the median of each column is subtracted. No attempt is made to remove the fringing.
The program SExtractor (Bertin & Arnouts 1996) detects and separates sources on the processed images using a multi-thresholding algorithm. SExtractor subtracts a smoothed 2-dimensional background and convolves the image with a Gaussian filter before applying the initial detection threshold, which is of the empirical sky noise. The program computes location, photometry, and shape parameters for each detected source.
Slitless spectra are extracted as rectangular sub-images, which are resampled using bilinear interpolation to remove geometric distortion. An array of pixel offsets characterizing the distortion is maintained as part of the local calibration database. The first axis of the spectrum image is wavelength, with the zero point and dispersion determined from the object’s location in the camera mode image. The second axis is spatial position in the cross-dispersion direction, corrected for the orientation angle of the object. The rectified image is then summed in the cross-dispersion direction. In this Letter we used unweighted summation over a simple rectangular extraction slit. However, a scheme for weighted, or “optimal,” extraction has recently been implemented (Horne 1986). Optimal extraction increases the signal-to-noise ratio by weighting pixels by their contribution to the total signal, and helps in rejection of bad pixels.
Photometric calibration of the direct images was done independently by three of the authors (EMM, ET and JW) using STIS 50CCD observations of Centauri and the white dwarf, GRW+70D5824. The field in Centauri has been observed with WFPC2 by Holtzman et al. (1995) and from the ground by Harris et al. (1993), and the photometry was determined relative to those observations.
3 Discussion
A preliminary analysis of the SPS data has discovered 9 emission-line sources, ranging in redshift . Figure 1 shows the spectra, with the strongest lines marked. For each object, the extracted spectrum is shown, and the spectrum smoothed with a Gaussian filter three pixels wide is shown offset upwards for clarity. Table 2 contains additional information about the detected emission line objects. These objects all show two or more emission lines; in addition the data contain several single emission-line objects which will require additional observations to confirm their redshifts. These objects could be at if the single emission line is [O ii] at rest wavelength 3727Å.
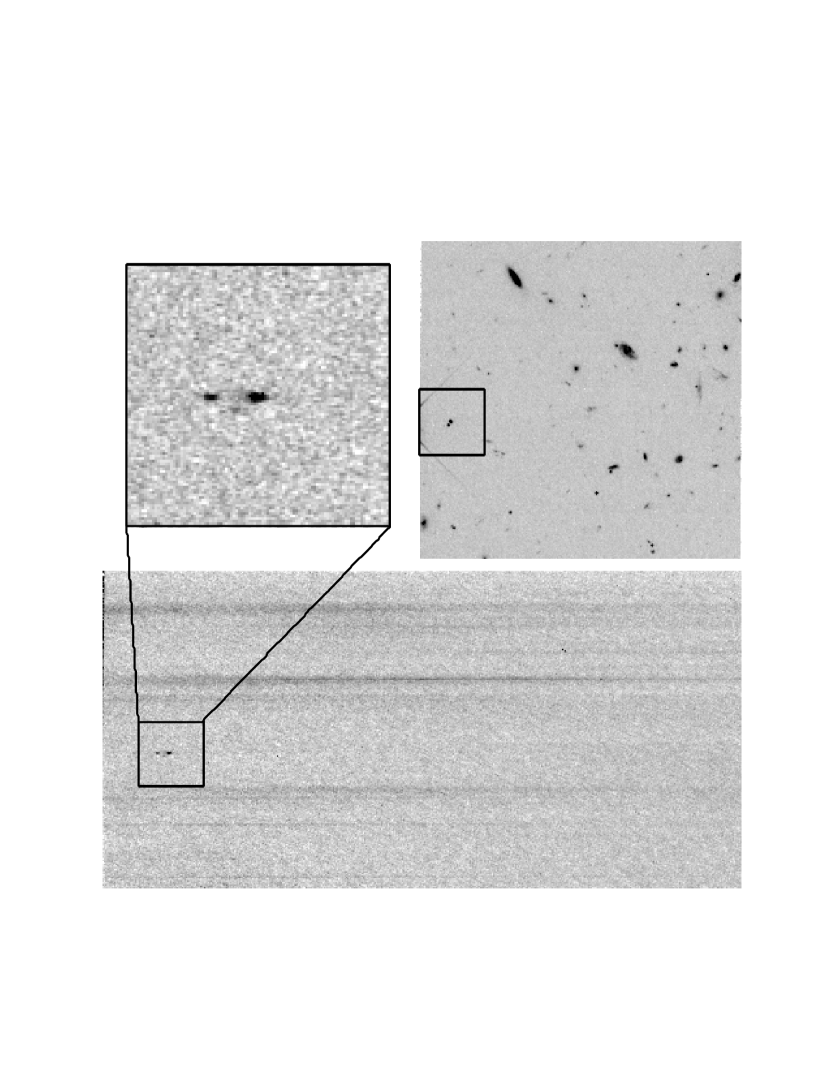
SPS1514+3632#008 is our strongest detection, and the spectrum is plotted at the top of Figure 1. The [O iii] doublet is clearly seen at 9018Å and 8935Å, indicating a redshift of 0.801. The H line is also seen at the same redshift. As a demonstration of slitless spectroscopy with STIS, we show this field in Figure 2, Plate 1. At the top right is the image, with a total exposure of 2100 seconds, and a limiting detection magnitude ( in a 0.5 arcsecond aperture) of AB = 28.0 mag. The bottom of the figure is the slitless spectral image, with a total exposure time of . At the top left of the figure we show an expanded view of the spectral image in the region around the detected emission lines. The object could be part of an interacting pair, and both members of the pair are visible in the stronger [O iii] line at 5007Å.
4 Summary
The STIS Parallel Survey is designed to address a wide variety of topics in astronomy, including the discovery and study of emission line objects at redshift . The STIS provides unprecedented sensitivity in the wavelength range Å due to the low and constant sky background relative to observations made from the ground. In the first seven weeks of operation, the SPS has obtained images and slitless spectra of 125 fields. We have analyzed nine fields at high Galactic latitude with spectroscopic exposure times of or more. We find nine emission-line objects with . While it is still too early for a statistical analysis of the data, it is clear that this survey will contribute to our understanding of star formation at one half the Hubble time.
We wish to acknowledge useful discussions with Ray Weymann, Thomas Erben, Mario Nonino, Michael Rosa and Benoit Pirenne, and support and help from the STIS Investigation Definition Team. We thank Karl Glazebrook for providing redshift identification software.
References
- (1) Baugh, C. M., Cole, S., & Frenk, C. S. 1996, MNRAS, 283, 1361
- (2) Baum, S. et al. 1996, “STIS Instrument Handbook”, Version 1.0, (Baltimore:STScI)
- (3) Bertin, E., & Arnouts, S. 1996, A&AS, 117, 393
- (4) Cole, S., Aragon-Salamanca, A., Frenk, C. S., Navarro, J. F., & Zepf, S. E. 1994, MNRAS, 271, 781
- (5) Cowie, L. L., Lilly, S. J., Gardner, J., & McLean, I. S. 1988, ApJ, 332, L29
- (6) Cowie, L. L., Songaila, A., & Hu, E. M. 1991, Nature, 354, 460
- (7) Dalcanton, J. J., & Schectman, S. A. 1996, ApJ, 465, L9
- (8) Driver, S. P., Windhorst, R. A., & Griffiths, R. E. 1995, ApJ, 453, 48
- (9) Gallego, J., Zamorano, J., Aragon-Salamanca, A., & Rego, M. 1995, ApJ, 455, L1
- (10) Gardner, J. P. 1995, ApJ, 452, 538
- (11) Glazebrook, K., Ellis, R., Santiago, B., & Griffiths, R. 1995, MNRAS, 275, L19
- (12) Griffiths, R. E., et al. 1994, ApJ, 435, L19
- (13) Harris, H. C., Hunter, D. A., Baum, W. A., & Jones, J. H. 1993, AJ, 105, 1196
- (14) Holtzman, J. A. et al. 1995, PASP, 107, 156
- (15) Horne, K. 1986, PASP, 98, 609
- (16) Kimble, R. A., et al. 1997, ApJ, this issue
- (17) Lanzetta, K. M., Yahil, A., & Fernandez-Soto, A. 1996, Nature, 381, 759
- (18) Lilly, S. J., Tresse, L., Hammer, F., Crampton, D., & Le Fevre, O. 1995, ApJ, 455, 108
- (19) Madau, P., Ferguson, H. C., Dickinson, M. E., Giavalisco, M., Steidel, C. C. & Fruchter, A. 1996, MNRAS, 283, 1388
- (20) Pritchet, C. J. 1994, PASP, 106, 1052
- (21) Steidel, C. C., Giavalisco, M., Pettini, M., Dickinson, M., & Adelberger, K. L. 1996, ApJ, 462, L17
- (22) Williams, R. E., et al. 1996, AJ, 112, 1335
- (23)
| Field | Rootname | Date | RA (2000) | Dec | Galactic b | Exp(image) | Exp(spect) | |
|---|---|---|---|---|---|---|---|---|
| SPS13120124 | O4141R020 | 22/06/97 | 13:11:45.06 | 01:24:05.1 | 61.05 | 2850 | 16800 | * |
| SPS1229+1245 | O41Q70HBM | 15/06/97 | 12:28:40.42 | +12:45:18.8 | 74.67 | 3300 | 13800 | * |
| SPS1550+2122b | O41Q19WSM | 10/06/97 | 15:49:35.19 | +21:21:43.7 | 49.19 | 2100 | 11400 | * |
| SPS1550+2122a | O41467020 | 05/06/97 | 15:49:37.17 | +21:21:46.5 | 49.18 | 1800 | 10800 | * |
| SPS0020+5922 | O41499020 | 08/06/97 | 00:19:58.94 | +59:21:34.0 | 3.27 | 1800 | 10800 | |
| SPS1150+1241 | O41406020 | 09/06/97 | 11:49:56.56 | +12:41:32.0 | 69.61 | 1500 | 9000 | |
| SPS05356918a | O41420020 | 10/07/97 | 05:34:35.97 | 69:17:43.2 | 32.01 | 1500 | 9000 | |
| SPS1514+3632 | O41Q24J2M | 16/06/97 | 15:14:21.02 | +36:31:34.5 | 58.43 | 2100 | 8400 | * |
| SPS0039+4924 | O41410020 | 09/06/97 | 00:38:44.24 | +48:23:33.1 | 14.43 | 1350 | 7800 | |
| SPS1025+4703 | O4141C020 | 29/06/97 | 10:25:17.00 | +47:02:40.9 | 55.18 | 1350 | 7800 | |
| SPS0039+4827 | O41492020 | 03/06/97 | 00:38:57.51 | +48:27:04.1 | 14.37 | 1200 | 7200 | |
| SPS13274737 | O41485020 | 04/06/97 | 13:26:35.85 | 47:36:42.2 | 14.84 | 1200 | 7200 | |
| SPS1150+1242 | O41474020 | 05/06/97 | 11:49:58.49 | +12:42:19.4 | 69.63 | 1200 | 7200 | * |
| SPS13274732 | O41428020 | 11/06/97 | 13:27:15.37 | 47:31:58.2 | 14.90 | 1200 | 7200 | |
| SPS1231+1214 | O42R05E3M | 14/07/97 | 12:31:03.69 | +12:14:26.2 | 74.36 | 1800 | 7200 | |
| SPS1418+5217 | O42R11H2M | 27/06/97 | 14:18:09.54 | +52:17:07.3 | 60.07 | 1500 | 6000 | * |
| SPS0134+3041 | O42R1YBPM | 11/07/97 | 01:34:10.67 | +30:40:38.2 | 31.30 | 1050 | 6000 | |
| SPS17415340 | O41482020 | 04/06/97 | 17:41:18.99 | 53:39:52.3 | 12.03 | 900 | 5400 | |
| SPS17415338 | O41479020 | 05/06/97 | 17:41:18.55 | 53:38:26.3 | 12.02 | 900 | 5400 | |
| SPS0040+4144 | O41460020 | 14/06/97 | 00:40:00.68 | +41:43:57.7 | 21.09 | 900 | 5400 | |
| SPS1418+5223 | O42R06EFM | 23/06/97 | 14:17:59.52 | +52:22:56.7 | 60.01 | 1350 | 5400 | * |
| SPS1257+0423 | O4140C020 | 30/06/97 | 12:57:14.98 | +04:23:11.2 | 67.22 | 900 | 5400 | * |
| SPS00472514 | O4141X020 | 09/07/97 | 00:47:19.69 | 25:13:30.8 | 87.89 | 900 | 5400 | |
| SPS05356918b | O4142H020 | 12/07/97 | 05:34:35.55 | 69:17:36.2 | 32.01 | 900 | 5400 |
Note. — Fields marked with a * are discussed in this paper. The rootname is the designation of the first exposure of the field in the STScI archive. Exposure times for the images and spectroscopy are in seconds.
| Object | RA (2000) | Dec | ABmag | z | lines |
|---|---|---|---|---|---|
| SPS1418+5223#002 | 14:18:00.69 | 52:22:39.3 | 20.45 | 0.278 | H, [S ii], [O i] |
| SPS13120124#004 | 13:11:45.60 | 02:35:35.1 | 20.44 | 0.383 | H, [O i] |
| SPS13120124#007 | 13:11:46.32 | 02:35:33.8 | 23.58 | 0.792 | [O iii], H |
| SPS1150+1242#005 | 11:49:58.99 | 12:42:42.8 | 22.56 | 0.787 | [O iii], H |
| SPS1514+3632#008 | 15:14:22.68 | 36:31:31.1 | 22.84 | 0.801 | [O iii], H |
| SPS1514+3632#007 | 15:14:19.72 | 36:31:25.3 | 22.75 | 0.371 | [O iii], H, [O i] |
| SPS1550+2122b#004 | 15:49:35.26 | 21:21:54.7 | 22.84 | 0.486 | [O iii], H, [O ii] |
| SPS1150+1242#007 | 11:49:58.41 | 12:41:55.7 | 22.75 | 0.130 | H, [S ii], [O i] |
| SPS1550+2122a#008 | 15:49:36.15 | 21:21:45.4 | 23.61 | 0.573 | [O iii], H, [O ii], H |