Can Baryonic Features Produce the Observed Mpc Clustering?
Abstract
We assess the possibility that baryonic acoustic oscillations in adiabatic models may explain the observations of excess power in large-scale structure on scales. The observed location restricts models to two extreme areas of parameter space. In either case, the baryon fraction must be large () to yield significant features. The first region requires to match the location, implying large blue tilts () to satisfy cluster abundance constraints. The power spectrum also continues to rise toward larger scales in these models. The second region requires , implying well out of the range of big bang nucleosynthesis constraints; moreover, the peak is noticeably wider than the observations suggest. Testable features of both solutions are that they require moderate reionization and thereby generate potentially observable K) large-angle polarization, as well as sub-arc-minute temperature fluctuations. In short, baryonic features in adiabatic models may explain the observed excess only if currently favored determinations of cosmological parameters are in substantial error or if present surveys do not represent a fair sample of structures.
and
1 Introduction
As the study of large-scale structure has pushed to ever larger scales, several data samples have suggested the presence of excess power confined in a narrow region around the scale. The first such claim was the pencil-beam redshift survey of [Broadhurst et al.] (1990), in which six concentrations of galaxies separated by a periodic spacing of were seen. Later work (e.g. [Bahcall] 1991; [Guzzo et al.] 1992; [Willmer et al.] 1994) has confirmed that these overdensities are indeed part of extended structures rather than small-scale anomalies, and new pencil beams show similar behavior ([Broadhurst et al.] 1995). More recently, the 2-dimensional power spectrum of the Las Campanas Redshift Survey ([Landy et al.] 1996, hereafter LCRS) and the 3-dimensional power spectrum of rich Abell clusters ([Einasto et al.] 1997 and references therein) reveal a narrow peak at similar scales, and respectively.
Other data sets show anomalies on these scales, although they are unable to resolve a narrow feature. Three-dimensional reconstructions based on the angular correlations in the APM survey ([Gaztanaga & Baugh] 1997) suggest a sharp drop in the power spectrum in this region. Finally, high-redshift C 4 absorption lines in quasar spectra were found to be correlated on scales ([Quashnock et al.] 1996); if this is due to large-scale structure, it indicates greater power than expected. Hence, several different lines of observational inquiry suggest excess power on scales, perhaps in the form of a narrow peak at wavenumbers .
Cosmological models based on collisionless dark matter (e.g. cold dark matter), when combined with power-law initial power spectra, produce smooth power spectra at late times. Such models therefore cannot match the feature described above. However, if baryons are present in significant quantities, the coupling between them and the cosmic microwave background photons at redshifts produces acoustic oscillations near the scale (see Eisenstein & Hu 1997, hereafter EH97, and references therein).
In this Letter, we consider whether acoustic features in adiabatic models can explain the narrow peak in the power spectrum at scales. This choice of location for a feature immediately restricts us to two rather extreme regions of parameter space. We examine each of these in turn, detailing their requirements and predictions.
Throughout this paper, is the total density of matter relative to the critical density; is that of the baryons. The power-law exponent of the initial power spectrum is denoted ( is scale-invariant). The Hubble constant is written as . We assume a cosmological constant to make the universe flat; an open universe would have a power spectrum of identical shape but with a less favorable normalization.
2 Constraints
A cosmological model with cold dark matter and baryons exhibits a power spectrum with a broad global maximum (hereafter, the peak) at small wavenumbers and a series of oscillations (hereafter, the bumps) at larger wavenumbers (c.f. Fig. 4). Therefore, one may either attempt to associate the peak or the first bump with the observed feature. This yields two disjoint areas of parameter space which we display in Figure 1 for two different values of . We will now discuss these two regions separately.

2.1 Low-Region
The region on the left in Figure 1 corresponds to placing the first bump in the region . The bump shifts to smaller scales (higher ) as increases, as reflected in the left-right limits. We take the bump location to be the position of corresponding maximum in the oscillatory piece of the transfer function ([EH97], eq. 25).
The lower bound on the baryon fraction comes from the requirement that the amplitude of the bump, as measured using the decomposition of [EH97], exceeds 20% in power. Smaller oscillations would not explain the observations. The upper bound on the baryon fraction comes from requiring the bump amplitude to be less than a factor of 1.6; presumably larger oscillations would have caused the second bump at to be detected ([Peacock & Dodds] 1994). Note that while lowering from 0.8 to 0.5 causes the allowed region to shift unfavorably to even lower , increasing to 1.0 only marginally relaxes the bound on .

Hence, one is restricted to a low value of , approximately less than . For , this does not drastically violate nucleosynthesis (e.g. [Tytler et al.] 1996). However, the moderate baryon fraction needed to produce the bumps also causes a significant suppression of power at . For a COBE-normalized ([Bunn & White] 1997) and scale-invariant initial spectrum (), the resulting values of the fluctuations on the cluster scale are less than 0.5. This is far smaller than the value ( for these ) needed to reproduce the abundance of galaxy clusters.
Adding a significant blue tilt () can increase enough to satisfy the cluster abundance constraint. We have taken the lowest value in the literature ([Eke et al.] 1996) to provide conservative lower bounds on . We display this situation in Figure 2. In general, larger amplitude features must be balanced by larger tilts. Note that adding a tensor contribution to COBE or removing the cosmological constant will decrease the power spectrum normalization and in turn require even higher tilts ([White & Silk] 1996).
Tilts of are difficult to realize in inflationary models ([Garcia-Bellido & Linde] 1997). Empirical constraints depend entirely upon the range in wavenumber used to define the tilt. The limited range of scales available to COBE DMR allows only a weak constraint (, ; [Gorski et al.] 1996). Combining COBE with degree-scale CMB observations () limits the tilt more severely. However both constraints may be relaxed if the universe were reionized moderately early. Blue tilts extending to smaller scales are constrained by arcminute-scale CMB observations (, ; [Vishniac] 1987), the absence of spectral distortions from dissipation of acoustic waves after thermalization (, ; [Hu et al.] 1994), and limits on primordial black holes (, ; [Green & Liddle] 1997). In summary, strong blue tilts that extend from COBE to the smallest observable scales are ruled out, but between COBE and cluster scales, the situation is less restrictive as the slope may decrease at smaller scales.
2.2 High-Region
The region on the right in Figure 1 corresponds to placing the peak at . Although the lower limit is well below the observational region , the peak in these models is sufficiently broad that the exact maximum need not lie directly on the preferred scale to yield an enhancement of power. Figure 1 assumes ; adding a blue tilt shifts the peak to higher , increasing the allowed region. The region for and is very similar to that shown for .

The peak is generically much broader than the bump. As the baryon fraction increases, the high- side of the peak steepens significantly, giving rise to a prominent and asymmetric feature. Two statistics characterizing the width of the peak for an model are shown in Figure 3. Here one sees that the full-width at half-maximum (FWHM) always exceeds 0.85 decades in for and 0.65 decades for . Similarly the range in over which the power spectrum drops from its peak to its half-maximum in the high- direction (positive HWHM) always exceeds 0.3 decades for and 0.25 decades for . Adding a blue tilt steepens the low- side of the peak, thereby decreasing the width.
Hence, even for large baryon fractions, the peak may be too broad when compared with the narrow feature observed in the cluster power spectrum, LCRS, or pencil-beams. However, the sharp break on the small-scale side of the maximum may be a sufficient departure from the usual low-baryon spectral shape as to allow these models to be statistically consistent with these observations. To reflect this situation, we place a lower limit on the baryon fraction in Figure 1 by requiring that the positive HWHM be less than 0.4 decades in (c.f. Fig. 3).
3 Discussion

In Figure 4, we show a representative example from each of the allowed regions and overlay them with observational data sets. The top two curves show an , , , model. The first bump is located near and contains significantly more power than a zero-baryon, model (dashed line). The first bump is prominent and well-matched to the [Einasto et al.] (1997) power spectrum; a similar model would fit the LCRS data. However, the peak at larger scales is yet higher, implying that power should continue to rise as we look toward larger scales. This is a generic feature of this region of parameter space—avoided only by enormous blue tilts ()—and may well be incompatible with the turnover in the power spectrum suggested by the APM survey ([Baugh & Efstathiou] 1993; [Gaztanaga & Baugh] 1997). Non-linearities would likely help to wash out the series of bumps at smaller scales ().
The bottom two curves show an , , , model. Again, the model has excess power on scales relative to a model. Because of the high baryon fraction, this model does in fact produce the needed to match the cluster abundance. Of course, the baryon density is in complete violation of bounds from nucleosynthesis ([Tytler et al.] 1996). Due to its large width, the peak feature provides only a marginal, but perhaps adequate, fit to the [Einasto et al.] (1997) data.
Although unusual, these models need not be at odds with current CMB observations. High baryon fractions tend to substantially enhance the first acoustic peak, and of course blue tilts enhance all power at smaller angular scales. If reionization were not invoked, the models would overproduce degree-scale anisotropies. However, with reionization corresponding to an optical depth of for the model and for the model, the degree-scale predictions are suppressed to match current observations (e.g. [Netterfield et al.] 1997). Because of the high baryon content, these values of correspond to rather low epochs of reionization, and respectively. Nor does the reionization overproduce secondary anisotropies; we find a Vishniac contribution ([Hu & White] 1996) across the ATCA band () of and respectively, well below the current limit of ([Subrahmanyan et al] 1993).
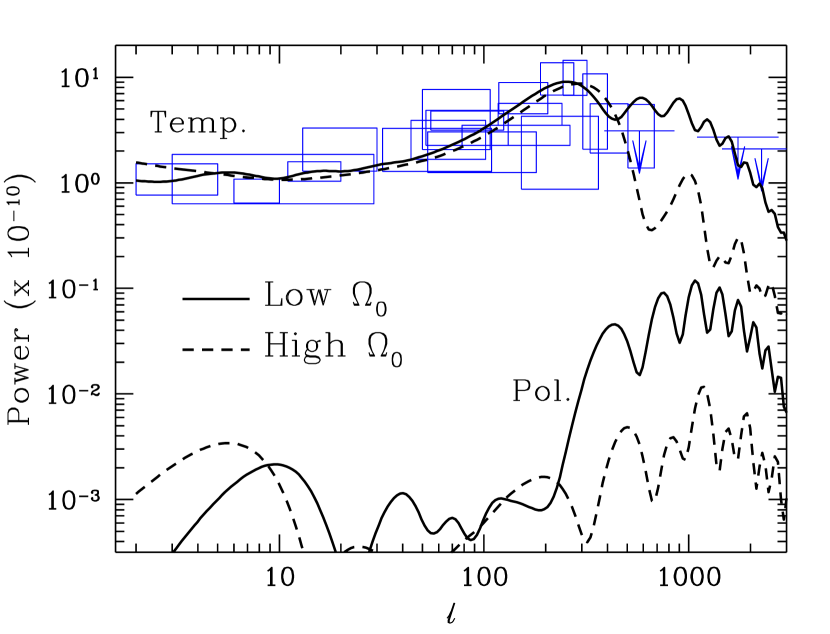
Two predictions of these models for the CMB (Fig. 5) are 1) that the second acoustic peak will be quite suppressed compared to the first and third for the high model, due to the high baryon content, and 2) that the high optical depth will produce substantial CMB polarization levels, approaching bandpowers of at COBE scales, as well as substantial sub-arc-minute temperature fluctuations. These are within reach of the current generation of CMB polarization experiments ([Keating et al.] 1997) and interferometer experiments, respectively.
In summary, adiabatic CDM+baryon universes with power-law initial power spectra produce the peak found at only in extreme regions of cosmological parameter space. Placing the first baryonic bump at these wavenumbers requires values of lower than those implied by dynamical mass measurements. This in turn requires extremely large blue tilts and moderate reionization. Avoiding tilts above necessitates a cosmological constant that exceeds limits from gravitational lens surveys ([Kochanek] 1996). These models may also be in conflict with power spectrum observations at even larger scales ().
On the other hand, placing the peak of the power spectrum at the observed scale requires high values of . Such models need and even so provide a feature that is broader than the observations suggest. Dynamically favored values of , say , place the first valley of the power spectrum at the desired place!
The question remains as to whether the observations fairly sample the true power spectrum. The narrow width of the observed features may merely indicate that a small number of -modes are dominating the sample. This is more likely if the distribution of amplitudes is non-Gaussian; for example, small nonlinearities in the density field increase the frequency of hot spots in realizations of the power spectrum ([Amendola] 1994). If the underlying theory has a broad peak around , different volumes may by chance produce spikes at slightly different locations, with the true width only being recovered in a larger survey. However, some underlying feature will still be required, as shown by the failure of simulations of trace-baryon models to reproduce the observations (LCRS).
Can mildly non-linear evolution shift the location of the peak in the linear power spectrum? Second-order corrections to the real-space power spectrum (e.g. [Jain & Bertschinger] 1994) act only to reduce the amplitude of features, although the effects are quite small on the scales in question. One possible loophole is coherent effects in redshift space, which we plan to investigate using the Zel’dovich approximation ([Szalay et al.] 1997). A second possibility is scale-dependent bias, for example if objects tend to trace the scale at which the power spectrum is steepest, rather than where it has its maximum.
Finally, one may consider models beyond those treated here. Isocurvature models (e.g. [Peebles] 1987) produce a sequence of oscillations that are out of phase with those of adiabatic models ([Hu & Sugiyama] 1996; [Sugiyama & Silk] 1997). For , this places the peak of the power spectrum at the intended scale; the first bump is never relevant. Alternatively, one can place a feature directly in the initial power spectrum ([Atrio-Barandela et al.] 1997). Ongoing redshift surveys should measure the power spectrum to sufficient precision to distinguish between these various explanations of the excess.
Acknowledgments: We thank J.R. Bond and Uros Seljak for useful discussions, C. Baugh for supplying his results in electronic form, and the hospitality of the Aspen Center for Physics. The CMBfast package ([Seljak & Zaldarriaga] 1996) was used to generate numerical transfer functions. W.H. acknowledges support from the W.M. Keck foundation, D.J.E. and W.H. from NSF PHY-9513835, J.S. from NASA and NSF grants, and A.S.Z. from a NASA LTSA.
References
- [Amendola] Amendola, L., 1994, ApJ, 430, L9
-
[Atrio-Barandela et al.]
Atrio-Barandela, F., Einasto, J., Gottlöber, S., Müller, V., &
Starobinsky, A. 1997, JETP, in press
[astro-ph/970818] - [Bahcall] Bahcall, N.A. 1991, ApJ, 376, 43
- [Baugh & Efstathiou] Baugh, C.M., & Efstathiou, G. 1993, MNRAS, 265, 145
- [Garcia-Bellido & Linde] Garcia-Bellido, J. & Linde, A. 1997, Phys. Lett. B, 398, 18 [astro-ph/9612141]
- [Broadhurst et al.] Broadhurst, T.J. Ellis, R.S., Koo, D.C., & Szalay, A.S. 1990, Nature, 343, 726
- [Broadhurst et al.] Broadhurst, T.J. et al. 1995 in Wide Field Spectroscopy & the Distant Universe, eds. S.J. Maddox & A. Aragón-Salamanca, (Singapore: World Scientific), p. 178
-
[Bunn & White]
Bunn, E.F., & White, M. 1997, ApJ, 480, 6
[astro-ph/9607060] -
[Einasto et al.]
Einasto, J., et al. 1997, Nature, 385, 139
[astro-ph/9701018] -
[EH97]
Eisenstein, D.J., & Hu, W. 1997, ApJ, submitted
[astro-ph/9709112] (EH97) - [Eke et al.] Eke, V.R., Cole, S., & Frenk, C.S. 1996, MNRAS, 282, 263 [astro-ph/9601088]
- [Gaztanaga & Baugh] Gaztanaga, E. & Baugh, C.M. 1997, MNRAS, in press [astro-ph/9704246]
- [Green & Liddle] Green, A.M. & Liddle, A.R. 1997 [astro-ph/9704251]
-
[Gorski et al.]
Gorski, K., et al. 1996, ApJ, 464, L11
[astro-ph/9601063] - [Guzzo et al.] Guzzo, L., Collins, C.A., Nichol, R.C., & Lumsden, S.L. 1992, ApJ, 393, L5
-
[Hu et al.]
Hu, W., Scott, D. & Silk, J. 1994, ApJ, 430, L5
[astro-ph/9402045] -
[Hu & Sugiyama]
Hu, W., & Sugiyama, N. 1996, ApJ, 471, 542
[astro-ph/9510117] -
[Hu & White]
Hu, W., & White, M. 1996, A&A, 315, 33
[astro-ph/9507060] - [Jain & Bertschinger] Jain, B., & Bertschinger, E. 1994, ApJ, 431, 495
-
[Keating et al.]
Keating, B., et al. 1997, ApJ, in press
[astro-ph/9710087] - [Kochanek] Kochanek, C.S. 1996, ApJ, 466, 638 [astro-ph/9510077]
-
[Landy et al.]
Landy, S.D., et al. 1996, ApJ, 456, L1
[astro-ph/9510146] (LCRS) - [Netterfield et al.] Netterfield, C.B., Devlin, M.J., Jarosik, N., Page, L. & Wollack, E.J. 1997, ApJ, 474, 47 [astro-ph/9601197]
- [Peacock & Dodds] Peacock, J.A. & Dodds, S.J. 1994, MNRAS, 267, 1020 [astro-ph/9311057]
- [Peebles] Peebles, P.J.E. 1987, Nature, 327, 210
- [Quashnock et al.] Quashnock, J.M., Vanden Berk, D.E., & York, D.G. 1996, ApJ, 472, L69 [astro-ph/9609013]
-
[Seljak & Zaldarriaga]
Seljak, U. & Zaldarriaga, M. 1996, ApJ, 469, 437
[astro-ph/9603033] - [Smoot] Smoot, G. 1997, astro-ph/9705135
- [Subrahmanyan et al] Subrahmanyan, R., Ekers, R.D., Sinclair, M. & Silk, J. 1993, MNRAS, 263, 416
- [Sugiyama & Silk] Sugiyama, N., & Silk, J. 1997, in preparation
- [Szalay et al.] Szalay, A.S., Eisenstein, D.J., Hu, W., & Silk, J. 1997, in preparation
- [Tytler et al.] Tytler, D., Fan, X.M., & Burles, S. 1996, Nature, 381, 207 [astro-ph/9603069]
- [Vishniac] Vishniac, E.T. 1987, ApJ, 322, 597
- [Willmer et al.] Willmer, C.N.A., Koo, D.C., Szalay, A.S., & Kurtz, M.J. 1994, ApJ, 437, 560
- [White & Silk] White, M. & Silk, J. 1996, Phys. Rev. Lett., 77, 4704 [astro-ph/9608177]