Measuring -Ray Energy Spectra
with the HEGRA IACT System
111Talk presented at the Workshop “Towards a Major Atmospheric
Cherenkov Detector V”, Kruger Park, South Africa, 1997
W. Hofmann
HEGRA Collaboration
Max-Planck-Institut für Kernphysik, Heidelberg
Abstract
The stereoscopic reconstruction of air showers viewed by multiple imaging atmospheric Cherenkov telescopes (IACTs) allows a more precise reconstruction of shower energies and hence an improved determination of energy spectra. Reconstruction techniques and in particular new systematic checks are discussed on the basis of the large sample of -rays from Mkn 501 detected with the HEGRA IACT system.
1. Introduction
One of the premises of stereoscopic imaging of air showers using multiple atmospheric Cherenkov telescopes is an improved reconstruction of shower energies and hence of source spectra. Stereoscopic imaging allows a rather precise reconstruction of the core location; using the known relation between light yield, core distance, and shower energy, the energy is estimated by suitably averaging the measurements by the individual telescopes. The HEGRA system of imaging atmospheric Cherenkov telescopes (Daum et al., 1997) is operational since late 1996, and first results on energy spectra have been shown at various occasions; for example, Fig. 1 shows the current version of the Mkn 501 spectrum (Aharonian et al., 1997).

Purpose of the present paper is to provide background information on the techniques used to reconstruct spectra, and to discuss the status of our understanding of the system and the systematic checks of the energy reconstruction, which are possible for the first time due to the redundant information provided by the telescope system. I will very briefly discuss the selection of -ray events and then concentrate on two areas, the energy estimate and the determination of the effective detection area. I should emphasize that the primary goal in these analyses was to minimize systematic uncertainties, sometimes at the expense of some loss in statistical precision.
2. -ray event selection
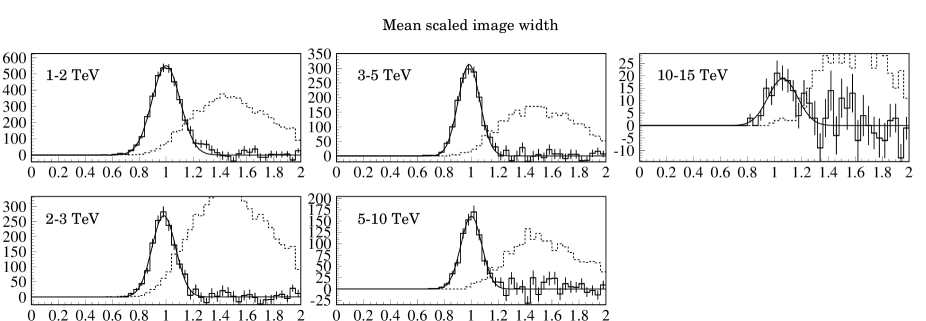
For a -ray source such as Mkn 501, events are selected on the basis of their direction, of the event shape, and of the core location. The directional cuts and the estimate of their efficiency is relatively straight forward. Next, -rays are enriched using the shape information. The so called mean scaled width is calculated by determining for each telescope, as a function of image size, distance to the core and zenith angle the expected width of the image, normalizing the measured width to the expected width, and averaging over all telescopes. Fig. 2 shows the mean scaled width for different ranges of the (reconstructed) shower energy. Excess events from the direction of Mkn 501 show up as a peak around a mean scaled width of 1; the cosmic-ray background gives rise to a broad distribution at higher width values. In the determination of spectra, typical cuts require a mean scaled width below 1.3, resulting in an efficiency well above 90%.
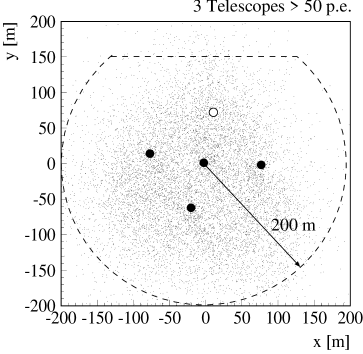
As an additional cut, the location of the shower core is restricted. Fig. 3 illustrates the distribution of shower cores as well as the locations of the four telescopes presently included in the IACT system. Event are required to lie within 200 m from the central telescope, CT3. Usually, we also remove events with a coordinate greater than 150 m, reflecting the fact that the telescope CT2 is not yet included in the CT system. This selection guarantees that a least one telescope is within about 150 m from the shower core.
3. Determination of core location
A crucial input both for the event selection and the energy reconstruction is the reconstruction of the location of the shower core. The reconstruction is based on simple geometry (Daum et al., 1997). With a 4-telescope system, it is not only possible to reconstruct shower cores, but one can also test the precision of the core reconstruction by dividing the full system into two groups of two telescopes each, reconstructing the core separately for each group and comparing the results. In Fig. 4(a), the -coordinate obtained from one group is plotted vs the -coordinate from the other group. One sees a very clear correlation. Assuming that both measurements are uncorrelated, the error in the determination of the core location for such 4-telescope events can be determined (Fig. 4(b)). The error in (and also in ) is about 8 m for events with the core in the central region of the array, and increases to 20 m for distant events, where fewer telescopes trigger and where stereo angles are small.

4. Energy determination
As a first step in the reconstruction of shower energies, the response of the telescopes needs to be calibrated. We use a two-step approach, first equalizing the relative response of the telescopes, and then adjusting the global scale. The determine the relative sensitivity of two telescopes and , shower cores are reconstructed using these two telescopes only. Then, the asymmetry in image sizes, is plotted vs the asymmetry in the distances from the core to the telescopes, (Fig. 5). If two telescopes have a similar sensitivity, the average asymmetry in image sizes is zero for (Fig. 5(a)). In the telescopes are unequal, the distribution appears shifted (Fig. 5(b)). We find the following ratios of sensitivities: CT4/CT3 = 0.937 (0.937), CT5/CT3 = 0.857 (0.855), and CT6/CT3 = 0.791 (0.778). The first number is always determined using a cosmic-ray event sample, the second (in parenthesis) using the Mkn 501 -ray sample. The two sets of numbers are consistent within their statistical errors, which range from 0.005 to 0.007. We believe, therefore, that the relative calibration is good to about 1% or better. The 20% differences between telescopes could be caused by differences in the quantum efficiencies of the different batches of PMTs, by variations in mirror reflectivity etc. (the telescopes came into operation sequentially, over a span of 1.5 years).

The absolute calibration of the energy scale is much more challenging. Presently, we study three different methods: i) the determination of the photoelectron to ADC channels conversion factor using the width of the distribution of laser test pulses to estimate the mean number of photoelectrons per pulse, ii) the measurement of the response of the whole telescope and of the analysis chain simultaneously using a distant, pulsed, calibrated light source (Frass et al., 1997), and iii) the calibration by comparing the measured and the expected cosmic-ray rate (A. Konopelko et al., 1996). For example, at a fixed reference wavelength of 430 nm the first method results in a sensitivity of ADC channels/(photon/cm2), the second in ADC channels/(photon/cm2). For the cosmic-ray comparison, the MC is still being refined, but first analyses indicate values consistent with the other two, with errors of about 15%. Ultimately, we believe that the energy scale can be determined within about 10%. Note that all energy spectra shown so far use the energy scale derived from a previous generation of MC simulations, where the detector simulation had known imperfections; scales are likely to change by 10% to 20%.
Once the sensitivity is known (or assumed), the shower energy is determined by converting the image size seen in each telescope into an energy value, using the measured distance to the core and the relation between energy, core distance, zenith angle and image size obtained from simulations. Two different approaches are used, one based on an analytical approximation, the other based on Monte-Carlo generated look-up tables. Fig. 6(a) illustrates a typical dependence of average image size on core distance. To properly average over telescopes, the errors of the energy estimates need to be known. One contribution are shower fluctuations and photoelectron statistics (Fig. 6(b)); these errors are large close to the core, and roughly constant at about 20% for larger core distances. A second contribution arises from the error in the determination of the shower core; this contribution is proportional to the slope of the size-distance relation, and to the core error, and rises steeply for core distances of 100 m and above.


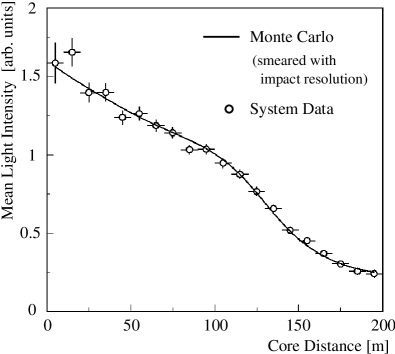
A new and unique feature of the telescope systems is that these crucial inputs can be verified experimentally. To measure the light yield as a function of core distance, one selects events with cores at a fixed distance from telescope , and with a fixed image size . These conditions select showers with a (roughly) fixed energy. One then plots for one of the other telescopes the image size as a function of the (varying) core distance . Of course, care has to be taken not to bias the results due to trigger conditions and selection criteria. Fig. 7 shows that the measured distributions agree reasonably with the simulations.
The shower energy is derived by averaging over the measurements from the individual telescopes. Monte Carlo studies show that the resulting energy resolution is not sensitive the details of the averaging process, such as the exact choice of the weights, or if instead of is averaged. Figs. 8(a,b) shows energy resolutions slightly below 20% obtained with two different algorithms. Both show a non-Gaussian tail towards low reconstructed energies, caused by events where the core location is poorly determined. The tail, however, does not harm the reconstruction of steeply falling spectra. The energy resolution is almost independent of energy over a wide range (Fig. 8(c)).

Again for the first time the IACT system allows to check the energy reconstruction procedure by determining energies of 4-telescope events independently from two pairs of two telescopes each. Fig. 9(a) shows that the two measurements correlate quite well. Assuming that the two measurements are independent, one can derive the energy resolution of the system from the width of the distribution in the difference of the two measurements (Fig. 9(b)). The resulting resolution figure of 9.3% is significantly better than the resolution expected on the basis of simulations, which seems to indicate that the two measurements are correlated. Such a correlation might e.g. be caused by the variation in the height of the shower maximum; if this is indeed the case, it should be possible to improve the resolution over the values given in Fig. 8, since the height of the shower maximum can be reconstructed with a resolution of about 1 radiation length (M. Ulrich et al., 1997).

5. Effective detection area
Different techniques are used to determine effective areas, with consistent results. In one approach, the effective area is determined from simulations in the usual way, imposing an upper limit on the distance of the core from the central telescope of 200 m. The resulting area (Fig. 10(a)) saturates at (200 m)2 for energies above a few TeV. Alternatively, the simulations are used to define an energy-dependent maximum radius, such that for events within this radius the average trigger efficiency if large (). The resulting radius is about 100 m at 1 TeV and rises to 200 m at about 4 TeV; above this energy, a constant 200 m cut is applied. To determine spectra, in this latter case a (trigger-)efficiency correction of is applied.

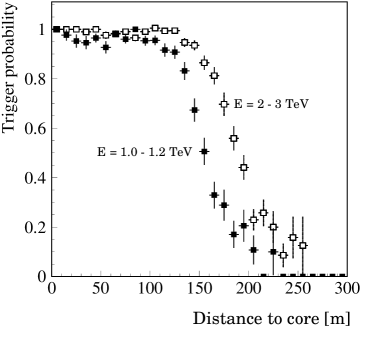
All these estimates of effective areas rely on the ability of the simulation to reproduce single-telescope trigger efficiencies. These, however, can in turn be determined from system data. One reconstructs an -telescope event using only a subset of telescopes, and then checks if the remaining telescope has triggered. Fig. 10(b) shows the measured trigger efficiency obtained for showers in two energy ranges as a function of core distance. At TeV, the trigger efficiency saturates at out to distances of 120 m. With this measured dependence, one can, e.g., verify that TeV showers with cores within 100 m from the central telescope will indeed trigger two telescopes with more than 80% average probability.
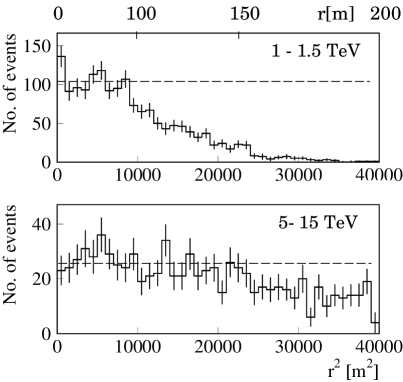
Another way to verify the estimate the maximum radius for efficient triggering of the IACT system is to simply plot the distribution of events, where is the distance to the central telescope. Ideally, the area density should be flat up to the (energy-dependent) maximum radius. Fig. 11 shows this distribution for energies of 1 TeV to 1.5 TeV and for high energies above 5 TeV. The events above 5 TeV show a slight drop-off beyond radii of 150 m; however, the trigger efficiency averaged out to 200 m radius is still 84% (assuming that is it indeed 100% for small radii). At one TeV, the efficiency is flat out to 100 m.
6. Summary
The discussion given in this paper represent a progress report, and it is clear that we still have a significant way to go towards a final ‘product’. On the other hand, it should be obvious that IACT systems provide a wealth of redundant information, both on individual air showers and on average shower properties, and that they promise a qualitative step forward in the determination of -ray energy spectra. The power of the HEGRA IACT system, combined with the large sample of about 30000 -ray events from Mkn 501, can be used to understand the properties of the detection system at a level of precision which seemed impossible before.
7. Acknowledgements
The results reported here represent the work of the HEGRA IACT group; in particular the contributions by G. Hermann and A. Konopelko should be emphasized. The HEGRA experiment is supported by the German Ministry for Research and Technology BMBF, and by the Spanish Research Council CYCIT. We thank the Instituto de Astrofisica de Canarias for the use of the site and for providing excellent working conditions.
References
-
Aharonian, F. et al., Astron. Astrophys., in press (1997); astro-ph/9706019.
-
Daum, A. et al., Astropart. Phys., in press (1997); astro-ph/9704098.
-
Frass, A. et al., subm. for publication (1997); astro-ph/9707304.
-
Konopelko, A. et al., Astropart. Phys. 4, 199 (1996).
-
Ulrich, M. et al., subm. for publication (1997); astro-ph/9708003.