Dwarf Elliptical Galaxies in the M81 Group: The Structure and Stellar Populations of BK5N and F8D1111Based on observations with the NASA/ESA Hubble Space Telescope, obtained at the Space Telescope Science Institute, which is operated by the Association of Universities for Research in Astronomy, Inc., (AURA), under NASA Contract NAS 5-26555.,222 Observations made with the Burrell Schmidt of the Warner and Swasey Observatory, Case Western Reserve University.
Abstract
The M81 group is one of the nearest groups of galaxies, but its properties are quite different from those of the Local Group. It has therefore provided a different environment for the evolution of its member galaxies. We have carried out a CCD survey of the M81 group to search for analogs to Local Group dwarf elliptical (dE) galaxies. All the M81 dwarfs previously identified in photographic surveys were recovered and we also discovered several new systems whose surface brightnesses fall within the range found for Local Group dE’s. We have obtained HST WFPC2 images through the F555W and F814W filters of two M81 group dE’s: BK5N and a new system, designated F8D1. The resulting color–magnitude diagrams show the upper two magnitudes of the red giant branch. The I magnitudes of the red giant branch tip in both galaxies yield distances that are consistent with membership in the M81 group. Surface brightness and total magnitude measurements indicate that BK5N and F8D1 have similar central surface brightness (24.5 and 25.4 mag/arcsec2 in V, respectively), but F8D1’s larger length scale results in it being 3 magnitudes more luminous than BK5N. BK5N lies on the relation between central surface brightness and absolute magnitude defined by Local Group dwarf ellipticals, but F8D1 does not. F8D1 is more luminous for its central surface brightness than the relation predicts, similar to the large low surface brightness dwarf galaxies found in, for example, Virgo. The mean color of the giant branch is used to establish the mean abundance of each galaxy. F8D1, the more luminous galaxy, is significantly more metal rich ([Fe/H] –1.0) than BK5N ([Fe/H] –1.7). Both BK5N and F8D1 lie on the relation between absolute magnitude and metal abundance defined by Local Group dwarf ellipticals. However, as regards the relation between central surface brightness and metal abundance, BK5N again follows the Local Group dwarfs, while F8D1 deviates significantly from this relation. This suggests that the total amount of luminous matter is more fundamental in controlling metal enrichment than the surface density of luminous matter. We have also used the color width of the giant branch compared with the photometric errors to establish abundance ranges in both galaxies, the sizes of which are comparable to those in Local Group dE’s. From the numbers and luminosities of asymptotic giant branch stars more luminous than the red giant branch tip, we infer that, again like many of the Local Group dE’s, both BK5N and F8D1 have had extended epochs of star formation. F8D1 contains stars as young as 3 – 4 Gyr, while in BK5N stars as young as 8 Gyr are present. The fractions of intermediate-age population, at 30%, are similar in both galaxies. Further, one globular cluster has been found in F8D1, but none are present in BK5N. These numbers of clusters are consistent with our expectations from Local Group dwarfs. Overall, we find that BK5N is similar in all respects to the Local Group dE’s. Thus, in spite of the different environments of the M81 group and the Local Group, dwarf galaxies of very similar properties are present in each group. F8D1, on the other hand, has no Local Group counterpart and is indeed rare even in large clusters of galaxies. Our study of its stellar population is the first for a large low surface brightness dwarf.
1 Introduction
Within the Local Group the most numerous type of galaxy are the dwarf elliptical555We consider the dwarf spheroidals to be a subset of the dwarf ellipticals, with the former term referring specifically to the lowest luminosity gas-poor galaxies found around the Galaxy, and the latter term encompassing all low surface brightness, gas-poor galaxies regardless of location or luminosity. (dE) systems: there are now nine known dE companions to the Milky Way, six dE companions to M31 and one apparently isolated dE, Tucana. Because of their proximity, these galaxies are the most easily studied examples of what may be the most common type of galaxy in the Universe. In the last decade these local systems have been studied in increasing detail and though their evolutionary history is far from completely understood, these dE systems are all now relatively well observed objects (see, for example, recent reviews by Da Costa 1992, Zinn 1993 & Armandroff 1994). Indeed the Milky Way companion dE galaxies show well established relationships between surface brightness, absolute magnitude, length scale and mean abundance which both the M31 dE companions and the Tucana system also follow. This would seem to suggest that these relations are characteristic of the dE formation process and that this process is not strongly dependent on the environment in which the dE systems are found. On the other hand, there is some evidence that these relations are not universal. For example, Caldwell et al. (1992) have included the low surface brightness Virgo cluster dE galaxies from Impey et al. (1988) in a plot of central surface brightness against absolute magnitude for the Local Group dE systems. They conclude (cf. Caldwell & Bothun 1987; Impey et al. 1988) from this diagram, with its larger sample of dE galaxies, that the relationship between surface brightness and absolute magnitude breaks down at faint surface brightness (): below this level dE galaxies can be found with a wide range of luminosities. This immediately raises the question: are the abundances and stellar populations of such low surface brightness systems determined by their total luminosities or by their central surface brightnesses? Support for either alternative can be found in theoretical models in the literature (e.g. Phillipps et al. 1990, Bender et al. 1993). But by studying the properties of dE galaxies outside the Local Group, we can begin to answer this question observationally and thus address the broader issue of the extent to which environment affects the properties of these systems.
The M81 group of galaxies is one of the nearest groups to our own. It contains one large spiral (M81), two peculiar galaxies (M82 and NGC 3077), a few small spirals and a large number of dwarf galaxies. Further, there is evidence that a number of substantial interactions have occurred in this group in the recent past (Solinger et al. 1977; Kennicutt et al. 1987; Yun et al. 1994). Thus it provides a quite different environment from that of the Local Group, enabling the possibility of comparative studies.
In this paper, we discuss the structure and stellar populations of two low surface brightness galaxies in the M81 group. We begin, in the next section, by summarizing a CCD survey for low surface brightness galaxies in the vicinity of M81 and describing how we selected two galaxies for detailed study. Sec. 3 describes our HST/WFPC2 imaging of these two galaxies and the resulting photometry of these galaxies’ stars. The color–magnitude diagrams that result from this photometry are presented in Sec. 4. The color–magnitude diagrams are analyzed to yield distance moduli in Sec. 5, metal abundances in Sec. 6, and inferences about the intermediate-age population based on upper asymptotic giant branch stars in Sec. 7. The globular cluster content of these galaxies is discussed in Sec. 8. Finally in Sec. 9, we compare these two M81 group dwarfs with their Local Group counterparts, concentrating our analysis on the central surface brightness–absolute magnitude diagram and the correlations between metal abundance and both absolute magnitude and central surface brightness.
2 Selection of the M81 Group Dwarfs
2.1 A new CCD survey
In a number of papers, Borngen and colleagues (Borngen et al. 1982a, 1982b, 1984; Karachentseva et al. 1984, 1985) have surveyed the M81 group for dwarf galaxies using photographic plates from the Tautenberg Schmidt telescope, attempting to supplement the catalogs of brighter galaxies such as those of de Vaucouleurs (1975) and Kraan-Korteweg & Tammann (1979). This work ultimately resulted in the catalog of Karachentseva et al. (1985) which listed 37 galaxies as possible dwarf members of the group, down to a quoted photographic magnitude of about 18. Binggeli (1983; see also van Driel et al. 1997) edited this list somewhat, showing 41 galaxies with apparent photographic magnitudes from 8 to 18.
While the quoted limiting magnitude of 18 corresponds to M, thus placing the candidates in the dwarf spheroidal regime, it seemed to us that a further survey of the group using a CCD as a detector would better explore that luminosity realm. To this end, we obtained new images of the M81 field with the Burrell Schmidt on Kitt Peak and a Tektronix/STIS 20482048 CCD, located at the Newtonian focus. This system provides images with a 1 degree field, with 2.03 arcsec/pixel. Over the years 1991-1994 we obtained 60 overlapping V-band frames around the M81/M82/NGC3077 trio, resulting in an areal coverage of approximately 40 square degrees. Exposure times were 1500 sec. Unfortunately, bad weather was a constant companion during the years of observations. Hence most of the frames were taken during good, but not photometric, conditions. As a result, it has proved to be impossible to provide accurate survey limits for all the fields, though our newly detected galaxies tell us that we did go deeper than the photographic surveys.
The areal coverage around M81 is equivalent to a radius of about 180 kpc; this radius around our Galaxy includes all but the two outer Galactic dwarf ellipticals Leo I & II. We easily recovered all of the previously cataloged M81-group dwarfs, and found seven more candidates as well. Of these, one was not confirmed on re-observation with a different telescope and one turned out to be a Galactic reflection nebula (common in the M81 group, see Sandage 1976). Three others have been confirmed to be dwarf members of the M81 group, all apparently dwarf ellipticals, while the nature of the final two awaits future observations.
In this paper, we report further extensive observations of one of the confirmed new dwarf ellipticals as well as a dwarf elliptical listed in Karachentseva et al. (1985), in fact the faintest one in that catalog.
2.2 Ground Based Imaging of M81-BK5N and M81-F8D1
From the Karachentseva et al. (1985) catalog we have chosen BK5N. A V band CCD image from the FLWO 1.2m telescope is shown in Fig. 1. This galaxy appears to have a nucleus, off-center by about 2˝. The HST images have revealed this “nucleus” in fact to be a background spiral galaxy.
The galaxy from our own survey that we discuss here is named F8D1 (it was found on our eighth field), also shown in Fig. 1. It is evident that this galaxy is of very low central surface brightness, yet it is also quite large on the sky, much larger than BK5N. There is also some apparent asymmetry in the outer isophotes at the faintest levels, which we will discuss further below.
Figure 2 shows the position of these two galaxies on the sky with respect to the brighter galaxies in the group. F8D1 is about 1/2 degree away from the spiral NGC 2976, corresponding to a separation of 34 kpc if both galaxies are at the distance of M81 (3.6 Mpc, Freedman et al. 1994). In fact, an accurate distance of NGC 2976 is not available, and that of F8D1 is somewhat larger than that of M81 (see Sec. 5). The implied tidal radius of F8D1 caused by NGC 2976 would be Rt = 6.5 kpc (assuming the same M/L for both galaxies), whereas the actual limiting radius of F8D1, determined from the surface brightness profile, is 5.8 kpc. It is thus possible that F8D1 is tidally limited by NGC 2976, if both galaxies are at the same distance. BK5N lies at a similar angular distance from NGC 3077, implying a tidal radius for the former galaxy of 2.1 kpc. The dwarf’s actual limiting radius is only 0.9 kpc, so this galaxy might also be tidally limited by the nearby giant, again assuming similar distances (there is no accurate distance to NGC 3077 either). But it is more probable that the radii of both galaxies were determined during formation, because there are other dE’s with similar light profiles in clusters that are not near large galaxies (Caldwell & Bothun 1987).
Our calculations showed that giant branch tip stars in galaxies at the distance of M81 should be resolvable from the ground in excellent seeing. Because of its crude resemblance to the surrounding Galactic cirrus, F8D1 was imaged with a CCD on the MDM 2.4m telescope in the R band during two runs in 1994 and 1997, in an attempt to verify its nature as a galaxy in the M81 group before proceeding with HST observations. The 1994 data had 0.7˝ seeing, while the 1997 data had 1.2˝ seeing. Figure 3, a mosaic of both CCD frames, reveals that indeed the galaxy is well resolved into stars, including the faint asymmetric outer part to the north. Thus the asymmetry is not due to contaminating cirrus but is rather a feature of F8D1; however it is a relatively minor contributor to the total luminosity of the galaxy, only a few percent. It is unlikely that the feature is a tide raised by NGC 2976, because tides raised on dwarf galaxies by giants are expected to be symmetric (Piatek & Pryor 1995). Whatever the cause, other small asymmetries are observed in some of the Local Group dE galaxies (e.g. Irwin & Hatzidimitriou 1995).
BV CCD images from the Burrell Schmidt and the FLWO 1.2m telescope were used to derive the basic photometric properties and light profiles of these two galaxies. The techniques described in Caldwell et al. (1992) were employed in the analysis of these images. Photometric zero points were derived from standard stars observed during the nights of observations. The ellipticity of F8D1 was assumed to be 0.0, as judged by eye, while that of BK5N was measured via an ellipse fitting program to be 0.4. The asymmetry of F8D1 was ignored in the photometry because it contributes only a few percent to the total luminosity. Likewise, the central background galaxy in BK5N contributes about 1%, and was interpolated across in the image before analysis (which was not completely successful, as the figure still shows a steepening of the profile in the center). Figure 4 shows the light profiles, and Table 1 lists the derived properties. The profile of F8D1, while exponential in the outer parts, is shallower than an exponential in the center; the profile of BK5N is much steeper than an exponential (common for the faintest dE’s, see Caldwell & Bothun 1987). Thus Sersic profiles (I=I, Sersic 1968), which have an additional free parameter over an exponential (which corresponds to =1), were fit to the data. The derived parameters are shown in Table 1. In addition to being much smaller, BK5N has a much steeper profile than F8D1, judging from the differences in the slope parameter .
A general comparison of the two galaxies reveals F8D1 to be about six times larger in radius than BK5N, even though the latter galaxy has a somewhat higher central surface brightness. Thus F8D1 is much more luminous than BK5N; it is also slightly redder (Table 1), though the photometric errors are large. Placing these galaxies in the surface brightness–luminosity diagram for dE’s (Fig. 5) allows some further comments to be made (the distances used in obtaining the luminosities are derived in Sec. 5). BK5N is clearly similar to the Galactic and M31 dwarf ellipticals - it is small and of low luminosity (it is also highly flattened). F8D1 on the other hand has no counterpart in the Local Group. Rather, its nearest analogs can be found in the Virgo and Fornax clusters, which contain a small number of very large, low surface brightness dwarfs, as described by Sandage & Binggeli (1984) and studied in detail by Impey et al. (1988) and Bothun et al. (1991), who showed histograms of scale lengths and surface brightnesses for Virgo and Fornax cluster dwarf ellipticals. The scale length of F8D1 at Virgo would be about 18-21˝which is comparable to the scale lengths of Virgo systems V2L8 and V3L1, for example, dE’s which have similar central surface brightnesses to F8D1 (Impey et al. 1988). Nevertheless fewer than 1% of cataloged Virgo or Fornax dE galaxies with similarly low central surface brightnesses are as large as F8D1, less than 10 in number. Thus F8D1 is a rare type of galaxy, in any environment. F8D1 is the first such large scale length dwarf galaxy to be resolved into stars. For BK5N, the scale length at Virgo would be 3 to 4˝, which is basically below the current detection limit in those clusters, though as we have noted, it is similar to many of the Local Group dwarf ellipticals.
Finally, from the ground-based images these two galaxies do not appear to have had recent star formation. Huchtmeier & Skillman (1994) and van Driel et al. (1997) have surveyed previously cataloged M81 group galaxies at 21 cm, but did not detect any H i in BK5N. Assuming a line width of 24 km/sec (corresponding to a typical Galactic dE velocity dispersion of 10 km/sec), the 3 upper limit for BK5N of 13.5 mJy given by van Driel et al. (1997) corresponds to MHI/LB 0.4 in solar units, provided the velocity of the dwarf is sufficiently separated from that of the Galactic H i. This is not a very strong limit since Local Group dE’s have MHI/LB 10-2, while the Local Group dwarfs Phoenix and LGS3, which contain young stars, have H i detections that correspond to MHI/LB 0.1 – 0.2. Deeper H i observations of BK5N, and of F8D1 which has not been observed in H i to our knowledge, are clearly desirable.
3 HST WFPC2 Photometry
To explore the resolved stellar populations of these two galaxies, in particular to measure the distances, the mean stellar metallicities, the metallicity dispersions and the young/intermediate age star content, we observed BK5N and F8D1 with the WFPC2 camera on HST. Previous work on deriving metallicities of old stellar populations has indicated that the giant branches must be observed down to about 2 mags below the tip for greatest accuracy. If our two dwarfs are at the distance of M81, this means that stars down to I 26 must be observed. This number dictated the exposure times for our galaxies. We elected to observe with the F555W and the F814W filters, so that we could transform easily to VI magnitudes, and hence employ the techniques of Da Costa & Armandroff (1990) using the I magnitude of the giant branch tip for distance determinations and the (V-I)0 color of the giant branch for metallicity measurements.
Our objects are located in the so-called “continuous viewing zone” of HST, meaning that they could be observed continuously through several orbits. Scheduling difficulties prevented us from obtaining all of the data at a single visit however, hence both galaxies were observed at two different spacecraft orientations. This meant that (1) we could not combine the frames themselves together, rather we would have to combine the resultant stellar photometry instead and (2) the area surveyed at the total exposure depth would only be the overlapping areas of the two visits, rather than the full field of the WFPC2 frames. On the positive side, the time span between observations allowed us to search for variable stars. Table 2 presents the observation log, and Fig. 6 shows overlays of the WFPC2 footprint for the two visits for each of the galaxies. Most of BK5N will thus be found on the PC frame alone, while even the entire WFPC2 area would not include all of F8D1, let alone the overlapping areas from the two visits.
The frames were debiased, zero-corrected, dark-subtracted and flat-fielded by the STScI pipeline process before being made available to us. We then combined the frames for each filter and visit using the STSDAS routine gcombine, which effectively removes cosmic rays. Since we would be doing point source photometry, we also needed to restore the photometric flatness of the images, which had been changed by the flat-fielding process (which corrects for effect of geometric distortion of the images on extended objects at the expense of introducing a non-flatness for point sources). The frames were multiplied by the so-called “geometric-distortion” frame to accomplish the correction.
Figure 7 shows the PC field for one of the visits to BK5N, and Fig. 8 shows the full WFPC2 field for F8D1. It is clear that both galaxies are well-resolved into stars, and that stellar photometry would not be compromised by the minimal crowding. As mentioned above, BK5N seems to be nucleated from the ground based images, with the “nucleus” 2˝ offcenter. (Note that the “N” in the name given by Karachentseva et al. 1985 refers to “new”, not “nucleated”.) The PC image shows that this “nucleus” is in fact a background spiral galaxy (see enlargement in Fig. 9), with V–I = 1.2, typical for field galaxies of its magnitude (see Driver et al. 1995).
Instrumental magnitudes were measured from the combined frames using conventional digital aperture photometry, as implemented in the IRAF package daophot. In particular, the find task was used to identify the stars, and the phot task provided the photometry. An aperture radius of 2.0 pixels was used for both the WF and PC frames. The next step was to determine the aperture correction from the 2-pixel-radius apertures to the standard aperture size for the WFPC2 photometric system, 0.5 arcsec in radius (Holtzman et al. 1995). These aperture corrections were measured using fairly bright, uncrowded stars. Because only a few suitable stars, at most, were present on each CCD, we were forced to ignore any spatial variations in the aperture corrections. Thus, for each visit and filter, we adopted a single aperture correction for the WF frames and another for the PC frame. As noted in Da Costa et al. (1996), ignoring the spatial variation in the aperture corrections results in only a second order effect on the colors. After applying the aperture corrections, we corrected for exposure time and the gain factors for each CCD (following Holtzman et al. 1995). We also eliminated stars found on the vignetted regions of the CCDs (X75, Y75 for the WF CCDs; X100, Y100 for the PC) and a small number of obvious galaxies.
We derived transformation equations between the coordinate system of the first visit and that of the second visit for each galaxy and filter. This allowed us to match the photometry for stars in common between the two visits. Because the WFPC2 orientation on the second visit for each galaxy is rotated significantly from the orientation on the first visit (see Fig. 6), comparing the magnitudes during the two visits yields information on the charge-transfer ramp effect (see Holtzman et al. 1995) during our observations. In plots of magnitude difference between the two visits versus change in Y coordinate, we could see no evidence of the charge-transfer ramp. This may be a consequence of our relatively long exposure times, and hence relatively high background levels. In any case, we decided not to apply any charge transfer ramp correction. Next, we combined the corrected magnitudes for the two visits weighted according to their uncertainties and only retained stars that had photometry on both visits in both filters. Finally, we transformed from the instrumental system to standard using the zeropoints and color terms of Table 7 of Holtzman et al. (1995).
We have compared the uncertainties in the I magnitudes and V–I colors based on photon statistics with the uncertainties implied by the repeatability of the magnitudes and colors between the two visits. Table 3 lists, as a function of I magnitude, the mean uncertainties based on photon statistics ( and ) and those based on repeatability between the two visits ( and ) after excluding variable stars (see Sec. 4.1). The uncertainties computed by the two methods agree very well at magnitudes fainter than I 24.5. Brighter than this, the repeatability uncertainties do not decrease as rapidly as those based on the photon statistics, particularly for the I magnitudes. This suggests that there are contributions from effects such as flat fielding, dark subtraction, or the frame combination process, for example, which limit the errors at the brighter magnitudes. Such a result was also noted by Da Costa et al. (1996). In addition to these photometric errors, we will also consider in the subsequent analysis the effects of a possible 0.05 mag systematic zeropoint uncertainty. This comes from the uncertainty in the aperture corrections (0.04 mag) and from uncertainty in the zeropoint of the transformed photometry relative to the standard system (0.03 mag).
4 Color–Magnitude Diagrams
Figure 10 shows the I,V–I color–magnitude diagram of BK5N for the 357 stars measured on the PC frames in both datasets. As discussed previously, and as is apparent from Fig. 6, the bulk of BK5N falls on the PC frame, and the WF frames cover mostly background. This is further illustrated in Fig. 11 which shows the color–magnitude diagram of the BK5N WF frames as a function of distance from the center of BK5N. In Fig. 11 only the innermost portion of the WF frames shows a strong indication of a giant branch. The BK5N PC color–magnitude diagram in Fig. 10 reveals a well defined giant branch, with a giant branch tip magnitude of I 23.9. No bright blue stars are present. Anticipating the BK5N distance modulus and mean abundance results from the next two sections, and using the Bertelli et al. (1994) log(Z/Z☉) = –1.3 isochrones, the lack of stars with V–I 0.7 in Fig. 10 indicates that no star formation has occurred in this dwarf for at least the last 300 Myr. However, a significant number of red stars more luminous than the giant branch tip are evident in Fig. 10. These stars have no counterpart in the background color–magnitude diagram (see the outer two bins in Fig. 11) and are most probably upper asymptotic giant branch (AGB) stars in BK5N. They will be discussed in Sec. 7.
Figure 12 shows the I,V–I color–magnitude diagram for F8D1 based on the 2061 stars measured on the WF frames from both datasets. Unlike the case for BK5N, the F8D1 WF frames are nicely populated with member stars (see Figs. 6 & 8). As with BK5N, a giant branch is evident in the color–magnitude (c-m) diagram and the giant branch tip magnitude is I 24.0 (quite similar to that of BK5N). Again, stars more luminous than the giant branch tip are evident, and no blue stars are present. Combining the F8D1 distance modulus and mean abundance results from the next two sections with the Bertelli et al. (1994) isochrones for log(Z/Z☉) = –0.7 then suggests that no star formation has occurred in F8D1 for at least the last 150 Myr. Figure 12 does, however, show a small (31 stars) population fainter than the red giant branch tip (by 0.8 mag) with intermediate colors (0.2 V–I 1.0). Scaling the number of the stars with 24.5 I 25.7 and V–I 1.0 by the appropriate areas then predicts that the BK5N “field” region c-m diagram (R 60) should contain 11 similar objects. In fact the c-m diagram (Fig. 11) contains 5 stars in the same color and magnitude range. Allowing for Poisson statistics variations in the actual numbers of stars, this difference is a 2 effect. We thus interpret the minor population of intermediate color stars in the F8D1 c-m diagram as due primarily to foreground stars, together with a probable component of F8D1 stars arising from occasional larger than average photometry errors. These stars will not be discussed further. Overall, the c-m diagrams for these M81 group dwarf galaxies are thus quite similar to those for Local Group dwarf ellipticals.
Again in anticipation of the distances to BK5N and F8D1 determined in Sec. 5, we have overplotted the color–magnitude diagrams in Figs. 10 and 12 with standard globular cluster giant branches shifted to the distance modulus and reddening appropriate for each galaxy. The reddenings for BK5N and F8D1 come from the Burstein & Heiles (1982) extinction maps and are listed in Table 1. The standard globular cluster giant branches are from Da Costa & Armandroff (1990). The metal abundances of these galaxies and whether a range of abundance is present in each system will be discussed in Sec. 6. For now, we note that the mean BK5N giant branch lies near that of M2 (which has [Fe/H] = -1.58) and the mean F8D1 giant branch lies between the giant branches of NGC 1851 and 47 Tuc (which have [Fe/H] = -1.16 and -0.71, respectively). The abundances for these M81 group systems are thus also quite similar to those for Local Group dwarfs.
4.1 Variable stars
Because of the time separation between the two HST visits, we can look for variability in our data. For BK5N, the two epochs of observation were 109 days apart, while for F8D1 the separation was 56 days. Such a long time span allows us to search particularly for long period or irregular variables that are expected to occur among giants near, and above, the red giant branch tip.
We created a table of magnitude differences from the VI photometry for each of the two epochs, and divided these differences by the formal uncertainties in the differences. These tables were searched for magnitude differences greater than 4 standard deviations. Stars were flagged as certain variables if both V and I had changes of at least 4. Stars with one color deviating by at least 4 but the other less than 4 were flagged as probable variables. Our criteria will likely not select all of the variables on our frames, but given the limitations of two epochs we feel it best to be conservative. Figure 13 shows the c-m diagrams with the variables identified. The great majority of the variables are located, as expected, near or above the red giant branch tip in both galaxies. A small number of variables, however, were found at luminosities significantly fainter than the red giant branch tip (e.g. BK5N 1943-1 at I 24.7 and F8D1 1977-2 at I 25.6). In total, and here we include variables from the WF frames for BK5N and from the PC frames for F8D1 which are not shown in Figs. 10 and 12, there are 4 certain and 8 probable variables in BK5N and 18 certain and 38 probable variable stars in F8D1. Table 4 lists the stars (the ID numbers are made up of a four digit number to which is appended an integer indicating which CCD chip the star is found in the first visit data), their photometry and the magnitude differences and significances of variations. Generally, these stars become redder as they fade (which is normal; see for example Eggen 1972, Lloyd-Evans 1983).
The variables that lie above the red giant branch tip are undoubtedly members of an AGB population in both galaxies which will be discussed in Sec. 7. On the other hand, the variables with magnitudes near the red giant branch tip are most probably analogous to the long period variables found in globular clusters and the Galactic dE companions (see, for example, Fig. 8 of Kaluzny et al. 1995). Similarly, the fainter variables would probably be classified as yellow semi-regular variables (SRd stars; Rosino 1978).
5 Distance
In recent years the technique of establishing distances to galaxies via the determination of the luminosity of the red giant branch tip in the I-band has become widely used (e.g. Gallart et al. 1996a, Minniti & Zijlstra 1996). Provided the population under study has sufficient metal-poor ([Fe/H] –0.7) red giants to allow an accurate determination of the red giant branch tip I magnitude, this technique has a precision similar to that for Cepheids (e.g. Lee et al. 1993a). In the upper panel of Fig. 14 we show the I-band luminosity function (LF) for BK5N. This function is based on the c-m diagram of Fig. 10 and includes all stars fainter than I = 23. No correction has been made for foreground Galactic stars since, as Fig. 11 shows, the number of non-member stars is negligible. This LF shows a distinct drop between the 23.9 I 24.0 bin and the next brighter one, which we interpret as the signature of the red giant branch tip. We therefore adopt I(TRGB) = 23.95 0.11 where the uncertainty given is the combination of the uncertainty in the adopted value of I(TRGB), taken as 1 bin width (0.10 mag), and the 0.05 mag zeropoint uncertainty assumed for the photometry. Using the reddening value given in Table 1, we then have I0(TRGB) = 23.86 0.12 where now a 0.02 mag uncertainty in the adopted E(B–V) value is also included.
Da Costa & Armandroff (1990) give a relation between the absolute bolometric magnitude of the red giant branch tip, based on the horizontal branch luminosity scale of Lee et al. (1990), and mean abundance. They also give an equation for the bolometric correction to the I magnitude of red giants as a function of (V–I)0 color. Using (V–I)0 = 1.49 for the mean dereddened color at the giant branch tip (cf. Fig. 10), and using a mean abundance of [Fe/H] = –1.7 0.25 (see next section), the Da Costa & Armandroff (1990) relations yield MI = –4.0 and thus (m–M)0 = 27.9 0.15 for BK5N. Here the uncertainty now also includes the effect of the uncertainty in the mean metal abundance.
In the lower panel of Fig. 14 the LF for F8D1 is shown. This LF includes all stars fainter than I = 22.6 in Fig. 12 except for a small number of outliers that lie well to the blue of the red giant branch, though including these stars would not alter the outcome. Based on the field results for BK5N depicted in Fig. 11, we assume that the contribution of non-member stars to the F8D1 LF is also negligible. It is immediately evident from Fig. 14 that I(TRGB) for F8D1 is 0.1 mag fainter than it is for BK5N. We adopt I(TRGB) = 24.0 0.07 where, as for BK5N, the uncertainty is the combination of the uncertainty in the location of I(TRGB), here 0.05 mag since the larger number of stars permits a finer binning, and the assumed 0.05 mag uncertainty in the photometric zeropoint. Using the reddening for F8D1 given in Table 1 and following the same procedures as for BK5N, the distance modulus of F8D1 determined by this method is (m–M)0 = 28.0 0.10. The uncertainty given includes the effects of uncertainty in the reddening and in the mean metal abundance. Of course neither this value for F8D1 nor that for BK5N include any possible systematic uncertainty in the horizontal branch distance scale on which the TRGB method is based. Nevertheless, these modulus values unequivocally associate both dwarfs with the M81 group, since Freedman et al. (1994) give (m–M)0 = 27.8 0.20 for M81 itself based on Cepheid variables. The apparent difference in line-of-sight distance between BK5N and F8D1 is, at 200 kpc, similar to their projected separation on the sky of 140 kpc. This (and Fig. 2) illustrates, if nothing else, the compactness of the M81 group compared to the Local Group.
6 Metal Abundances and Abundance Dispersions
With the distance moduli of these dwarf galaxies established, we can now derive their mean metal abundances and investigate any internal abundance ranges via a comparison with the fiducial globular cluster giant branches of Da Costa & Armandroff (1990). These comparisons are illustrated in Figs. 10 and 12. In their paper Da Costa & Armandroff (1990) gave an abundance calibration based on the mean (V–I)0 color of the red giant branch at a luminosity of MI = –3 (which corresponds to I 25.0 for these M81 group objects). However, Armandroff et al. (1993) noted that the sensitivity to abundance is increased, and the influence of AGB stars decreased (such stars were specifically excluded in the Da Costa & Armandroff (1990) calibration but cannot be here), if a luminosity of MI = –3.5 was adopted for the abundance determination (see also Lee et al. 1993a). The one half magnitude increase in the luminosity employed also reduces the influence of photometric errors in most situations. Armandroff et al. (1993) presented a linear relation, appropriate for [Fe/H] –1.3, between (V–I)0,-3.5 (the dereddened giant branch color at MI = –3.5) and [Fe/H] but illustrated only in their Fig. 7 the quadratic relation appropriate for the full abundance range of the calibration clusters (–2.2 [Fe/H] –0.7). That quadratic relation, which we will employ here is:
[Fe/H] = –1.00 + 1.97q – 3.20q2
where q = ((V–I)0,-3.5 – 1.6). The rms deviation about the fit is 0.08 dex.
Using the modulus derived in the previous section, MI = –3.5 corresponds to I = 24.49 for BK5N. Thus to determine (V–I)0,-3.5, the mean dereddened color for the stars in the magnitude interval 24.39 I 24.59 was computed. Excluding one star that lies 5 away from the mean and one probable variable that lies in this magnitude interval, the remaining 25 stars yield (V–I)0,-3.5 = 1.360 0.015 where the listed uncertainty is the standard error of the mean. Applying the above calibration then yields the mean abundance of BK5N as [Fe/H] = –1.7 0.25666As can be seen from Fig. 7 of Armandroff et al. (1993), this value is essentially identical with that which results from using the linear ((V–I)0,-3.5, [Fe/H]) calibration.. Here the listed error includes contributions from the calibration relation (0.08 dex), the statistical error in (V–I)0,-3.5 (0.05 dex), the uncertainty due to zeropoint (0.05 mag) and E(B–V) (0.02 mag) uncertainties (0.20 dex), and the effect of a 0.15 mag uncertainty in the distance modulus (0.10 dex), with the combined zeropoint and reddening uncertainties being dominant. A consistency check on this derived mean abundance is provided by applying the Da Costa & Armandroff (1990) calibration at MI = –3.0 (I = 24.99). We find an abundance higher by only 0.18 0.14, where in this instance the uncertainty includes only the calibration and statistical uncertainties. This difference is acceptably small and indicates that our adoption of [Fe/H] = –1.7 0.25 for BK5N is unlikely to be significantly in error.
The standard deviation in (V–I) color for the sample of BK5N giants used in the mean abundance determination is 0.075 mag, larger than that expected from the errors in the photometry at this magnitude (0.050 mag). Here it is important to note that the expected color error is the same regardless of whether we consider the mean photon statistics error for these stars, or the equivalent color error calculated on the basis of comparing the two independent sets of photometry (cf. Table 3). Subtracting (in quadrature) this error contribution from the observed dispersion then yields an intrinsic (V–I) color dispersion of (V–I) = 0.056 0.02. The error in this color dispersion is derived from its variation as the sample changes due to shifts in the adopted modulus of order 0.15 mag. Armandroff et al. (1993) noted that at this luminosity (MI = –3.5), the asymptotic and red giant branches in globular clusters are essentially coincident, so for a single age population, any intrinsic color dispersion can be interpreted as an intrinsic abundance dispersion. However, in BK5N there is evidence from the c-m diagram that suggests the existence of a range of ages in this dwarf (see following section). As a result, the intrinsic color spread on the giant branch will contain a component from the age distribution as well as from the intrinsic abundance distribution. Fortunately, the effective temperature (and hence V–I color) of a red giant branch star is much more sensitive to abundance than it is to the star’s mass (age). Thus we are justified in interpreting the intrinsic color dispersion primarily as the consequence of an intrinsic abundance dispersion in BK5N, though the quantitative value should be recognized as an upper limit on the true abundance dispersion. With this caveat, the abundance calibration then yields ([Fe/H]) = 0.20 0.07 for BK5N. This value of ([Fe/H]) for BK5N is consistent with those for Local Group dE’s. For example, Armandroff et al. (1993) list 0.16 ([Fe/H]) 0.24 for Andromeda III and Da Costa et al. (1996) give ([Fe/H]) = 0.20 for And I, dE’s which bracket BK5N in luminosity. Similarly, Suntzeff (1993) lists ([Fe/H]) values between 0.19 and 0.30 for the Galactic dE’s. Thus again we have an indication that BK5N is very similar in its properties to the Local Group dE galaxies.
For F8D1, MI = –3.5 corresponds to I = 24.56 and so we have used the interval 24.46 I 24.66 to determine (V–I)0,-3.5 for this galaxy. Excluding one variable star, we find that (V–I)0,-3.5 = 1.607 0.012. The error is the standard error of the mean for the 183 stars in the sample. Applying the calibration given above then yields [Fe/H] = –1.0 0.15 for F8D1. As for BK5N, the uncertainty given here includes contributions from the abundance calibration (0.08 dex), the statistical uncertainty from the sample (0.02 dex), the effect of a 0.05 mag uncertainty in the zeropoint and a 0.02 mag uncertainty in E(B–V) (0.11 dex), and the result of altering the distance modulus by 0.10 mag (0.08 dex). Also as for BK5N, a consistency check on this abundance is provided by calculating (V–I)0,-3.0 and applying the calibration of Da Costa & Armandroff (1990). We find an abundance higher by 0.13 0.11 dex, also with the error including only the statistical and calibration uncertainties, a difference that is again satisfactorily small. Moreover, it is apparent that the difference in mean abundance between BK5N and F8D1, 0.7 dex, is independent of the luminosity on the red giant branch at which the mean abundances are determined.
For the sample of stars used in determining (V–I)0,-3.5 for F8D1, the average photon statistics error in (V–I) is 0.083 mag while the color error inferred from the repeat measurements is 0.086 mag. Both of these quantities are considerably less than the observed color dispersion (V–I) = 0.160 0.015. Here the uncertainty given reflects the change in (V–I) for 0.10 mag changes in the distance modulus. Adopting 0.085 mag as the error contribution, we then have (V–I) = 0.136 0.02. Once more interpreting this color dispersion as primarily a reflection of an internal abundance range, the abundance calibration yields ([Fe/H]) = 0.26 0.03 for F8D1. Again as for BK5N, given the likely existence of an age range in F8D1, this value is strictly an upper limit on the true abundance dispersion.
It is illustrative to compare this value for the abundance dispersion in F8D1 with values for Local Group dwarf systems. For example, Sagar et al. (1990) give ([Fe/H]) = 0.31 0.05 for the Fornax dE from the intrinsic (B–V) width of the giant branch under the assumption of no internal age variation. Alternatively, they give ([Fe/H]) = 0.27 0.06 if there is an age variation of between 3 and 17 Gyr in this dE. These values are similar to that found for F8D1 which is somewhat more luminous, though of lower surface brightness, than Fornax. The other Local Group object with which comparison seems appropriate is the dE galaxy NGC 147, which is 0.7 mag more luminous than F8D1. Han et al. (1997) have studied NGC 147 in detail using HST observations and have employed a similar analysis to that used here; a direct comparison is then possible. At MI = –3.0, Han et al. (1997) give (V–I) = 0.13 for their outer NGC 147 field (the same value as found by Mould et al. 1983 from ground-based data at a larger radial distance), while for F8D1 we find (V–I) = 0.11 0.02 (at MI = –3.0). Using the Da Costa & Armandroff (1990) calibration at the appropriate (V–I)0,-3.0 color, these values translate to ([Fe/H]) = 0.42 and ([Fe/H]) = 0.27 0.04 for NGC 147 and F8D1, respectively. It appears then that the abundance distribution in F8D1 is somewhat narrower than it is in the outer parts of NGC 147. Of course it has to be kept in mind that the presence of an age range in both galaxies (Han et al. 1997; section 7) means that these abundance dispersions are strictly upper limits. It is, however, reassuring to note that the value of ([Fe/H]) derived for F8D1 at MI = –3.0 agrees with that found at the higher luminosity.
One final point deserves comment here. Although the F8D1 data shown in the c-m diagram of Fig. 12 do not cover a substantial fraction of the galaxy’s extent, it is nevertheless of interest to investigate whether there is any indication of a radial gradient in the mean giant branch color. To do this we have split the F8D1 sample into an inner group (r 500 pix from the center, corresponding to 50 which is 0.6 core radii or 0.4 Reff) and an outer group (r 750 pix, equivalent to 75, 0.9 core radii or 0.6 Reff). For the inner group the mean dereddened color of the giant branch at MI = –3.5 is 1.585 0.025 (49 stars), while for the outer group (V-I)0,-3.5 = 1.575 0.020 (51 stars). The difference (innerouter) of 0.010 0.032 mag thus offers no support for the existence of a radial abundance gradient in F8D1, at least within 1 core radius. The 3 upper limit on any possible change in abundance between the two regions is 0.20 dex. Similarly, the BK5N sample has been split into two groups divided at a (geometric) radius of 330 PC pixels, or 15 which is approximately 1 core radius or 0.8 Reff. For the inner sample (V-I)0,-3.5 = 1.353 0.017 (20 stars) while for the outer sample (V-I)0,-3.5 = 1.383 0.031 (6 stars). As for F8D1, the difference in mean giant branch color, -0.030 0.035 mag, does not support the existence of any radial abundance gradient in BK5N. The corresponding 3 upper limit on any possible change in abundance between these two groups is 0.4 dex. These results are consistent with those for the Local Group galaxies NGC 147 (Han et al. 1997) and And I (Da Costa et al. 1996) where in neither case was any strong evidence found to support the existence of a radial abundance gradient.
7 Upper Asymptotic Giant Branch Stars
It is immediately apparent from Figs. 10 and 12 that both these galaxies contain significant numbers of stars that lie above the red giant branch tip. The lack of stars brighter than I 24 in the “field” regions of Fig. 11 strongly suggests that the majority, if not all, of these stars are members of their respective galaxies. The high incidence of variability among this population (cf. Fig. 13) is a further testament to the membership of these stars. Indeed, in BK5N 5 out of 14 (36%) stars brighter than I = 23.8 are listed as probable or certain variables while 39 out of 158 (25%) stars brighter than I = 23.9 in F8D1 are similarly listed. Undoubtedly these variable star fractions are lower limits on their true values, given that we have data at only two epochs.
The existence of stars with luminosities above that of the red giant branch tip, i.e. upper-AGB stars, is, in populations with [Fe/H] –1.0, an unambiguous signature of the presence of an intermediate-age population, a population whose age is considerably less than that of the Galactic globulars. Generally, on an age scale where the Galactic globular clusters are 13 – 15 Gyr old, an intermediate-age population is taken to be one whose age is less than 10 Gyr. The luminosity that an AGB star reaches before it sheds its remaining envelope as a planetary nebula, with the core becoming a white dwarf, is dependent on the envelope mass. All other things being equal, a younger star will have a larger envelope mass and can then evolve to higher luminosities on the AGB than an older star. Thus the maximum luminosity observed on the upper-AGB can serve as an age indicator. There are, however, two things that must be kept in mind when using this technique. First, since the AGB termination luminosity is a function of envelope mass, anything that changes the envelope mass will affect the luminosity evolution. In particular, these low surface gravity, high luminosity stars will undergo significant mass loss on the AGB. Theoretically, this mass loss can be parameterized in a number of ways, but the details of the evolution will be sensitive to the adopted mass loss law (see, for example, Appendix A of Gallart et al. 1996b). Second, upper-AGB evolution is rapid so that a reasonable sample of upper-AGB stars is required in order to provide a valid estimate of the AGB termination luminosity.
We will be concerned with estimating two quantities for these dwarf galaxies from our data: first, a limit on the age of the intermediate-age population from the luminosity of the brightest upper-AGB stars, and second, an estimate of the fraction of the total population of each dwarf that exists as intermediate-age stars. As discussed, for example, by Da Costa (1997), the Local Group dE galaxies show a large and surprising variety of intermediate-age population fractions, from essentially none in systems such as Ursa Minor to substantial in systems such as Carina, Fornax and Leo I. We begin with BK5N.
7.1 BK5N
For BK5N, the mean metal abundance and metal abundance dispersion derived in Sec. 6 suggest that it is unlikely that there are any stars in this dwarf galaxy with abundances exceeding [Fe/H] –1.0 (see also Fig. 10). Consequently, if the stellar population of BK5N consisted entirely of stars comparable in age to the Galactic globular clusters, then we would not expect to see any stars with luminosities above that of the red giant branch tip (e.g. Frogel & Elias 1988, Renzini 1992). Clearly this is not the case in Fig. 10 and we can immediately conclude that BK5N contains an intermediate-age population.
Using the bolometric corrections to I-band magnitudes from Da Costa & Armandroff (1990) and the distance modulus from Sec. 5, we have calculated bolometric magnitudes for the 14 stars brighter than I = 23.8 in Fig. 10. With the exception of one star at Mbol –4.9 which we will discuss shortly, the luminosity function of the other stars indicates that the AGB termination luminosity in BK5N is Mbol –4.3; 5 of the 13 stars have bolometric magnitudes at, or 0.2 mag fainter than, this value. There are two approaches to interpreting this value: empirical and theoretical. Empirically, we note that the value for BK5N is fainter than the luminosity of the brightest (upper-AGB) carbon stars in the Leo I and Carina Local Group dE’s, for which Azzopardi (1994) gives Mbol –4.5 and Mbol –4.6, respectively. Both these dE galaxies have substantial intermediate-age populations containing stars as young as a few Gyr (e.g. Lee et al. 1993c, Smecker-Hane et al. 1994). On the other hand Azzopardi (1994) lists Mbol –4.4 for the brightest carbon stars in Leo II. Mighell & Rich (1996) have concluded that this dE galaxy contains only stars older than 7 Gyr with a “typical” Leo II member having an age of 9 Gyr. Similarly, the brightest carbon star in the SMC cluster Kron 3, which has an age of 9 Gyr (Rich et al. 1984, Alcaino et al. 1996), has a luminosity of Mbol –4.2 (Frogel et al. 1990). All these stellar systems have mean abundances that are similar to BK5N. Thus it seems reasonable to conclude that BK5N, like many of the Local Group dE’s, has had an extended period of star formation, forming stars until 8 Gyr ago.
The single bright star (at I 22.6, V–I 1.7) in the BK5N c-m diagram, if a member, offers a somewhat different interpretation. This star is well isolated in the c-m diagram which might suggest non-membership. However, it is also a probable variable in that the V magnitudes for the two epochs differ by 0.17 mag, though the I magnitudes differ by only 0.01 mag. If it is a member, then it has Mbol –4.9, which, interpreted as an AGB termination luminosity, suggests an age of 2 – 3 Gyr. Unfortunately, there is no way at the present time we can definitely establish the membership of this star in BK5N.
The context for a theoretical interpretation of these results is provided by the Bertelli et al. (1994) isochrones, since these include the evolution of stars through the upper-AGB phase. However, it is not clear that at the metallicities appropriate for BK5N these isochrones offer much insight. As noted above, the AGB termination luminosity is dependent on the envelope mass, which is in turn determined by the mass loss rate. In the Bertelli et al. (1994) isochrones the mass loss rate at a fixed luminosity is a strong function of the effective temperature (i.e. radius) of the AGB star. Thus the relatively blue metal-poor AGB stars, as parameterized, undergo less significant mass loss as they ascend the AGB. Consequently, and particularly for the most metal-poor case which corresponds to the mean abundance of BK5N, the theoretical AGB tip luminosities are at Mbol –4.8 even for ages of 8 to 10 Gyr. Indeed, even for globular cluster like ages, the metal-poor Bertelli et al. (1994) isochrones have AGBs that extend well above the red giant branch tip, in conflict with the observations. Thus we have not used these isochrones to draw any inferences, from a theoretical viewpoint, concerning the BK5N upper-AGB population. It is worth noting though that the Marigo et al. (1996) calculations do suggest, from their Fig. 2, an age in excess of 6 Gyr for the BK5N upper AGB stars, since the observed AGB termination luminosity is fainter than Mbol –4.5. The calculations, however, were carried out at log(Z/Z☉) = –0.4, considerably higher than the mean abundance of BK5N.
As for estimating the relative contribution of the intermediate-age population to BK5N’s total luminosity, we follow the procedures outlined in Armandroff et al. (1993). This procedure makes use of the formalism developed by Renzini & Buzzoni (1986) for the V band in which the number of AGB stars expected from a total population characterized by a total luminosity LV is given by:
NAGB = 4 10-5 LV tAGB
Here NAGB is the number of upper-AGB stars per magnitude and tAGB is the upper-AGB evolutionary rate in Myr/mag. Using tAGB = 1.3 (Mould 1992) and MV = –11.3 (reduced by the fraction of the BK5N total luminosity contained on the PC frames, which is one-third), the 13 upper-AGB stars between 23.8 I 22.8 yield an intermediate-age population fraction for BK5N of 0.3 0.1. The error is simply the statistical error in the sample of BK5N upper-AGB stars. This intermediate-age population fraction is considerably larger than the 0.1 0.1 fractions calculated using this technique for the M31 dE companions And I and And III by Armandroff et al. (1993). It suggests that BK5N is perhaps analogous to other Local Group systems such as Carina and Leo I which have substantial intermediate-age populations. For example, in Carina the intermediate-age population fraction is directly observed to be of order 0.7 to 0.8 (Mighell 1990, Smecker-Hane et al. 1994). Clearly, whatever the mechanism for producing the significant extended star formation histories seen in these galaxies is, it is not restricted to Local Group dwarfs.
7.2 F8D1
As for BK5N we have used the I-band bolometric corrections from Da Costa & Armandroff (1990) and the distance modulus from Sec. 5 to calculate bolometric magnitudes for the bright red stars in Fig. 12. The most luminous of these stars have Mbol –5.0 (7 stars within 0.2 mag of this value) while the bolometric luminosity function shows a substantial rise at Mbol –4.4 (38 stars with –4.4 Mbol –4.2 versus 34 stars with –5.2 Mbol –4.4). These bolometric magnitudes are again similar to those for the more luminous stars in Local Group dE galaxies. Among the Galactic companions Fornax has upper-AGB carbon stars as luminous as Mbol –5.6 (Azzopardi 1994) while the M31 companion And II has upper-AGB stars with Mbol –4.5 (Aaronson et al. 1985). The brighter upper-AGB carbon stars identified by Richer et al. (1984) in NGC 205 also have Mbol –5.0. However, given the F8D1 mean metal abundance and abundance dispersion (cf. Sec. 6), interpreting the luminosities of these F8D1 stars in terms of age is not straightforward — we cannot conclude, as was done for BK5N, that all the F8D1 stars above the red giant branch tip have [Fe/H] –1.0 and that therefore they must be of intermediate-age (cf. Frogel & Elias 1988, Guarnieri et al. 1997).
It is worth illustrating this point by considering the Galactic globular cluster 47 Tuc ([Fe/H] = -0.7). This cluster contains at least 4 long period variable (LPV) AGB stars whose luminosities at maximum reach as bright as Mbol –4.8 (Frogel et al. 1981, adjusted to the distance modulus used in Da Costa & Armandroff 1990), well above the red giant branch tip. Further, even at minimum light, they remain somewhat above the red giant branch tip (Frogel et al. 1981). Yet there is no reason to suggest that these stars are any different in age from the rest of the cluster population. To further illustrate this point, 47 Tuc V2 near maximum light would have I 22.7, V–I 1.90, if it were at the distance of F8D1 (Lloyd-Evans 1983). These values are comparable to the brightest F8D1 stars in Fig. 12.
As a result, in order to investigate the possibility that F8D1 has an intermediate-age population, we must first estimate the possible numbers of luminous metal-rich, but old stars. Table 1 gives the total visual luminosity of F8D1 as MV = –14.25, though only 20% of this luminosity is contained on the overlapping WF frames from which Fig. 12 is drawn. Given the mean abundance and abundance dispersion from Sec. 6, we assume that one third of the luminosity of the galaxy comes from stars with [Fe/H] –0.9. Such a population has the capacity to produce LPVs above the red giant branch tip even if it consists entirely of old stars. We assume that such an old population will produce stars above the red giant branch tip at the same rate as 47 Tuc. This cluster apparently contains 5 AGB LPV stars (V1, V2, V3, V4 and V8; Frogel et al. 1981, Da Costa & Armandroff 1990) and the total visual luminosity of the cluster is MV –9.5. Together these assumptions predict 26 stars above the red giant branch tip in the fraction of F8D1 represented by Fig. 12. As noted above, these stars could have single epoch luminosities anywhere between Mbol = –3.8 and –4.8. However, in Fig. 12 there are 147 stars brighter than Mbol = –3.8. Thus, despite the concerns regarding luminous stars generated by an old metal-rich population, it does appear that there is a significant intermediate-age population in F8D1, just as there is in BK5N and in many of the Local Group dE galaxies.
With Mbol –5.0, the most luminous stars in F8D1 probably have ages of a few Gyr using either the LMC cluster data (e.g. Frogel et al. 1990, Mould & Da Costa 1988) for calibration, or through noting that the Galactic companion dE’s Fornax, Carina and Leo I have carbon stars of comparable luminosity together with populations of this age, identified from main sequence turnoff magnitudes (see, for example, Da Costa 1997). On the other hand, the brightest stars in F8D1 are 0.7 mag brighter than those in BK5N (putting aside the one bright BK5N star mentioned previously), and thus it would appear that the epoch of last significant star formation is different by perhaps 4 – 5 Gyr in these two M81 group dE galaxies. Again this highlights that the diversity of star formation histories seen in Local Group dE’s is not purely a “local” phenomenon, it clearly also extends to these M81 group dE’s.
We show in Fig. 15 the F8D1 observations superposed with AGB isochrones from the Bertelli et al. (1994) set. Evidently, at the relatively higher metallicity of F8D1, these isochrones do not suffer to the same extent from the problems described above in the case of BK5N. Two metallicities, which bracket the F8D1 mean abundance, are depicted as are two ages for each abundance. These data reinforce, as do the calculations of Marigo et al. (1996), our conclusion that F8D1 contains stars with ages as young as 3 – 4 Gyr. It is equally apparent though that a significant range of (intermediate) ages is present. The isochrones also show that age and abundance are to a large degree degenerate for the majority of the F8D1 stars above the red giant branch tip. Observations in the near-IR could help break this degeneracy and thus provide more insight into the extended star formation history of this dE galaxy.
As regards an estimate of the intermediate-age population fraction in F8D1, we again apply the equation given in Sec. 7.1. The bolometric luminosity function for F8D1 has 102 stars/mag over the interval –5.0 Mbol –4.0 which, after correcting for the possible old metal-rich contribution and the fraction of the total visual luminosity represented in Fig. 12, yields an intermediate-age fraction of 0.2. Alternatively, as noted above, there is a “step” in the F8D1 upper-AGB luminosity function at Mbol –4.4. If we restrict the number of stars to those between –4.4 Mbol –4.0, then after the same corrections, the intermediate-age fraction estimate for F8D1 is 0.35. The difference between these two values is undoubtedly a measure of the uncertainty in this technique. However, it is clear that the intermediate-age fraction in F8D1 is higher than that for the Local Group dE’s And I and And III, calculated with this technique (Armandroff et al. 1993). Further, there does not appear to be any significant difference between F8D1 and BK5N in this respect, though as noted above, the age of the youngest intermediate-age stars in F8D1 appears to be approximately one-half that in BK5N.
8 Globular Clusters
Globular clusters in dwarf ellipticals have received more attention in recent years than previously. For example, Durrell et al. (1996a,b) have studied globular clusters in the dwarf companion to NGC 3115 as well as in a number of dE galaxies in the Virgo cluster. They concluded that the mean specific frequency of occurrence of clusters in the dE’s is between 3 and 8, similar to that of giant ellipticals and higher than that of spirals. In accord with this result, the M31 companions NGC 147, NGC 185 and NGC 205 have typically a half dozen or so confirmed globular clusters associated with them (e.g. Da Costa & Mould 1988). Among the less luminous Local Group dE’s, the Fornax dwarf has 5 clusters and Sagittarius has 4, but none of the fainter dE’s have any known clusters. Assuming then that dE’s have 4 clusters per M in luminosity, we would expect to find around 2 globulars in F8D1, but none in BK5N. Galactic globulars have half-light radii in the range of 2 to 10 pc (see e.g., Djorgovski & Meylan 1994), so we would expect any globulars in our two dwarfs to have half-light radii in the range of 0.1 to 0.5˝. Thus such objects would be difficult to distinguish from stars in ground-based data, but such a task lies within the capabilities of HST.
We searched for globulars in these two galaxies by first checking the HST frames for appropriate resolved objects, and then measuring their colors. Cluster candidates were those objects whose colors and morphologies matched what we expect for clusters at the distance of these two galaxies. For F8D1 we are limited by the area covered by the HST images: only about 3/4 of the area out to Reff was observed (or about 15% of the area out to the limiting radius of the light profile) — an important shortcoming since the Fornax dwarf, for example, has some globulars out to 2Reff. Being much smaller, BK5N’s areal coverage was about 80% out to the limiting radius.
While no likely candidates were found in the images of BK5N, several candidates were identified in F8D1, one of which has both the color expected for a globular, and an appearance that matches that of a star cluster more than that of a background galaxy. In fact, it appears that stars in this object, which we have designated F8D1-GC1, are partially resolved. An enlargement of the HST image of this candidate is presented in Fig. 16, and Table 5 lists its basic data. The absolute magnitude and dereddened color ((V–I)0 0.72) of F8D1-GC1 are quite similar to those for the metal-poor ([Fe/H] –1.80) Galactic globular cluster NGC 4147, for example, for which the tabulation of Peterson (1993) yields MV –6.1 and (V–I)0 0.76. If we interpret the relatively blue (V–I)0 integrated color of F8D1-GC1 as indicating a low metal abundance (the alternative of a younger age seems less likely, though additional integrated colors are required to verify our assumption), then, given the mean metal abundance of the F8D1 field stars derived in Sec. 6, we have a further example of the result that the abundances of globular clusters in dE galaxies are generally significantly lower than that of the constituent field stars (Da Costa & Mould 1988, Durrell et al. 1996a,b).
Figure 17 shows the radial light profile of F8D1-GC1, along with that of a star on the same frame, and two King (1966) model profile fits. As regards the structural parameters given on Fig. 17, we note that at the distance of F8D1, log rcore = –0.8 corresponds to rcore 3 pc. The combination of central concentration c = log (rtidal / rcore ) 1.5, rcore 3 pc, and dereddened central surface brightness (0) 20.2 is not common among the Galactic globular clusters. However, some near analogs do exist in the compilation of Trager et al. (1993). For example, NGC 4590 has (c = 1.6, rcore = 1.9 pc, and (0) = 18.7) while NGC 2419 has (1.7, 8.4, and 19.6), respectively. Undoubtedly better estimates (or limits) on the structural parameters of F8D1-GC1 could be determined by fitting King (1966) models convolved with the stellar PSF, but such a task is beyond the scope of this paper.
In summary, we have found one good candidate globular cluster in F8D1, which is about what we would expect given the relatively high luminosity of F8D1 and the lack of coverage of the entire galaxy with the HST images. None were found in BK5N, again as we expected given the low luminosity of this galaxy.
9 Discussion
We now compare these two dwarf ellipticals with others from the Local Group that are equally well-studied. BK5N’s luminosity and surface brightness, as well as its mean metallicity and metallicity dispersion, place it well within the realm of the Local Group dwarfs: it is very similar in those respects to the Sculptor galaxy. The extreme size of F8D1, however, is not known in the Local Group for galaxies of its surface brightness. Its effective radius is in fact larger than any of the 15 known Local Group dwarf ellipticals (including NGC 205), by at least a factor of 3, and indeed is larger than that of the SMC and only 15% smaller than that of the LMC (Bothun & Thompson 1988). The radius of the recently discovered Sgr galaxy appears to be large, but an accurate number is not yet at hand (Ibata et al. 1997). Its large ellipticity (e 0.7) and small Galactocentric distance (16 kpc) suggest that the structure of Sgr has been modified by tidal interactions with the Galaxy.
Previously, galaxies like F8D1 have been found in the more numerous collections of dE’s that exist in the large galaxy clusters such as Virgo and Fornax, as studied by Sandage & Binggeli (1984), Impey et al. (1988) and Bothun et al. (1991). But they are rare even there. While Fig. 5 showed the location in the central surface brightness–luminosity diagram of the large, low surface brightness galaxies found by Impey et al., the density of points does not accurately represent the frequency of occurrence of the galaxies. As stated above, galaxies as large as F8D1 with central surface brightnesses of V represent less than 1% of the total number of galaxies in Virgo and Fornax at that surface brightness. Clearly, some physical process during formation drives most of these galaxies to smaller radii in the mean than we see in F8D1. Explaining how such large galaxies come about must involve the role of supernovae or stellar winds, and would appear to be a central problem for the formation of dwarf galaxies.
An additional diagnostic relation for dE’s is the relation between luminosity and metallicity (L–Z, here we assume that [Fe/H] measures Z), wherein the lower luminosity galaxies have correspondingly lower metallicities. Because lower luminosity galaxies also tend to have lower surface brightness, there is as well a general trend of metallicity with central surface brightness (e.g., Caldwell et al. 1992). Several authors have suggested that indeed it is the local mass density that determines the mean metallicity of a stellar population, rather than the total system mass (Phillipps et al. 1990; Franx & Illingworth 1990, the former commenting on dE’s, the latter on E’s). The galaxy F8D1 then provides a crucial test of this idea, for while it has a very low surface brightness, it is at the same time luminous, for a dwarf. Figure 18 shows the relation between L and Z for Local Group dE’s and the two M81 dwarfs for which we have new metallicities, as well as the relation between central surface brightness V0 and Z (values from Caldwell et al. 1992 and Armandroff et al. 1993, updated for the recent results of Da Costa 1994 and Mateo et al. 1993 for Carina, Da Costa et al. 1996 for And I, Lee et al. 1993c and Demers et al. 1994 for Leo I, Lee et al. 1993b for NGC 185, Konig et al. 1993 for And II, and Saviane et al. 1996 for Tucana).
BK5N, as expected, has a metallicity in accord with the relations defined by the Local Group galaxies, as a function of both luminosity and surface brightness. Once again, BK5N is quite similar in all respects to dwarf ellipticals in the Local Group. Thus, in spite of the different environments of the M81 group and the Local Group, dwarf galaxies of very similar properties are present in each.
F8D1 clearly falls near the L–Z relation but deviates significantly from the V0–Z relation. The parameters for the recently discovered Sgr dwarf would seem to place it off of the V0–Z relation as well, for it has a faint V0 (Ibata et al. 1997, Mateo et al. 1995), and yet a relatively high metallicity ([Fe/H] or higher; Mateo et al. 1995; Sarajedini & Layden 1995; Whitelock et al. 1996). However, the properties of Sgr have possibly been modified by interactions with the Galaxy (Velazquez & White 1995; Johnston et al. 1995). For this reason we have excluded Sgr from our presentation of the L–Z and V0–Z relations. Given its near circular isophotes, we have no reason to suspect that F8D1 has been significantly tidally perturbed by another galaxy, and thus no reason to question the low central surface brightness of F8D1 nor its total luminosity. Thus the location of F8D1 in Fig. 18 indicates that the total baryonic mass of a dwarf elliptical dictates the mean stellar metallicity attained, rather than the baryonic surface density.
Bender et al. (1993) showed that velocity dispersion (, meaning central well potential depth) was well correlated with the spectral index Mg2 for all E’s, giants and dwarfs alike. Likewise, Peterson & Caldwell (1993) found that [Fe/H] and were correlated for a small sample of dE’s alone. Using the –Mg2 relation, Bender et al. could then show from scaling relations that Mg log(M , where M is the total mass of the system (baryonic and dark matter), and is the average baryonic density. So that to the extent that Mg2 measures metallicity, this relation says that the total mass is indeed the dominant predictor of metallicity, but that density is important as well. If density was important in determining metallicity for dwarfs as well, we might expect to see a bivariate relation between Z, L and V0, for instance, which would point to the more fundamental relation between Z and . (The velocity dispersion for F8D1 would clearly be desirable in this analysis, but obtaining it is likely to be difficult). The data on dwarfs is limited, but it shows that the addition of a surface brightness term in the fit of L–Z does not improve the quality of the fit. In particular, the residual for F8D1 from the mean L–Z relation is no larger than for any of the other galaxies which have luminosities more typical for their surface brightnesses, so from the present data it appears that L alone predicts the metallicity for dE’s.
There appears to be no additional relation other than the L–Z and L–V0 relations that would help us to understand the formation of dwarfs. A possible relation between L and the Z dispersion, indicated by the high metallicity spread on the giant branches of Fornax and F8D1 and the low spread of Carina, is ruled out by the high metallicity spread of the low-luminosity Draco (Lehnert et al. 1992). Still, it would appear that our additional information should help in expanding the recent theoretical models of dwarf galaxy formation (Dekel & Silk 1986; Yoshii & Arimoto 1987; Navarro et al. 1996) to include the large, low surface brightness galaxies. In particular, these galaxies may help in defining the role that dark matter halos play in helping to retain gas that otherwise may be lost during star formation episodes in dwarfs.
Support for this work was provided by NASA through grant number GO-05898 from the Space Telescope Science Institute, which is operated by AURA, Inc., under NASA contract NAS5-26555.
References
- (1) Aaronson, M., Gordon, G., Mould, J., Olszewski, E., & Suntzeff, N. 1985, ApJ, 296, L7
- (2) Alcaino, G., Liller, W., Alvarado, F., Kravtsov, V., Ipatov, A., Samus, N., & Smirnov, O. 1996, AJ, 112, 2004
- (3) Armandroff, T. E. 1994, in “ESO/OHP Workshop on Dwarf Galaxies”, edited by G. Meylan and P. Prugniel (ESO, Garching), p. 211
- (4) Armandroff, T. E., Da Costa, G. S., Caldwell, N., & Seitzer, P. 1993, AJ, 106, 986
- (5) Azzopardi, M. 1994, in “The Local Group: Comparative and Global Properties”, edited by A. Layden, R. C. Smith and J. Storm (ESO, Garching), p. 129
- (6) Bender, R., Burstein, D., & Faber, S. M. 1993, ApJ, 411, 153
- (7) Bertelli, G., Bressan, A., Chiosi, C., Fagotto, F., & Nasi, E. 1994, A&AS, 106, 275
- (8) Binggeli, B. 1983, Habilitationsschrift, Universitat Basel
- (9) Borngen, F., & Karachentseva, V. E. 1982a, AN, 303, 189
- (10) Borngen, F., Karachentseva, V. E., & Karachentsev, I. D. 1984, AN, 305, 53
- (11) Borngen, F., Karachentseva, V. E., Schmidt, R., Richter, G. M., & Thanert, W. 1982b, AN, 303, 287
- (12) Bothun, G. D., Impey, C., & Malin, D. 1991, ApJ, 376, 404
- (13) Bothun, G. D., & Thompson, I. B. 1988, AJ, 96, 877
- (14) Burstein, D., & Heiles, C. 1982, AJ, 87, 1165
- (15) Caldwell, N., Armandroff, T. E., Seitzer, P., & Da Costa, G. S. 1992, AJ, 103, 840
- (16) Caldwell, N., & Bothun, G. D. 1987, AJ, 94, 1126
- (17) Da Costa, G. S. 1992, in “The Stellar Populations of Galaxies”, IAU Symposium 149, edited by B. Barbuy and A. Renzini (Kluwer, Dordrecht), p. 191
- (18) Da Costa, G. S. 1994, in “ESO/OHP Workshop on Dwarf Galaxies”, edited by G. Meylan and P. Prugniel (ESO, Garching), p. 221
- (19) Da Costa, G. S. 1997, in “The Second Stromlo Symposium: The Nature of Elliptical Galaxies”, ASP Conf. Ser. 116, edited by M. Arnaboldi, G. S. Da Costa and P. Saha (ASP, San Francisco), p. 270
- (20) Da Costa, G. S., & Armandroff, T. E. 1990, AJ, 100, 162
- (21) Da Costa, G. S., Armandroff, T. E., Caldwell, N., & Seitzer, P. 1996, AJ, 112, 2576
- (22) Da Costa, G. S., & Mould, J. R. 1988, ApJ, 334, 159
- (23) de Vaucouleurs, G. 1975, in “Galaxies and the Universe”, edited by A. Sandage, M. Sandage and J. Kristian (University of Chicago Press, Chicago), p. 557
- (24) Dekel, A., & Silk, J. 1986, ApJ, 303, 39
- (25) Demers, S., Irwin, M. J., & Gambu, I. 1994, MNRAS, 266, 7
- (26) Djorgovski, S., & Meylan, G. 1994, AJ, 108, 1292
- (27) Driver, S., Windhorst, R., & Griffiths, R. 1995, ApJ, 453, 48
- (28) Durrell, P. R., Harris, W. E., Geisler, D., & Pudritz, R. E. 1996a, AJ, 112, 972
- (29) Durrell, P. R., McLaughlin, D. E., Harris, W. E., & Hanes, D. A. 1996b, ApJ, 463, 543
- (30) Eggen, O. J. 1972, ApJ, 172, 639
- (31) Franx, M., & Illingworth, G. 1990, ApJ, 359, L41
- (32) Freedman, W., et al. 1994, ApJ, 427, 628
- (33) Frogel, J. A., & Elias, J. H. 1988, ApJ, 324, 823
- (34) Frogel, J. A., Mould, J. R., & Blanco, V. M. 1990, ApJ, 352, 96
- (35) Frogel, J. A., Persson, S. E., & Cohen, J. G. 1981, ApJ, 246, 842
- (36) Gallart, C., Aparicio, A., Bertelli, G., & Chiosi, C. 1996b, AJ, 112, 1950
- (37) Gallart, C., Aparicio, A., & Vilchez, J. M. 1996a, AJ, 112, 1928
- (38) Guarnieri, M. D., Renzini, A., & Ortolani, S. 1997, ApJ, 477, L21
- (39) Han, M., et al. 1997, AJ, 113, 1001
- (40) Holtzman, J., et al. 1995, PASP, 107, 1065
- (41) Huchtmeier, W. K., & Skillman, E. D. 1994, in “ESO/OHP Workshop on Dwarf Galaxies”, edited by G. Meylan and P. Prugniel (ESO, Garching), p. 299
- (42) Ibata, R. A., Wyse, R. F. G., Gilmore, G., Irwin, M. J., & Suntzeff, N. 1997, AJ, 113, 634
- (43) Impey, C., Bothun, G., & Malin, D. 1988, ApJ, 330, 634
- (44) Irwin, M., & Hatzidimitriou, D. 1995, MNRAS, 277, 1354
- (45) Johnston, K. V., Spergel, D. N., & Hernquist, L. 1995, ApJ, 451, 598
- (46) Kaluzny, J., Kubiak, M., Szymanski, M., Udalski, A., Krzeminski, W., & Mateo, M. 1995, A&AS, 112, 407
- (47) Karachentseva, V. E., Karachentsev, I. D., & Borngen, F. 1985, A&AS, 60, 213
- (48) Karachentseva, V. E., Schmidt, R., & Richter, G. M. 1984, AN, 305, 59
- (49) Kennicutt, R., Keel, W., van der Hulst, J. M., Hummel, E., & Roettiger, K. 1987, AJ, 93, 1011
- (50) King, I. R. 1966, AJ, 71, 64
- (51) Konig, C. H. B., Nemec, J. M., Mould, J. R., & Fahlman, G. G. 1993, AJ, 106, 1819
- (52) Kraan-Korteweg, R. C., & Tammann, G. A. 1979, AN, 300, 181
- (53) Lee, M. G., Freedman, W. L., & Madore, B. F. 1993a, ApJ, 417, 553
- (54) Lee, M. G., Freedman, W. L., & Madore, B. F. 1993b, AJ, 106, 964
- (55) Lee, M. G., Freedman, W. L., Mateo, M., Thompson, I., Roth, M., & Ruiz, M.-T. 1993c, AJ, 106, 1420
- (56) Lee, Y.-W., Demarque, P., & Zinn, R. 1990, ApJ, 350, 155
- (57) Lehnert, M. D., Bell, R. A., Hesser, J. E., & Oke, J. B. 1992, ApJ, 395, 466
- (58) Lloyd-Evans, T. 1983, S. Afr. Astron. Obs. Circ., 7, 86
- (59) Marigo, P., Girardi, L., & Chiosi, C. 1996, A&A, 316, L1
- (60) Mateo, M., Olszewski, E. W., Pryor, C., Welch, D. L., & Fischer, P. 1993, AJ, 105, 510
- (61) Mateo, M., Udalski, A., Szymanski, M., Kaluzny, J., Kubiak, M., & Krzeminski, W. 1995, AJ, 109, 588
- (62) Mighell, K. J. 1990, A&AS, 82, 1
- (63) Mighell, K. J., & Rich, R. M. 1996, AJ, 111, 777
- (64) Minniti, D., & Zijlstra, A. A. 1996, ApJ, 467, L13
- (65) Mould, J. R. 1992, in “The Stellar Populations of Galaxies”, IAU Symposium 149, edited by B. Barbuy and A. Renzini (Kluwer, Dordrecht), p. 181
- (66) Mould, J. R., & Da Costa, G. S. 1988, in “Progress and Opportunities in Southern Hemisphere Optical Astronomy”, ASP Conf. Ser. 1, edited by V. M. Blanco and M. M. Phillips (ASP, San Francisco), p. 197
- (67) Mould, J. R., Kristian, J., & Da Costa, G. S. 1983, ApJ, 270, 471
- (68) Navarro, J. F., Eke, V. R., & Frenk, C. S. 1996, MNRAS, 283, L72
- (69) Peterson, C. J. 1993, in “Structure and Dynamics of Globular Clusters”, ASP Conf. Ser. 50, edited by S. G. Djorgovski and G. Meylan (ASP, San Francisco), p. 337
- (70) Peterson, R. C., & Caldwell, N. 1993, AJ, 105, 1411
- (71) Phillipps, S., Edmunds, M. G., & Davies, J. I. 1990, MNRAS, 244, 168
- (72) Piatek, S., & Pryor, C. 1995, AJ, 109, 1071
- (73) Renzini, A. 1992, in “The Stellar Populations of Galaxies”, IAU Symposium 149, edited by B. Barbuy and A. Renzini (Kluwer, Dordrecht), p. 325
- (74) Renzini, A., & Buzzoni, A. 1986, in “Spectral Evolution of Galaxies”, edited by C. Chiosi and A. Renzini (Kluwer, Dordrecht), p. 195
- (75) Rich, R. M., Da Costa, G. S., & Mould, J. R. 1984, ApJ, 286, 517
- (76) Richer, H. B., Crabtree, D. R., & Pritchet, C. J. 1984, ApJ, 287, 138
- (77) Rosino, L. 1978, Vistas in Astronomy, 22, 39
- (78) Sagar, R., Hawkins, M. R. S., & Cannon, R. D. 1990, MNRAS, 242, 167
- (79) Sandage, A. 1976, AJ, 81, 954
- (80) Sandage, A., & Binggeli, B. 1984, AJ, 89, 919
- (81) Sarajedini, A., & Layden, A. C. 1995, AJ, 109, 1086
- (82) Saviane, I., Held, E. V., & Piotto, G. 1996, A&A, 315, 40
- (83) Sersic, J. L. 1968, Atlas de galaxias australes (Observatorio Astronomico, Cordoba)
- (84) Smecker-Hane, T. A., Stetson, P. B., Hesser, J. E., & Lehnert, M. D. 1994, AJ, 108, 507
- (85) Solinger, A., Morrison, P., & Markert, T. 1977, ApJ, 211, 707
- (86) Suntzeff, N. 1993, in “The Globular Cluster - Galaxy Connection”, ASP Conf. Ser. 48, edited by G. H. Smith and J. P. Brodie (ASP, San Francisco), p. 167
- (87) Trager, S. C., Djorgovski, S., & King, I. R. 1993, in “Structure and Dynamics of Globular Clusters”, ASP Conf. Ser. 50, edited by S. G. Djorgovski and G. Meylan (ASP, San Francisco), p. 347
- (88) van Driel, W., Kraan-Korteweg, R. C., Binggeli, B., & Huchtmeier, W. K. 1997, A&AS, in press
- (89) Velazquez, H., & White, S. D. M. 1995, MNRAS, 275, L23
- (90) Whitelock, P. A., Irwin, M., & Catchpole, R. M. 1996, New Astronomy, 1, 57
- (91) Yoshii, Y., & Arimoto, N. 1987, A&A, 188, 13
- (92) Yun, M. S., Ho, P. T. P., & Lo, K. Y. 1994, Nature, 372, 530
- (93) Zinn, R. 1993, in “The Globular Cluster - Galaxy Connection”, ASP Conf. Ser. 48, edited by G. H. Smith and J. P. Brodie (ASP, San Francisco), p. 302


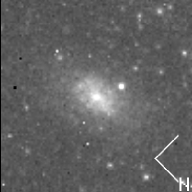


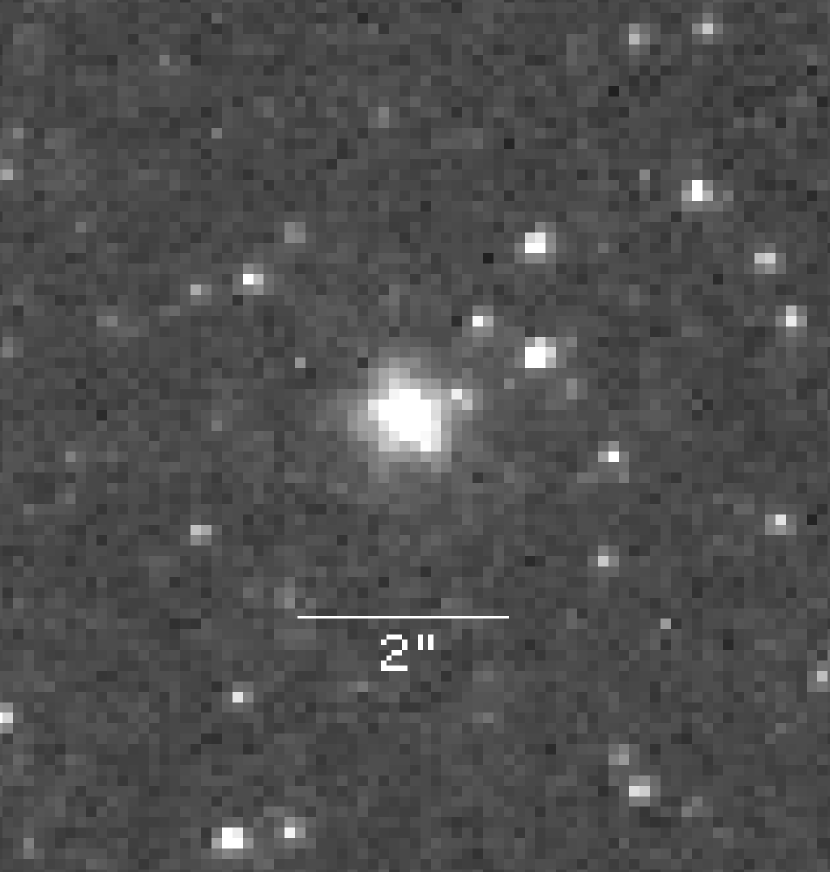


| BK5N | F8D1 | |
|---|---|---|
| RA (2000) | 10:04:41.1 | 9:44:47.1 |
| Dec (2000) | 68:15:22 | 67:26:19 |
| Vtot | ||
| MV | –11.33 | –14.25 |
| B–V | ||
| 0.4 | 0.0 | |
| V0 | ||
| S0 | ||
| (˝) | ||
| n | ||
| Reff (˝) | 20 | 127 |
| Reff (pc) | 370 | 2450 |
| Rc (˝) | ||
| E(B-V) | 0.048 | 0.032 |
| (m–M)0 |
| Visit 1 | Visit 2 | |||||
|---|---|---|---|---|---|---|
| date | F555W | F814W | date | F555W | F814W | |
| BK5N | 1996Feb22 | s | s | 1996Jun9-11 | s | s |
| F8D1 | 1996Feb23 | s | s | 1996Apr17 | s | s |
| galaxy | N | |||||
|---|---|---|---|---|---|---|
| F8D1 | 23.00 | 16 | 0.011 | 0.019 | 0.037 | 0.038 |
| F8D1 | 23.50 | 54 | 0.016 | 0.029 | 0.048 | 0.049 |
| F8D1 | 24.00 | 174 | 0.024 | 0.037 | 0.061 | 0.062 |
| F8D1 | 24.50 | 399 | 0.034 | 0.040 | 0.080 | 0.081 |
| F8D1 | 25.00 | 570 | 0.052 | 0.062 | 0.111 | 0.117 |
| F8D1 | 25.50 | 431 | 0.077 | 0.077 | 0.151 | 0.155 |
| F8D1 | 26.00 | 187 | 0.110 | 0.115 | 0.203 | 0.210 |
| BK5N | 23.50 | 8 | 0.014 | 0.023 | 0.033 | 0.045 |
| BK5N | 24.00 | 32 | 0.020 | 0.027 | 0.040 | 0.040 |
| BK5N | 24.50 | 78 | 0.027 | 0.032 | 0.053 | 0.062 |
| BK5N | 25.00 | 90 | 0.042 | 0.044 | 0.076 | 0.080 |
| BK5N | 25.50 | 86 | 0.062 | 0.066 | 0.107 | 0.105 |
| BK5N | 26.00 | 47 | 0.085 | 0.092 | 0.143 | 0.146 |
| ID | I | V–I | V | I | |||
|---|---|---|---|---|---|---|---|
| BK5N Variables (T=109 days) | |||||||
| 1300-1 | |||||||
| 1803-1 | |||||||
| 1839-1 | |||||||
| 1943-1 | |||||||
| BK5N Probable Variables | |||||||
| 519-2 | |||||||
| 1069-1 | |||||||
| 1170-1 | |||||||
| 1353-1 | |||||||
| 1372-1 | |||||||
| 1436-1 | |||||||
| 1540-1 | |||||||
| 1661-1 | |||||||
| F8D1 Variables (T=56 days) | |||||||
| 603-4 | |||||||
| 708-4 | |||||||
| 899-2 | |||||||
| 978-2 | |||||||
| 1118-4 | |||||||
| 1201-2 | |||||||
| 1372-1 | |||||||
| 1360-2 | |||||||
| 1457-1 | |||||||
| 1515-2 | |||||||
| 1535-2 | |||||||
| 1731-3 | |||||||
| 1796-3 | |||||||
| 1808-3 | |||||||
| 1977-2 | |||||||
| 2227-2 | |||||||
| 2482-2 | |||||||
| 2918-2 | |||||||
| F8D1 Probable Variables | |||||||
| 616-4 | |||||||
| 667-4 | |||||||
| 686-4 | |||||||
| 723-3 | |||||||
| 796-3 | |||||||
| 815-4 | |||||||
| 858-4 | |||||||
| 872-3 | |||||||
| 976-4 | |||||||
| 999-4 | |||||||
| 1000-4 | |||||||
| 1069-2 | |||||||
| 1090-2 | |||||||
| 1095-2 | |||||||
| 1149-2 | |||||||
| 1168-2 | |||||||
| 1329-4 | |||||||
| 1337-2 | |||||||
| 1382-4 | |||||||
| 1399-3 | |||||||
| 1411-2 | |||||||
| 1432-3 | |||||||
| 1445-2 | |||||||
| 1463-1 | |||||||
| 1615-1 | |||||||
| 1621-1 | |||||||
| 1629-3 | |||||||
| 1657-2 | |||||||
| 1689-1 | |||||||
| 1835-2 | |||||||
| 1845-3 | |||||||
| 2078-2 | |||||||
| 2088-3 | |||||||
| 2110-2 | |||||||
| 2218-3 | |||||||
| 2467-3 | |||||||
| 2511-2 | |||||||
| 2516-2 | |||||||
| RA (2000) | Dec (2000) | V | MV | V–I |
|---|---|---|---|---|
| 9:44:39.2 | 67:26:06 |