Spectrum and Variability of Mrk501 as observed by the CAT
Imaging Telescope
A. Djannati-Ataï1 for the CAT Collaboration
1LPNHE Paris University 6&7, 4 Place Jussieu - T33 RdC, 75252
Paris Cedex 05, France
Abstract
The CAT Imaging Telescope has observed the BL Lac object Markarian 501 between March and August 1997. We report here on the variability over this time including several large flares. We present also preliminary spectra for all these data, for the low emission state, and for the largest flare.
1. Introduction and Data Sample
Several groups have reported strong emission from Mrk501 at this workshop. The CAT Imaging Telescope, operating since October 1996 and (described in Rivoal et al. 1997), is located in the French Pyrenees (42,5∘ N, 2∘ E) at an altitude of 1650 m. It has a mirror area of 17 m2 with a fine grained imaging camera (546 pixels, each 0.12∘ for these data) and a threshold energy of 220 GeV. Between March and August 1997 a total of 80 hours of data were taken on Mrk501 with 25 hours of control region (OFF) data. As the performance of the telescope at large zenith angles is still under investigation, the data used for the variability study were limited to those at less than 25∘ from Zenith, and for the spectral analysis at less than 10∘ (16.58 hours).
2. Analysis method
A standard moment-based (“SuperCuts”) analysis has been used for the study of Mrk501’s light curve (section 3). The cuts used are lower than for other detectors, taking advantage of the CAT telescope’s very high resolution imaging camera, as follows:
| 0.7 | Width | 1.5 | (mrad) | ||
| 2.0 | Length | 5.0 | (mrad) | ||
| 2.0 | Distance | (mrad) | |||
| 30 | Size | (p.e.) | |||
| 9 | (deg.) |
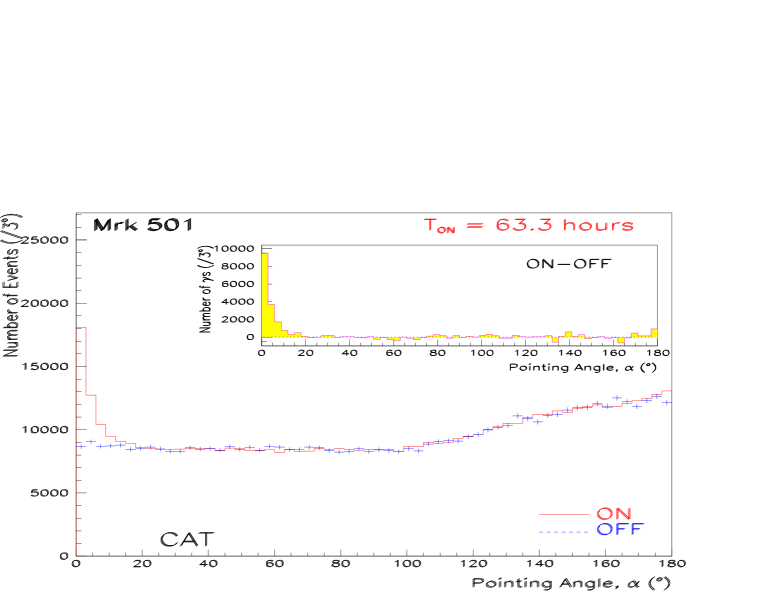
A new method has been developed for the CAT telescope (Lebohec 1996 & Lebohec et al. 1995) which provides directly the energy of the incident -ray; this has been used in the spectral analysis. The method uses a maximum-likelihood fit to the images of an analytical model for -shower images. The image is given by the model as a function of primary energy, impact parameter (R), angular source position in the field of view and azimuthal position of the image about the source. Minimization of the fit provides an estimate of these parameters. In addition, the minimized value gives a criterion for selection of good -ray candidates. The orientation angle in this method is defined (between 0 and 180∘) as the angle at the image centre between the expected source position and reconstructed source position. Figure 1 shows the clear signal in the alpha plot of the data from Mrk501 at less than 25∘ from Zenith.
The origin of each gamma shower on the celestial sphere can be reconstructed event by event to 0.16∘. The energy resolution obtained with this method is 20%, independent of energy from 200 GeV to 10 TeV.
Three cuts are used for the spectral analysis (derived from simulations to optimize the number of -ray candidates):
| 0.2 | |||||
| 40.0 | R | (metres) | |||
| 9 | (deg.) |
3. Source Variability and Light Curve
The nightly flux levels (expressed in gamma-rays per minute uncorrected for cut efficiencies) for Mrk501 between March 7 and August 8 1997 are shown in figure 2. During this period the average flux was higher than that of the Crab Nebula, with the highest flare over 6 times greater. Variability on a day time-scale is evident in this figure; shorter time variations are still under study.

Figure 3 shows the remarkable agreement between the data from three observatories (CAT, Whipple, and HEGRA) for the April period. The data from each experiment have been rescaled as they have different thresholds and observatory altitudes. This demonstrates also the utility/necessity of having several observatories to follow continuously such variable sources.

4. Differential Energy Spectra
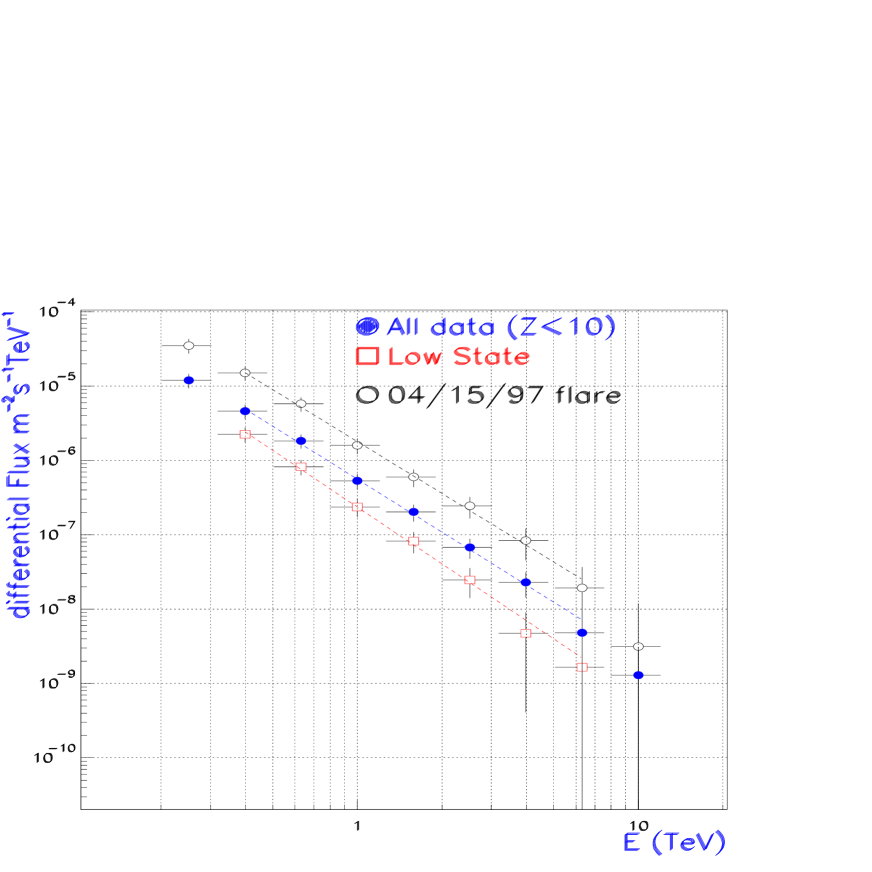
The acceptance area and the cut efficiency were derived from detailed Monte Carlo simulations as a function of energy and zenith angle. These, combined with the energies from the maximum-likelihood fit, allow differential energy spectra to be obtained. Spectra from Mrk501 are shown in figure 4 (for data less than 10∘ from Zenith): for all data, for the data for which the source was in a low state, and for the largest flare on the night of April 15-16th. A maximum-likelihood fit of a power law to the spectrum of these data gives for all data:
| (1) |
The corresponding flux and index for the low state data are and , and for the largest flare and .
The errors in these formula are statistical only as the systematics studies are underway. Within statistical errors the spectrum index seems compatible with a constant hardness of the source. A cross-check of these values by the standard SuperCuts analysis yields closely compatible results both for flux values and spectral indices. The spectra appear to be harder than that of the Crab Nebula (given in Goret et al., 1997). In this dataset alone, there is a 4.7 signal at energies above 7 TeV; if the cut on is relaxed the signal increases to 6.3 above 7 TeV, with 4.8 above 10 TeV. Further studies using the data taken at high Zenith angle should extend the spectral coverage to higher energies.
5. Conclusions
The source Markarian 501 entered a very active phase in 1997, with several large flares during which it became the brightest object in the VHE -ray sky. This unusual behaviour has been detected by the CAT imaging telescope and several other groups. The intensity of the emission provides data which are exteremely rich in -rays, useful both for testing of the detector capabilities and investigation of the highest-energy part of the spectrum. At the time of writing the source has been seen to be still active in data taken at high Zenith angle.
References
-
Rivoal R.M., et al., 1997, Proc. 25th ICRC, 5, 89
-
Lebohec, S., 1996, Doctoral Thesis
-
Lebohec, S., et al., 1995, Proc. “Towards a Major Atmospheric Čerenkov Detector IV”, ed. M. Cresti , 378
-
Fegan, D.J., 1997, private communication
-
Lorenz, E., 1997, private communication
-
Goret, P., 1997, this workshop