OH SATELLITE LINE MASERS IN THE NUCLEUS OF NGC 253
Abstract
We report the detection of 1720 and 1612 MHz OH ground–state satellite line maser regions in the starburst galaxy NGC 253. We find ten compact maser features all of which are located along the narrow ridge of bright radio continuum emission within the central 10 square arcseconds of the nucleus. The compact OH features appear physically associated with regions of dense molecular gas, supernova remnants, and HII regions. The data for several of the features are consistent with collisional inversion from the interaction of supernova remnant shocks with molecular gas, similar to that found for Galactic supernova remnants (Frail et al. 1996). For many other features near the nucleus of NGC 253, we find conjugate behavior in the 1720 and 1612 MHz lines, with one line showing stimulated emission and the other showing stimulated absorption. These results suggest the importance of infrared pumping associated with the active star formation in NGC 253 and is consistent with large column densities of molecular gas (N[H cm-2).
1 INTRODUCTION
To date, the observations of extragalactic OH masers have been mainly associated with the 1667 and 1665 MHz main–line OH transitions. The very first detections of extragalactic molecules were made in absorption for these transitions in NGC 253 and M82 (Weliachew 1971). Subsequent observations of NGC 253 revealed a strong narrow 1667 MHz emission line which was explained as maser amplification of the nuclear continuum source (Whiteoak & Gardner 1973). Extremely luminous 1667 and 1665 MHz OH megamasers () have since been found in several bright IRAS galaxies (Baan, Wood, & Haschick 1982; Mirabel & Sanders 1987; Kazes & Baan 1991; Staveley–Smith et al. 1992) and are believed to result from the pumping of the nuclear molecular gas by far–infrared photons (Baan 1989; Randell et al. 1995).
Although the 1720 and 1612 MHz satellite–line transitions have received considerably less attention than the main–line transitions, new research indicates that the satellite–lines may provide an additional diagnostic of the nuclear regions in starburst galaxies. Recently, Frail et al. (1996) have found a population of 1720 MHz OH masers associated with Galactic supernova remnants (SNRs). The passage of SNR shocks through dense molecular clouds () is expected to produce strong 1720 MHz masers via collisional pumping (Elitzur 1976). For starburst galaxies which have large concentrations of molecular gas and numerous supernova remnants, we could expect to find a significant population of 1720 MHz masers. Also for active galaxies, we could expect to detect conjugate emission and absorption in the 1720 and 1612 MHz lines. Such behavior has recently been reported for Centaurus A and indicates the pumping of large column densities of molecular gas from a strong source of far–infrared radiation (van Langevelde et al. 1995). Sources showing similar behavior in other galaxies could, perhaps, be a signpost for the AGN with a molecular gas torus, as suggested for the 1612 MHz OH maser source in M82 (Seaquist, Frayer, & Frail 1997).
In this paper we report on VLA high resolution 1720 and 1612 MHz satellite–line OH observations of the nearby starburst galaxy NGC 253. NGC 253 is a nearby (D 3 Mpc) edge–on spiral galaxy which has an unusually high rate of star formation in the central nuclear region (Rieke et al. 1980). Radio continuum observations have revealed a large population of compact sources, presumably supernovae, SNRs, and HII regions associated with the star formation (Turner & Ho 1985; Antonucci & Ulvestad 1988; Ulvestad & Antonucci 1991). Recently, Ulvestad & Antonucci (1997) [UA97] have compiled a list of 64 distinct compact sources using subarcsecond radio observations to resolve many of the sources. These radio observations suggest that about half of the sources are dominated by thermal emission associated with HII regions, and half are SNRs dominated by nonthermal emission (UA97). The distribution of nuclear SNRs and HII regions is similar to that of the brightest HCN (Paglione, Tosaki, & Jackson 1995) and CS (Peng et al. 1996) emission regions in NGC 253, implying that the nuclear star formation is associated with the dense molecular gas. The typical densities estimated from the HCN and CS observations are , and the total mass of the dense molecular gas exceeds and accounts for 17% of the dynamical mass in the central regions of NGC 253 (Peng et al. 1996). The combination of a large number of SNRs and a massive component of dense molecular gas suggests that NGC 253 is an ideal candidate for searching for 1720 MHz OH masers associated with the shock interactions of SNRs with molecular clouds. In addition, it is an ideal candidate for searching for conjugate OH satellite lines toward the nucleus due to the large OH column densities and high radiation fields in this region.
2 OBSERVATIONS AND DATA REDUCTION
NGC 253 was observed in the two OH satellite lines at 1720.527 MHz and 1612.231 MHz on 17 November 1996, using the Very Large Array of the National Radio Astronomy Observatory.111The National Radio Astronomy Observatory is a facility of the National Science Foundation, operated under a cooperative agreement by Associated Universities, Inc. The observations of NGC 253 were made in the highest resolution configuration (A–array) of the VLA and provided an order of magnitude improvement in the spatial resolution over the previous OH study of NGC 253 (Turner 1985). High resolution observations were desired to search for the possible association of maser regions with discrete radio sources within the complex nuclear region.
The phase reference used for the radio observations was the nuclear position of (B1950); (B1950), and the observed frequencies were centered on a LSR velocity of 200 km s-1, similar to the systemic LSR velocity of 229 km s-1 derived from CO observations (Canzian, Mundy, & Scoville 1988). We observed using a 3.125 MHz correlator bandwidth divided into 128 spectral channels, resulting in a velocity resolution of 4.3 km s-1and 4.5 km s-1 at 1720 MHz and 1612 MHz respectively. In addition to the line data, we recorded the continuum data which represents the mean over the central 75% of the bandwidth. We observed only right handed circular polarization at each frequency. For primary flux and passband calibration, we observed 0137+331 and 0542+498. The radio source 0118–216 was used as the secondary phase and gain calibrator.
The data were calibrated according to standard VLA procedures using the AIPS software package. The continuum data were first carefully analyzed to flag (u,v) visibilities showing interference. Considerable editing was required for the 1612 MHz data due to interference from the GLONASS satellite system (Combrinck, West, & Gaylard 1994). After standard passband, phase, and gain calibration of the continuum data, we improved the data slightly by self–calibrating on the strong continuum of NGC 253. The line data were edited and calibrated by applying the flagging commands and the calibration solutions derived for the continuum data.
The continuum was subtracted from the line data in the (u,v) plane using the AIPS task UVLIN222Words in capitals denote standard procedures in AIPS. which linearly interpolates the continuum across the region showing line emission. Since the 1720 and 1612 MHz line features are weak compared to the strong continuum, several different methods were used to test the reliability of the continuum subtraction. In summary UVLIN produced results similar to those of IMLIN which subtracts the continuum in the image plane. For subtraction in the (u,v) plane, the task UVLIN proved to be far superior to UVBAS in removing artifacts from bright continuum sources, since UVLIN fits the real and imaginary parts of the visibility data instead of fitting the amplitudes and phases (Cornwell, Uson, & Haddad 1992).
Continuum maps and continuum–free line cubes were made at both frequencies using the AIPS task IMAGR. For the strong continuum emission, CLEAN algorithms were used, while for the line data only “dirty” cubes (no CLEAN components) were made. We used both natural and robust visibility weighting to produce the images. Robust weighting is a compromise between uniform and natural weighting (Briggs 1995) which increases the spatial resolution at the expense of increasing the noise level. By adopting a robustness parameter of zero, we improved the image resolution by approximately 40% at the expense of increasing the rms noise by 20%. The rms of the natural weighted 1720 MHz data is 1.2 mJy, while the 1612 MHz rms is 2.0 mJy, due to the higher interference at 1612 MHz. Interestingly, the rms noise at 1612 MHz does not degrade with robust weighting. Upon further analysis we found that the low level interference affects the data on the shorter baselines to a larger degree which could account for the noise characteristics of the 1612 MHz data with different (u,v) weighting. By using robust–weighting, we achieved a synthesized beam size of and at 1720 MHz and 1612 MHz respectively.
3 RESULTS
We show the 1720 and 1612 MHz natural–weighted channel maps in Figures 1&2. The complexity of the OH emission and absorption features in the nuclear region of NGC 253 is readily apparent. The peak features have narrow line widths and the limits on their brightness temperature of T K (T) are consistent with maser action. The OH features follow the general sense of the CO rotation curve (Canzian et al. 1988). Since NGC 253 is viewed nearly edge–on, the gas is spread over a broad range of velocities (100–300 km s-1) at the nuclear position. The position–velocity distribution of the brightest OH features lie predominately along the inner orbits of the bar potential described by Peng et al. (1996).
In order to improve our sensitivity to the extended weak structures seen in Figure 1&2, we have convolved the data to . At the position of the brightest continuum emission ([B1950]; [B1950]), we find evidence for conjugate emission and absorption in the 1720 and 1612 MHz lines (Fig. 3). To test for exact conjugate behavior, i.e., equal but opposite line strengths, we smoothed the 1720 MHz data to match the frequency resolution of 1612 MHz data cube. We find conjugate behavior over all velocities at the nuclear position of NGC 253 (Fig. 3). As we move off the nuclear position, we do not find this conjugate signature over all velocities. These results indicate a tendency for conjugate behavior in the two satellite lines near the nucleus which may be due to large column densities of OH and far–infrared pumping from the nuclear activity, as seen in Cen A (van Langevelde et al. 1995).
The individual spectral–line channel maps were inspected to search for significant emission and absorption features. In Table 1 we list the ten OH features found to have peak emission or absorption line strengths greater than five times the rms noise in the 1720 or 1612 MHz robust–weighted channel maps. The positions, peak fluxes, and velocities of these features were determined by Gaussian fits to the data. All of the features were unresolved, suggesting angular source sizes of . The reported errors are , and the upper flux density limits are .
The locations of the ten detected OH features are shown in Figure 4 along with the positions of the compact radio sources given by UA97. All ten of the features are located within the central 10 square arcseconds of NGC 253 and are confined along the narrow ridge of the brightest radio continuum emission. Since the probability of finding a point by chance in the central 10 square arcseconds of the spectral–line cubes is only , assuming Gaussian noise statistics, all ten features are likely to be associated with real structures. We measure a position angle axis for the OH features of which is significantly smaller than the position angle of derived for the CO bar (Canzian et al. 1988) and the value of found for the near–infrared bar (Forbes & DePoy 1992). However, the position angle of axis for the OH features is consistent with that of the optical disk (Pence 1981) and that of the brightest central CS and HCN emission regions (Peng et al. 1996; Paglione et al. 1995).
In Figures 5–14 we plot the 1720 and 1612 MHz spectra at the position of the ten features given in Table 1. Many of the features appear as narrow lines superimposed on a broader weak structure. The broader structure could represent the combination of many unresolved maser regions. If the broad structure is fitted and subtracted from the data, the remaining narrow lines for features (5), (8), (9), and (10) are less than in significance. However, since features (9) and (10) show structure at the same velocities in both the 1720 and 1612 MHz data, we conclude that these features are real. The 1720 MHz narrow features of (5) and (8) do not show conclusive evidence for a corresponding line at 1612 MHz, and it is possible that these features are merely noise superimposed on the underlying broad structure.
Several of the features show evidence for opposite behavior in the 1720 and 1612 MHz lines, with one line in emission and the other in absorption. To test for conjugate line strengths, we convolved the 1720 MHz data to match the frequency and spatial resolutions of 1612 MHz data cube. The summation and difference of the 1720 and 1612 MHz data at each position is shown in Figures 5–14. Within the uncertainties of the data, many of the features have conjugate line strengths. We discuss the individual features in detail in Sec. 4.3.
4 DISCUSSION
4.1 Comparison with Previous OH Studies of NGC 253
Early single–dish observations detected the presence of OH maser activity in NGC 253 (Whiteoak & Gardner 1973; Gardner & Whiteoak 1975). The single–dish data showed broad absorption in all four ground–state transitions and narrow 1667 MHz emission features (Gardner & Whiteoak 1975). Turner (1985) vastly improved upon the spatial resolution of the single–dish work by mapping all four ground–state OH lines with the VLA in C–array () using low velocity resolution (35 km s-1). Most significantly, Turner found a nuclear outflow plume extending 1.5 kpc above the equatorial plane in all of the OH lines, except the 1720 MHz line. Turner also detected broad central absorption at all four transitions, but the 1612 MHz absorption was weaker than the single–dish feature suggesting that the absorption is extended and was partially resolved by the VLA. In our higher resolution data, we find even weaker central absorption, consistent with extended gas being responsible for the majority of the absorption.
For detailed comparisons we have tapered the (u,v) range and convolved the data to match the synthesized beam sizes for the data of Turner (1985). Unfortunately, we lack the sensitivity required to detect the plume at 1612 MHz due to low level interference on short–baselines (Sec. 2). We do not have these interference problems at 1720 MHz. At 1720 MHz Turner (1985) report an emission region located approximately southwest of the nucleus at 140–175 km s-1. We fail to confirm this feature in our data convolved to matched the resolution of Turner’s data. Instead, we find emission at similar velocities (Fig. 3) located at the nuclear position. Since the strength of this emission ( mJy) in our high–resolution data is similar to that seen in the single–dish data (Gardner & Whiteoak 1975), we conclude that the bulk of this emission arises from compact sources (i.e., consistent with many masers covering the velocity range).
4.2 Origin of the OH Features
All of the ten detected OH features (Table 1) have narrow line widths, are unresolved at arcsecond resolution, and have brightness temperatures of T K. These properties suggest that maser action is the likely origin for the OH features. Assuming a maser origin, the monochromatic luminosities of Jy kpc2 () for the masers in NGC 253 are two to three orders of magnitude more luminous than the observed Galactic satellite–line masers (Gaume & Mutel 1987; Frail et al. 1994; Yusef–Zadeh et al. 1996). This could be indicative of several components within the 20 pc projected synthesized beam diameter or could be due to the high continuum level in NGC 253. The high luminosities of the satellite lines in NGC 253 may not be unusual for extragalactic systems. In fact, the lines in NGC 253 are relatively weak in comparison to those seen in Cen A which are a factor of 50–100 times more luminous (van Langevelde et al. 1995).
As noted earlier, the locations of the OH emission and absorption features all lie along the bright central ridge of the radio continuum emission associated with SNRs and HII regions (UA97), as well as near young stellar clusters (Watson et al. 1996). Interestingly, the distribution of the OH features are more narrowly confined than the radio source distribution (Fig. 4). Assuming that the radio continuum emission and infrared radiation are well correlated, as expected in star–forming galaxies (Condon 1992), these results may suggest that the strong infrared radiation fields have a large influence on the existence of the OH masers. The OH features also appear to be coexistent, both spatially and kinematically, with regions of dense molecular gas traced by the HCO+ (Carlstrom et al. 1990), HCN (Paglione et al. 1995), and CS molecules (Peng et al. 1996). The association of the OH features with dense molecular gas and regions of star–formation leads to several possible mechanisms for producing the masing activity in the central nuclear regions of NGC 253. Both collisional and infrared pumping mechanisms are possible due to the high gas densities and strong infrared fields. We summarize the various satellite–line signatures for the likely mechanisms producing the OH maser features below.
We expect at least three different mechanisms for producing OH maser activity in the nuclear regions of NGC 253: (1) collisionally pumped regions from SNR shocks, (2) radiatively pumped regions near sources of strong far–infrared fields, and (3) combined mechanisms associated with compact HII regions. Method (1) has been proposed to explain the 1720 MHz masers associated with Galactic SNRs interacting with molecular clouds (Frail, Goss, & Slysh 1994; Frail et al. 1996). When the shock wave from a SNR propagates into a molecular cloud, the gas is heated, and the 1720 MHz line can be inverted from collisions of the OH molecules with H2. Elitzur (1976) showed that the 1720 MHz OH line is strongly inverted () by collisions for a range of molecular gas densities of cm-3 and temperatures of T K, which is consistent with the conditions expected in the post–shocked gas. In addition, fast SNR shocks photodissociate the H2 and induce chemical reactions that enhance the OH abundance in the post–shocked material (Hollenbach & McKee 1989). The studies of the nuclear molecular gas in NGC 253 indicate warm gas and high gas densities (Wall et al. 1991; Paglione et al. 1995) which are sufficient for collisional inversion. Since the high H) to CO ratios suggest the importance of shocked gas due to SNRs in the central regions of NGC 253 (Prada et al. 1996), we could expect a significant fraction of the OH molecules to be collisionally inverted. For the collisionally pumped scenario at temperatures K, we would observe a strong 1720 MHz line in emission, and no associated 1612 MHz feature.
Radiative pumps can produce strong satellite line masers, as seen for example in the 1612 MHz masers associated with OH/IR stars (e.g., Booth et al. 1981). In conditions where the 1720 and 1612 MHz lines compete for the same infrared pumping photons associated with the rotational transitions between the ground state () and the first excited levels of () and (), the 1720 and 1612 MHz lines show conjugate behavior, with one line showing stimulated emission and the other showing stimulated absorption (Elitzur 1992). Such behavior has been observed in the nuclear regions of NGC 4945 (Whiteoak & Gardner 1975), and more recently in Cen A (van Langevelde et al. 1995) and M82 (Seaquist et al. 1997). When the OH molecules are predominately pumped by the rotational intraladder transition at 119, the 1720 MHz line shows stimulated emission while stimulated absorption is seen in the 1612 MHz line. The reverse occurs if the cross–ladder rotational transition at 79 provides significant pumping. The dominant pumping transition depends on the OH column density. For OH column densities of cm-2 km-1 s, the 119 transition becomes optically thick, and the 1720 MHz line is in emission while the 1612 MHz line is in absorption. At OH column densities higher than approximately cm-2 km-1 s, the 79 transition becomes optically thick producing 1612 MHz in emission and 1720 MHz in absorption (van Langevelde et al. 1995). Assuming line–widths of order 1 km s-1 and typical OH/H2 abundance ratios of order (Langer & Graedel 1989), the transitional OH column density of cm-2 km-1 s corresponds to a H2 column density of cm-2. This column density is similar to the average H2 column density of cm-2 implied by the CO data for NGC 253 (Canzian et al. 1988) and is a typical value for active galaxies. This is an interesting result. There is no reason to expect, a priori, the transitional OH column density to correspond with the column densities found in active galaxies. It is possible that the conjugate behavior seen previously in Cen A (van Langevelde et al. 1995) and found here for NGC 253 (Fig. 3) is common for the molecular–rich centers of most galaxies that have strong infrared fields.
Since the convolved data at the nuclear position clearly shows conjugate behavior (Fig. 3), the variation in the line strengths could be interpreted as a variation in the molecular column density. In this scenario, the low velocity gas (100–180 km s-1) showing 1720 MHz emission would represent gas with OH column densities less than the transitional value of cm-2 km-1 s, while the gas at velocities of 230–300 km s-1 showing 1612 MHz emission would have OH column densities higher than the transitional value. The broad 1720 and 1612 MHz emission features in Figure 3 are consistent with the velocities of the two bright features in the CS position–velocity diagram (Fig. 6 of Peng et al. 1996). Although there is qualitative agreement, the CS data do not show an increase in the molecular column density as a function of velocity at the nuclear position, as suggested by the simple interpretation of the OH data. Perhaps, these results indicate variations of the CS/OH abundance ratio in NGC 253.
A third proposed origin for producing the OH features in NGC 253 is associated with compact HII regions. Until this decade the observations have been way ahead of the theoretical interpretation of OH masers associated with HII regions. However, detailed theoretical work in the last ten years has vastly improved our understanding of the important physical processes (e.g., collisions, infrared radiation, local line overlap, nonlocal line overlap, and accelerated and decelerated flows) involved in star–forming regions (Cesaroni & Walmsley 1991; Gray, Doel, & Field 1991; Gray, Field, & Doel 1992; Pavlakis & Kylafis 1996a; Pavlakis & Kylafis 1996b). Although early work by Elitzur (1976) suggested that radiative pumps could not produce strong 1720 MHz masers, the more recent work including the effects of infrared line overlap contradict these findings. The combination of radiative pumps with other processes, such as line overlap, can at least qualitatively explain many of the observed OH features seen in HII regions (e.g., Cesaroni & Walmsley 1991). Numerous OH maser transitions have been detected in Galactic HII regions (Gaume & Mutel 1987; Reid & Moran 1981 and references therein), showing a variety of different line ratios. Under LTE with low OH optical depths, we would expect line ratios of 1:1:5:9 for the ground state OH transitions of 1612, 1720, 1665, 1667 MHz, respectively. These ratios are rarely seen. For HII regions the 1665 MHz is typically stronger by approximately an order of magnitude over the other three ground state transitions (Reid & Moran 1981).
4.3 Individual OH features
In this subsection we discuss the correspondence of the ten individual compact OH features with discrete radio sources listed in UA97 and the implications for the origin of their maser action. Feature (1) is near the radio source designated 5.45-42.8 (UA97). It is seen in absorption against the background continuum at 1612 MHz and shares a velocity component with nearby feature (2) showing emission at 1720 MHz. Feature (2) is coincident with the second strongest radio source in NGC 253, 5.48-43.3, which is thought to be one or more SNRs with a radio luminosity of 20 times that of Cas A (UA97). The low–velocity side of feature (2) shows conjugate behavior in the satellite lines. The high–velocity side shows excess emission at 1720 MHz, as seen in the summation of the 1612 and 1720 MHz data (Fig. 6). Although somewhat speculative, these results could suggest that the high–velocity component is due to 1720 MHz inversion via SNR shock induced collisional pumping and that the low–velocity component arises from infrared pumping which would be consistent with the conjugate behavior seen in the satellite lines (Sec. 4.2).
Feature (3) is positionally coincident with the compact radio source 5.54-42.2 which is likely an HII region due to its flat spectral index (UA97). The velocity and position of feature (3) also agrees with that of HCN complex #7 (Paglione et al. 1995) and CS complex C (Peng et al. 1996). Both the 1612 MHz and 1720 MHz lines are seen at similar levels of emission for feature (3) which is consistent with the observations of some Galactic OH/HII regions (Gaume & Mutel 1987). If feature (3) is associated with an HII region, we could expect OH main–line emission from this source. Although there is no evidence for narrow 1665 MHz emission, the single–dish data do show a narrow 1667 MHz emission feature at the correct velocity of approximately 260 km s-1 (Gardner & Whiteoak 1975). Further VLA A–array observations at 1667 MHz are required to test whether this emission is located at the position of feature (3).
The remaining features (4)–(10) are associated with the molecular HCN regions #5&6 (Paglione et al. 1995) and CS complex B (Peng et al. 1996). Feature (4) is located near the bright HII complex 5.72-40.1, which is similar to the central regions of 30 Doradus (UA97). It is detected only in emission at 1720 MHz implying that collisional pumping is a possible mechanism for the inversion. Since the average molecular conditions in NGC 253 are similar to those required for collisional inversion, this feature could merely represent a region of slightly enhanced temperatures and densities from weak shocks or bulk motions associated with the local star–formation activity, not necessarily strong SNR shocks.
Feature (6) is coincident with the radio source 5.76-39.7. It shows strong emission at 1612 MHz and evidence for weaker 1720 MHz absorption. These line characteristics are consistent with radiative pumping and conjugate OH optical depths of , similar to that seen in the strong OH maser source detected in M82 (Seaquist et al. 1997). Since the 1612 MHz emission is stronger than the corresponding 1720 MHz absorption, we can derive the OH optical depth. Assuming conjugate OH optical depths (), the ratio of the observed line intensities is . The line intensity ratio of for feature (6) implies an optical depth of . This OH optical depth suggests a OH column density of cm-2 km-1 s. Since the narrow peak of feature (6) has a line width of approximately 10 km s-1 and assuming , we estimate that cm-2. By using the limit on the radio source size of pc for 5.76-39.7 (UA97), we derive a density of cm-3. This high molecular gas density is consistent with the association of feature (6) with the HCN and CS emission regions. The velocity of feature (6) is also very close to the velocity of the strongest 1667 MHz line seen in the single–dish data (Gardner & Whiteoak 1975). As for feature (3), observations with the VLA in A–array at 1667 MHz would confirm or refute the association of the 1667 MHz emission regions with the satellite–line sources detected here.
The data for features (5), (7), (9), & (10) are consistent with conjugate line strengths within the uncertainties of the data. Feature (5) is near 5.75-39.9 which has an unknown radio spectral index. The position of feature (7) is coincident with 5.78-39.4 which has a steep spectral index, implying that one or more SNRs is the origin for the majority of the radio emission. Feature (7) is also very near the suspected AGN of NGC 253 (5.79-39.0, UA97; TH2, Turner & Ho 1985). Feature (9) is coincident with 5.85-38.7, which has an unknown spectral index, and feature (10) is not coincident with any strong compact radio source. The fact that all of these sources appear to show conjugate line strengths suggests this behavior is pervasive throughout the central regions of NGC 253.
Feature (8) has a broad underlying component with conjugate behavior in the satellite lines, but the peak shows excess 1720 MHz emission. Since feature (8) is located among a collection of SNRs, it is possible that the excess 1720 MHz emission peak is due to collisional inversion from the SNR shocks. However, this interpretation is questionable since the feature could merely represent a noise channel on top of the broader conjugate feature (Sec. 2).
Although many of the details in the above discussion are fairly speculative, it appears that the OH features detected in NGC 253 represent several different types of sources. We find examples of sources consistent with 1720 MHz inversion associated with SNRs, as seen for Galactic SNRs (Frail et al. 1996). We also find examples of OH maser activity associated with HII regions. However, most of the detected sources cannot simply be categorized as SNRs or HII regions. Given that the luminosities of the OH features are two to three orders of magnitude more luminous than their Galactic counterparts, the OH maser sources detected here could represent a collection of ten or more unresolved sources. The broad low–level emission and absorption seen throughout the central regions may also be due to many maser regions. These observations appear to show a prevailing tendency for conjugate behavior in the satellite–lines which is likely due to pumping from the strong infrared radiation fields associated the star–formation activity in NGC 253. It is also interesting to note that the regions showing excess emission at 1612 MHz, which implies sources with the largest OH column densities, are located nearest to the AGN (seen at km s-1 in the spectra of features [6], [7], & [8]).
5 Conclusions
We have detected several compact 1720 MHz and 1612 MHz OH features in the nuclear region of NGC 253. These features are likely OH maser regions associated with the star–formation activity in NGC 253. The OH features appear physically associated with the dense molecular gas and several compact SNRs and HII regions. Although we find evidence for 1720 MHz maser activity consistent with collisional inversion due to the interaction of SNRs with the molecular gas, as proposed for Galactic SNRs (Frail et al. 1996), these regions are not the dominant source of OH satellite–line masers in NGC 253. Instead, we find conjugate behavior in the satellite lines that is pervasive throughout the nuclear regions of NGC 253. These results suggest that radiative pumping is the dominant mechanism for inverting the OH molecules. The conjugate signature may be common for the centers of most active galaxies, since this behavior probes the appropriate temperature, density, and molecular column density regimes typically found in active galaxies.
This research was supported by a grant to E.R.S. from the Natural Sciences and Engineering Research Council of Canada.
References
- (1)
- (2) Antonucci, R. R. J., & Ulvestad, J. S. 1988, ApJ, 330, L97
- (3)
- (4) Baan, W. A. 1989, ApJ, 338, 804
- (5)
- (6) Baan, W. A., Wood, P. A. D., & Haschick, A. D. 1982, ApJ, 260, L49
- (7)
- (8) Booth, R. S., Kus, A. J., Norris, R. P., & Porter, N. D.1981, Nature, 290, 382
- (9)
- (10) Briggs, D. S. 1995, BAAS, 27, 1444
- (11)
- (12) Canzian, B., Mundy, L. G., Scoville, N. Z. 1988, ApJ, 333, 157
- (13)
- (14) Carlstrom, J. E., Jackson, J. M., Ho, P. T. P., & Turner, J. L. 1990, in The Interstellar Medium in External Galaxies (Washington, DC: NASA), 337
- (15)
- (16) Cesaroni, R., & Walmsley, C. M. 1991, A&A, 241, 537
- (17)
- (18) Combrinck, W. L., West, M. E., & Gaylard, M. J. 1994, PASP, 106, 807
- (19)
- (20) Condon, J. J. 1992, ARA&A, 30, 575
- (21)
- (22) Cornwell, T. J., Uson, J. M., & Haddad, N. 1992, A&A, 258, 583
- (23)
- (24) Elitzur, M. 1976, ApJ, 203, 124
- (25)
- (26) Elitzur, M. 1992, Astronomical Masers (Dordrecht: Kluwer)
- (27)
- (28) Forbes, D. A., & DePoy, D. L. 1992, A&A, 259, 97
- (29)
- (30) Frail, D. A., Goss, W. M., Reynoso, E. M., Giacani, E. B., Green, A. J., & Otrupcek, R. 1996, AJ, 111, 1651
- (31)
- (32) Frail, D. A., Goss, W. M., & Slysh, V. I. 1994, ApJ, 424, L111
- (33)
- (34) Gardner, F. F., & Whiteoak, J. B. 1975, MNRAS, 173, 77P
- (35)
- (36) Gaume, R. A., & Mutel, R. L. 1987, ApJS, 65, 193
- (37)
- (38) Gray, M. D., Doel, R. C., & Field, D. 1991, MNRAS, 252, 30
- (39)
- (40) Gray, M. D., Field, D., & Doel, R. C. 1992, A&A, 262, 555
- (41)
- (42) Hollenbach, D., & McKee, C. F., 1989, ApJ, 342, 306
- (43)
- (44) Kazes, I. & Baan, W. A. 1991, A&A, 248, L15
- (45)
- (46) Langer, W. D., & Graedel, T. E. 1989, ApJS, 69, 241
- (47)
- (48) Mirabel, I. F., & Sanders, D. B. 1987, ApJ, 322, 688
- (49)
- (50) Paglione, T. A. D., Tosaki, T., & Jackson, J. M. 1995, ApJ, 454, L117
- (51)
- (52) Pavlakis, K. G., & Kylafis, N. D. 1996a, ApJ, 467, 300
- (53)
- (54) Pavlakis, K. G., & Kylafis, N. D. 1996b, ApJ, 467, 309
- (55)
- (56) Pence, W. D. 1981, ApJ, 247, 473
- (57)
- (58) Peng, R., Zhou, S., Whiteoak, J. B., Lo, K., Y., & Sutton, E. C. 1996, ApJ, 470, 821
- (59)
- (60) Prada, F., Manchado, A., Canzian, B., Peletier, R. F., McKeith, C. D., & Beckman, J. E. 1996, ApJ, 458, 537
- (61)
- (62) Randell, J., Field, D., Jones, K. N., Yates, J. A., & Gray, M. D. 1995, A&A, 300, 659
- (63)
- (64) Reid, M. J., & Moran, J. M. 1981, ARA&A, 19, 231
- (65)
- (66) Rieke, G. H., Lebofsky, M. J., Thompson, R. I., Low, F. J., & Tokunaga, A. T. 1980, ApJ, 238, 24
- (67)
- (68) Seaquist, E. R., Frayer, D. T., & Frail, D. A. 1997, ApJL (in press)
- (69)
- (70) Staveley–Smith, L., Norris, R. P., Chapman, J. M., Allen, D. A., Whiteoak, J. B., & Roy, A. L. 1992, MNRAS, 258, 725
- (71)
- (72) Turner, B. E. 1985, ApJ, 299, 312
- (73)
- (74) Turner, J. L., & Ho, P. T. P. 1985, ApJ, 299, L77
- (75)
- (76) Ulvestad, J. S., Antonucci, R. R. J. 1991, AJ, 102, 875
- (77)
- (78) Ulvestad, J. S., Antonucci, R. R. J. 1997 (UA97), ApJ (in press)
- (79)
- (80) van Langevelde, H. J., van Dishoeck, E. F., Sevenster, M. N., & Israel, F. P. 1995, ApJ, 448, L123
- (81)
- (82) Wall, W. F., Jaffe, D. T., Israel, F. P., & Bash, F. N. 1991, ApJ, 380, 384
- (83)
- (84) Watson, A. M., et al. 1996, AJ, 112, 534
- (85)
- (86) Weliachew, L. 1971, ApJ, 167, L47
- (87)
- (88) Whiteoak, J. B., & Gardner, F. F. 1973, Ap. Letters, 15, 211
- (89)
- (90) Whiteoak, J. B., & Gardner, F. F. 1975, ApJ, 195, L81
- (91)
- (92) Yusef-Zadeh, F., Roberts, D. A., Goss, W. M., Frail, D. A., & Green, A. J. 1996, ApJ, 466, L25
- (93)
The natural–weighted channel maps for the 1720 MHz OH satellite line in NGC 253. The radio LSR velocity in km s-1 is given in upper–right corner of each panel, and the synthesized beam is shown in the upper–left panel. The contour levels are 1 mJy/beam, and the 1 rms is 1.2 mJy/beam.
The natural–weighted channel maps for the 1612 MHz OH satellite line in NGC 253. The contour levels are 1 mJy/beam, and the 1 rms 2.0 mJy/beam. As in Figure 1, the radio LSR velocity in km s-1 is given in upper–right corner of each panel, and the synthesized beam is shown in the upper–left panel.
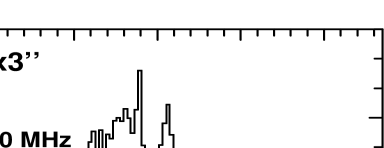
The spectra at the position of the brightest continuum emission ([B1950]; [B1950]) for the convolved () natural–weighted data. In the lower spectra, the solid line is the sum of the 1720 MHz (upper spectrum) and 1612 MHz (middle spectrum) data, while the dotted line represents their difference. These results demonstrate the conjugate behavior of the satellite lines near the nucleus of NGC 253.
The 1720 MHz continuum map of NGC 253. The positions of discrete radio sources from Ulvestad & Antonucci (1997) are given as cross symbols, and the locations of the candidate maser regions (Table 1) are shown as diamond symbols in the magnified image of the nucleus. The contour levels are are 1 mJy/beam(1, 3, 5, 7, 9, 15, 20, 30, 50, 70, 90, 110).
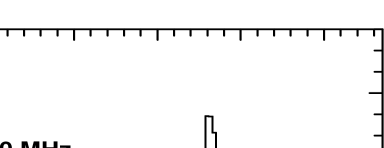
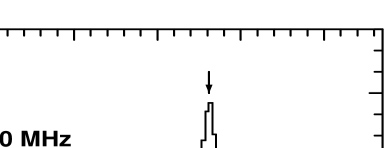
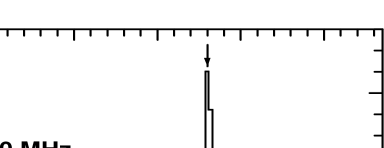
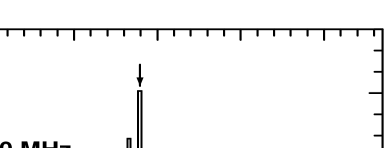
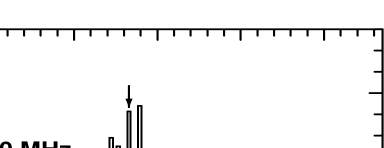
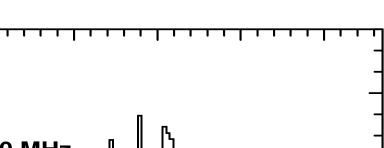
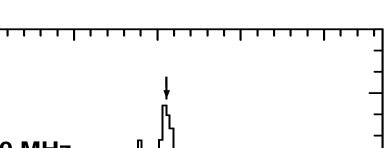
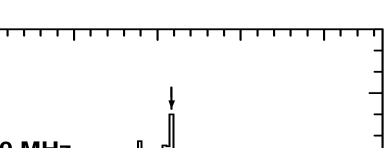
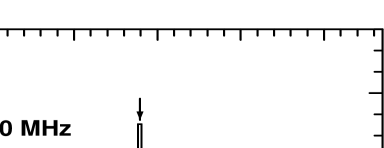
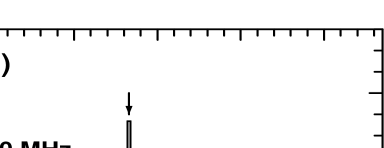
The 1720 MHz (upper spectrum) and 1612 MHz (middle spectrum) spectra at the position for feature (1) listed in Table 1. The velocity of this feature is marked by an arrow. The solid line in the lower spectra represents the sum of the 1720 and 1612 MHz data, while the dotted line represents their difference.
The spectra for feature (2) as described in Figure 5.
The spectra for feature (3) as described in Figure 5.
The spectra for feature (4) as described in Figure 5.
The spectra for feature (5) as described in Figure 5.
The spectra for feature (6) as described in Figure 5.
The spectra for feature (7) as described in Figure 5.
The spectra for feature (8) as described in Figure 5.
The spectra for feature (9) as described in Figure 5.
The spectra for feature (10) as described in Figure 5.
| Feature | (B1950) | (B1950) | 1720 Line | 1612 Line | Velocity |
|---|---|---|---|---|---|
| () | () | (mJy) | (mJy) | ( | |
| 1 | |||||
| 2 | |||||
| 3 | |||||
| 4 | |||||
| 5 | |||||
| 6 | |||||
| 7 | |||||
| 8 | |||||
| 9 | |||||
| 10 |