A High Resolution ROSAT X-Ray Study of Abell 4059
Abstract
We present the analysis of ROSAT HRI and PSPC X-ray data on the compact cD type cluster Abell 4059. The central cD galaxy hosts the strong radio source PKS2354-35. The central portion of the X-ray image shows two statistically significant X-ray emission minima and an orthogonal X-ray bar. As is the case in NGC 1275, the radio lobes in PKS2354-35 lie perpendicularly to the X-ray bar and extend into the two X-ray minima. One suggestion is that the radio lobe plasma has displaced the X-ray plasma and created the X-ray holes. The radio plasma and the X-ray gas do have comparable pressures in the radio lobe area. However, the available radio images do not show radio emission which extends far enough to fill the two X-ray holes. An alternative scenario for the anti-correlated radio and X-ray structure is an rotating disk in the cooling flow region of Abell 4059.
The ROSAT HRI surface brightness profile shows that there is a cooling flow around the central cD galaxy with a cooling rate of yr-1 within a radius of 156 kpc. However, the ROSAT PSPC spectrum of the central regions does not require a cooling flow, and gives an upper limit to the cooling rate of yr-1 (90% confidence level). The X-ray spectra of the central region indicate very little intrinsic absorption in the cluster, with an upper limit of cm-2 for excess absorption in front of the cluster emission at the center of the cooling flow.
On large scales, the cluster shows interesting spatial alignment between the major axes of the X-ray emission, cD galaxy, and the cluster potential. This is consistent with the anisotropic merger model for the formation of cD galaxies and the orientation of cD galaxy radio sources.
Subject headings:
galaxies: clusters: individual: Abell 4059 — cooling flows — radio continuum: galaxies — cD galaxies1. INTRODUCTION
The Abell cluster A4059 is compact and dominated by a central cD galaxy ESO 349-G010. The cluster is classified as richness 1 and is at a redshift of 0.0487 (Abell, Corwin, & Olowin 1989; Green, Godwin, & Peach 1990, hereafter GGP; Schwartz et al. 1991). The cluster is not well studied in optical. Of the 284 galaxies which have been identified as candidates for membership in the cluster, only 11 galaxies have known redshifts (Green et al. 1988, 1990). The redshift of the cD galaxy appears to be consistent with the cluster mean velocity within the measurement errors (Green et al. 1990), which may indicate that the cluster has achieved a somewhat relaxed state.
The central cD galaxy hosts the radio galaxy PKS2354-35, with a total radio power of ergs s-1 (Schwartz et al. 1991; Taylor et al. 1994). A VLA A-array observation at 8.4 GHz (Taylor et al. 1994) showed that the radio galaxy has a double-lobe structure extending along the major axis of the host galaxy. The alignment of the radio structure, cD major axis, and the overall cluster elongation is an intriguing feature, which may help us understand the formation and evolution of cD galaxies and the radio sources associated with these galaxies (West 1994).
Observations with and EXOSAT (Edge & Stewart 1991; Schwartz et al. 1991; Edge, Stewart, & Fabian 1992) have established that the cluster is a bright X-ray source with strong cooling flow around the central cD galaxy. Recent ASCA observation also revealed a possible chemical abundance gradient around the central cD galaxy (Ohashi 1995). A similar feature has been seen in a few other clusters, such as the Centaurus, AWM7 (Ohashi 1995), and Virgo clusters (Matsumoto 1994).
Excess soft X-ray absorption has been seen in the X-ray spectra of the central regions in a number of cooling flow clusters of galaxies. A4059 is near the southern galactic pole (galactic latitude of ) with a low galactic neutral hydrogen column density of cm-3 (Stark et al. 1992). This makes A4059 a good case for studying intrinsic X-ray absorptions.
In this paper, we will first analyze the spatial properties of the global X-ray emission of the cluster (§ 3). We then investigate the X-ray spectral properties of the gas, such as the gas temperature distribution and the intrinsic absorption in the center of the cluster, using ROSAT PSPC archival data (§ 4). The detailed X-ray structure near the cD galaxy will be compared to the radio emission from the cD galaxy in § 5. Finally, we summarize the main results (§ 6). Throughout the paper, we have assumed a Hubble constant of 50 km s-1 Mpc-1 and = 0.5.
2. OBSERVATIONS AND DATA REDUCTION
The cluster A4059 was observed with the ROSAT HRI (High Resolution Imager) on 6 October, 1993, for 6263 seconds in four observation intervals (OBIs). The observation was centered at the cD galaxy PKS2354-35. The data reduction was done using the standard PROS package. The data was first examined for periods of high background, and about 140 seconds was removed. Vignetting and background corrections were applied. A4059 has a relatively small angular size (see Fig. 2; Green et al. 1990). The X-ray emission from the cluster is well confined within the ROSAT HRI FOV ( in diameter). Thus, we can determine the X-ray emission background from within the HRI field; the background region is chosen to be an annulus centered at the cD galaxy PKS2354-35 with the inner and outer radii being 700′′ to 900′′, respectively.
In order to provide spectral information to complement the HRI spatial data, we retrieved the ROSAT PSPC observation of A4059. The cluster was observed for 5514 seconds on 21-22 November, 1991 (observation WP800175; PI: R. Schwarz). We first removed periods of high background from this data (Master Veto rate ). This resulted in a rejection of 107 seconds of exposure time. The spectral fitting of the data was done using the XSPEC package.
The pointing accuracy of the ROSAT HRI is important to our discussion of the central X-ray and radio structures in the cluster (§ 5.2). Unfortunately, there are no ideal X-ray reference sources with accurate optical or radio positions in the HRI field to calibrate the X-ray pointing accuracy. The SB galaxy, ESO 349-G009 (about to the north of the cD galaxy) may be associated with an X-ray source, but the X-ray emission is extended, which makes the position measurement of the X-ray source and the correct optical correspondence uncertain. There are several other galaxies to the southeast of the cD galaxy (Fig. 2) which may also have X-ray emission, but these X-ray sources are too weak for their positions to be determined accurately. Thus, we rely on the absolute positions provided by the aspect solution of the star camera on ROSAT. Based on previous experience, the HRI X-ray images presented in this paper could have an absolute position error of up to about . We discuss the relative alignment of the optical, radio, and X-ray images in more detail in § 5.1.
3. GLOBAL X-RAY SPATIAL ANALYSIS
3.1. Global X-Ray Structure
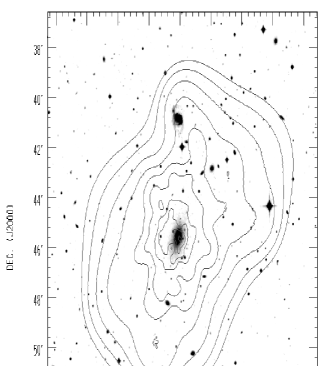
As reported by EXOSAT (Schwartz et al. 1991) and ASCA (Ohashi 1995), the X-ray emission from the cluster is concentrated near the cD galaxy, PKS2354-35. Figure 1 shows the ROSAT HRI image of the entire cluster superposed on an optical image from the Digitized Sky Survey. The X-ray image was corrected for background and vignetting, and was adaptively smoothed with a signal-to-noise ratio of 5 per smoothing beam using our adaptive kernel image smoothing routine (AKIS; Huang & Sarazin 1996).
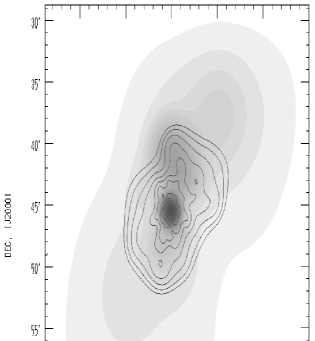
To better compare the global X-ray and optical properties of the cluster, we also produced a smoothed galaxy optical surface brightness image of the cluster, which is shown superposed on the contours of the X-ray emission in Figure 2. In the smoothed optical surface brightness image, each galaxy was weighted by its -band optical luminosity, and the image was then adaptively smoothed with at least 25 average galaxy luminosities per smoothing beam. The galaxy positions and luminosities are from GGP. We note that of the total of 284 galaxies listed as cluster members by GGP, only 11 galaxies have the measured redshifts. Therefore, some of the galaxies in the GGP sample may be nonmember galaxies seen in projection against the cluster.
Although the large scale X-ray image of A4059 is elongated with NNW to SSE, there also is some evidence for a concentration in the emission directly north of the central cD galaxy PKS2354-35. In Figure 1, this secondary peak appears in the general direction of the SB galaxy ESO 349-G009. With a blue magnitude of 14.6 (GGP), this is the second brightest galaxy in the cluster. In the HRI image, there is a broad peak in this region. The feature is stronger in the ROSAT PSPC image, but the X-ray centroid lies about to the south of the galaxy. ESO 349-G009 was classified by Buta (1995) as a ring-type galaxy, which may indicate an interaction with another galaxy and/or strong star formation. In fact, the galaxy is a powerful IRAS source (IRAS 23544-3457) with a luminosity from 40 to 120 m of L⊙ (IRAS Point Source Catalog 1988). The galaxy is also a radio source with a flux density of mJy at the 1.4 GHz band from the NVSS (Condon et al. 1993), which corresponds to W Hz-1 at the galaxy redshift (). The infrared and radio fluxes are consistent with the general correlation found for starburst galaxies (Condon 1992). If ESO 349-G009 is the source of the extra X-ray emission to the north of the cluster center, then its X-ray luminosity is approximately ergs s-1. All of these properties are consistent with a strong starburst in ESO 349-G009. This galaxy may be similar to NGC 6045 in the Hercules cluster (Huang & Sarazin 1996). This may indicate that there exist a class of spiral galaxies in galaxy clusters which are currently undergoing strong star formation at a rate 10 times that of M 82.
Alternatively, Figure 2 suggests that there is a peak in the galaxy distribution to the north of the cluster center. Because the grey scale image in this Figure gives the optical surface brightness, part of this peak is due to ESO 349-G009. However, there may be a subcluster in this region, which provides the extra X-ray emission.
Figures 1 and 2 show that the global X-ray emission is elliptical and elongated along the major axis of the galaxy luminosity distribution. The major axis of the cD galaxy is also aligned in the same general direction.
To quantify elongation of the cluster, we have used the ellipse fitting routine in STSDAS (Jedrzejewski 1987) to fit elliptical isophotes to the X-ray emission, to the cD galaxy optical surface brightness, and to the cluster galaxy optical luminosity distribution. The position angles () and ellipticities are shown in Figures 4 and 4. The is measured counter-clock-wise from the north. The optical image of the cD is from the Digitized Sky Survey. Figure 4 shows that the major axis of the cD galaxy is in . In the outer regions (), the X-ray emission seems to have the same orientation as the cD within the fitting errors. A similar result was found from a wavelet analysis of the ROSAT PSPC image (Slezak et al. 1994). The outer X-ray orientation also agrees reasonably well with that of the smooth galaxy optical surface brightness, and the X-ray surface brightness and galaxy distribution give similar values for the ellipticity, as well. The galaxy distribution is at a slightly smaller position angle than either the X-ray emission or cD galaxy (at smaller radii). Our result for the orientation of the galaxy distribution are consistent with those of GGP.


However, in the inner part () of the X-ray image, the elongation of the X-ray surface brightness is is rotated by about 90 degrees with respect to the major axis of the cD galaxy. The X-ray image is also significantly more elliptical in the innermost regions. The sudden change in the is due to the X-ray bar structure in the central area. We will discuss this feature in detail in § 5.
3.2. X-ray Surface Brightness and Gas Density Profiles
To derive the X-ray surface brightness profile, the X-ray emission was accumulated in circular annuli. Tests have shown that the results for circular annuli are consistent with the results for elliptical annuli for moderate values of the ellipticity (White et al. 1994). The X-ray counts in these bins were corrected for vignetting, exposure, and background. The count rate was then converted into a physical flux in the ROSAT X-ray band keV, assuming a Raymond-Smith thermal spectrum with a temperature of 3.43 keV (§ 4.1), the total (galactic and intrinsic) absorption column density cm-2 (§ 4.2), and the abundances from the ASCA spectrum (Ohashi 1995).
The azimuthally averaged X-ray surface brightness profile is plotted in Figure 5 (upper curve). The errors for each data point follow directly from Poisson counting statistics including the background subtraction. From the X-ray surface brightness, one can derive the electron density distribution by de-projection (Fabian et al. 1981). Spherical symmetry was assumed, and the same thermal spectrum was adopted as used in the conversion to the physical flux. The resulting electron density profile is shown as the lower set of filled squares in Figure 5. The errors on the electron density are 68% confidence ranges derived from Monte Carlo simulations of 100 statistical realizations of the data.

In Figure 5, the X-ray surface brightness is strongly peaked toward the center of the cluster. We tried to fit the data using the conventional isothermal -model, . Here, is the central surface brightness, is the projected radius, and is the core radius of the X-ray emission. The model was convolved with the Point Response Function (PRF) of the ROSAT HRI. The best fit for all 23 data points gave and kpc (uncertainties are 90% confidence limits for one interesting parameter). The value of was 27.8 for 20 degrees of freedom (d.o.f.), which is not an acceptable fit. The model surface brightness (solid line) is plotted in Figure 5. Clearly, there is a central excess of X-ray emission compared to the model for the first four data points. To test the significance of this excess, we removed the four innermost data points from the fit. The resultant value was significantly reduced by 17.5 to 10.3 for 16 d.o.f., which is a dramatic reduction for the removal of four data points. The improved fit, which gives and kpc (90% confidence level), is plotted as the dotted line in Figure 5. Ohashi (1995) fitted a -model to his ASCA data on the X-ray surface brightness, and found larger values of (0.65) and (100′′). The difference may be due in part to the larger PRF or harder spectral band of ASCA.
3.3. Cooling Flow
The excess central X-ray surface brightness suggests that A4059 has a cooling flow, as was previously found by Schwartz et al. (1991) and Edge et al. (1992). We find that the average electron density within the central is cm-3, which implies that the gas cooling time for this region is about years at a temperature of keV (90% confidence level).
From the electron density profile, we find that the cooling radius, defined as the point where the cooling time equals yr, is arcsec = kpc (90% confidence level). The total cooling rate within this radius is yr-1 (90% confidence level). This cooling rate is intermediate between the value of yr-1 from Edge et al. (1992) and the estimate of 320 yr-1 by Schwartz et al. (1991), both based on EXOSAT data.
4. SPECTRAL ANALYSIS OF THE X-RAY EMISSION
4.1. Gas Temperature Distribution
We used the ROSAT PSPC observation of A4059 from the archive (see § 2) to determine the (projected) X-ray spectra in circular annuli centered on the cD galaxy PKS2354-35. The results of the spectral fitting are summarized in Table 1. Because of the limited spatial resolution of the ROSAT PSPC, the width of each annular bin was set at least 1 arcmin. The radii are given in the first row of Table 1. For outer bins, the width was increased so that each bin had enough ( 1000) net photons in the spectral fitting. The spectra were corrected for particle and X-ray background; the average Master Veto rate was . The number of net photons in the spectrum after background subtraction are listed in the second row of Table 1. The spectra were limited to the energy channels from 0.2 to 2.04 keV.
| ROSAT PSPC Spectral Fits | ||||||
|---|---|---|---|---|---|---|
| Radius (′′) | 0 – 60 | 60 – 120 | 120 – 180 | 180 – 260 | 260 – 410 | 410 – 800 |
| Net Photons | 1914 | 2283 | 1628 | 1460 | 1707 | 1531 |
| Abundance | 0.63 | 0.56 | 0.53 | 0.49 | 0.43 | 0.29 |
| Temperature (keV) | 1.93 | 2.93 | 4.64 | 2.76 | ||
| /d.o.f. | 51.5/67 | 80.9/77 | 54.4/60 | 55.5/54 | 62.8/62 | 65.8/56 |
A Raymond-Smith thermal spectrum was assumed with a Galactic neutral hydrogen column density of cm-2 (90% confidence level; see § 4.2). Because the ROSAT PSPC data did not provide strong constraints on the abundances in the gas, we have fixed the abundances at different radii to values interpolated from the ASCA measurements (Ohashi 1995). These abundance values are listed in the third row of Table 1. The best-fit temperature values are given in row 4 of the Table; the upper and lower limits of the gas temperatures are at the 90% confidence level. Because of the large fitting errors, only lower limits are given for temperatures in bin 5 and 6. The last row in the Table gives the total value for the fit and the number of degrees of freedom for each annular bin.

The temperature distribution of the gas is plotted in Figure 6. Also plotted in the Figure is the result (dotted line) of a single temperature fit of the entire cluster within a radius of 800′′. This single temperature fit gives a total of 175.3 for 162 degrees of freedom. It gives the gas temperature and metal abundance of keV and solar (90% confidence), respectively. It also gives the best fit value for the absorption column of cm-2, which is consistent with the value from Stark et al. (1992). This result is in agreement with the results from other instruments: keV (1 confidence; ; Schwartz et al. 1991; Edge & Stewart 1991), keV (1 confidence; ; David et al. 1993), and 3.9 keV (ASCA; Ohashi 1995).
Figure 6 shows that, except the central annular bin, the single temperature fit is a fairly good representation of the gas temperature distribution in the cluster. The central bin seems to suggest a gas temperature drop in the center of the cluster. To test this hypothesis, we have divided the entire cluster into two sets of spectral data: the central bin and the rest of the cluster. We then fit the two spectra simultaneously, either requiring that the temperature of the central bin equal that of the rest of the cluster, or allowing the central bin to have a different temperature. Allowing the central bin to have a separate temperature resulted in a reduction of the total value by 7.9 (from 218.3 to 210.4) with the decrease of 1 degree of freedom (from 222 to 221). From the -test, the hypothesis that the central temperature is the same as that of the rest of the cluster can be rejected at the 95% probability level.
4.2. Gas Cooling and Intrinsic X-ray Absorption
The spatial analysis of the ROSAT HRI X-ray surface brightness requires that there be a cooling flow in the central region of A4059 (§ 3). The reduction in the central temperature is also consistent with this (see § 4.1, Figure 6, and the preliminary ASCA result by Ohashi [1995]). However, the ROSAT PSPC spectra do not require any significant cooling flow component. For example, within (slightly larger than the cooling radius; § 3), a single temperature Raymond-Smith thermal model gives a reasonably good fit to the spectra: total of 145.6 for 135 degrees of freedom. The addition of the cooling flow component to the above model does not improve the fit. The maximum cooling rate within this radius is yr-1 at the 90% confidence level. For the PSPC spectra of the entire cluster (), the addition of a cooling flow component does not improve the corresponding single temperature model fit either. At 90% confidence level, the cooling rate is yr-1 with a fitted absorption column density of cm-2. This strong upper limit on the cooling rate is clearly inconsistent with the result from the spatial data analysis.
One explanation for this inconsistency between the X-ray surface brightness profile and the X-ray spectrum of the central region of the cluster would be if the cooling flow had only begun recently. In § 3.3, we determined the gas cooling time at the center of the cluster. Because of the large errors in the electron density, the cooling time of the central gas could be as large as years. This is comparable to the gas relaxation time following a subcluster merger (Roettiger, Burns, & Loken 1993). Thus, if this cluster recently underwent a merger which disrupted any pre-existing cooling flow, it is possible that cooling of the central gas might have only begun within the last 2 Gyr. Then, very little gas may have actually cooled down to low temperatures ( K). On the other hand, A4059 now appears to be a quite relaxed cluster. The X-ray image is quite regular on large scales (Fig. 1; Buote & Tsai 1996), although Slezak et al. (1994) has suggested that there is some evidence for substructure based on a wavelet analysis of the ROSAT PSPC image.
The spectral fitting also shows there is very little (if any) intrinsic, excess soft X-ray absorption toward the center of the cluster. If we adopt the Galactic neutral hydrogen column density of cm-2 (Stark et al. 1992), the limit on the intrinsic absorption in the center of the cluster () is cm-2 at the 90% confidence level. Alternatively, we can use the spectrum of the outer cluster () to fix the Galactic absorption, and determine the excess absorption in the center. The best-fit model gives central excess absorption cm-2 with a total /d.o.f. = 192.1/207. At 90% confidence level, the central excess intrinsic absorption has only an upper limit of cm-2. This upper limit for A4059 is rather low when compared to X-ray spectral fits of some other cooling flows clusters (White et al. 1991; Allen et al. 1995). However, this limit only applies to excess absorption which is in front of the cluster emission.
5. CENTRAL STRUCTURE OF THE X-RAY AND RADIO EMISSION
5.1. Central X-ray Structure
In the center of the cluster, the X-ray emission is strongly peaked towards the cD galaxy PKS2354-35. Figure 7 shows the contours of the X-ray emission within the central 6′ superposed on the corresponding optical field from the Digitized Sky Survey. The X-ray emission was adaptively smoothed with a signal-to-noise ratio of 5 per smoothing beam. As discussed in § 3.1, the X-ray emission is elongated in the same direction as the cD on the scales of . However, on smaller scales (), the X-ray emission is concentrated to an elongated X-ray bar, which is nearly perpendicularly to the major axis of the cD. The centermost part of the X-ray image is shown in grey scale in Figure 8, superposed on the 4.8 GHz radio contour map (Taylor et al. 1994). The radio source will be discussed in the next section § 5.2. As discussed in § 2, we have adopted the absolute positions from the aspect solution for the HRI X-ray data. The agreement of the radio and optical nucleus with a central position along the X-ray bar suggests that the X-ray positions are not completely wrong. However, the brightest part of the bar extends for about 15′′, so this is not a very strong constraint on the accuracy of the X-ray positions.
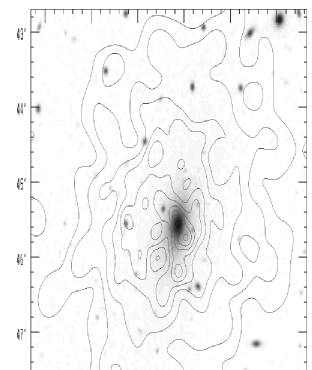
Figure 8 also shows two X-ray emission minima (“X-ray holes”) above and below the X-ray bar. Are the two X-ray holes statistically significant? First, we compare the X-ray surface brightness in the two X-ray holes with the average surface brightness at the same radius. The two X-ray holes are defined as two elliptical regions with semimajor and semiminor axes of and , centered at R.A. = , Dec. = , and R.A. = , Dec. = A total of 15 and 12 photons were detected in the northern and southern holes, respectively. Based on the counts in an annulus between and , we expect counts in each X-ray hole. Thus, the Poisson probabilities that the number of photons in each X-ray hole could be equal or less than 15 and 12 are about 0.23% and 0.019%, respectively.
Alternatively, we can verify the statistical significance level of the two X-ray holes by performing the Poisson simulations of the central X-ray image based on the ellipse fitting model (§ 3). Out of 1000 statistical realizations of the image, we found three instances in that the simulated X-ray count in the northern X-ray hole was less than or equal to 15, and no cases where the simulated X-ray count in either hole was less than or equal to 12. These tests suggest that the two X-ray holes are real, and are unlikely to be the results of statistical fluctuations.
5.2. Radio Lobes and Two X-ray Holes
The central cD galaxy PKS2354-35 is a strong radio source with two relatively bright radio lobes (the radio jets are not pronounced). A 4.8 GHz B-array VLA radio contour map is shown in Figure 8 (Taylor et al. 1994). The linear size of the radio source is also measured from a VLA 1.4 GHz map from the NRAO VLA Sky Survey (NVSS), which shows a slightly larger linear size (after deconvolution with the radio beam) of about (FWHM).
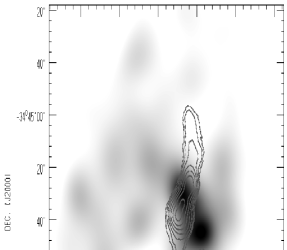
It is interesting that the two radio lobes lie perpendicular to the central X-ray bar and extend towards the areas of the two X-ray minima. The radio and X-ray structure in A4059 is similar to that of NGC 1275 in the Perseus cluster (Böhringer et al. 1993), it was argued that the two X-ray minima are due to the displacement of X-ray emitting gas by the radio plasma. However, in A4059 the radio emission at 1.4 GHz and 4.8 GHz does not extend into the central areas of the two X-ray holes, although it is possible that the radio source extends further at lower frequencies.
In the following, we compare the nonthermal pressure in the radio lobes with thermal pressure of the X-ray emitting gas in the region around the radio lobes. Because we are most interested in the interaction of the radio plasma and the X-ray emitting gas on the scale of the X-ray structures seen in Figure 8, we will estimate the radio pressure on the largest observed scales of the radio. The radio lobes end at about 35′′ from the center, where the average electron density is about cm-3 (90% confidence level). The X-ray gas thermal pressure is then ergs cm-3 at this radius, assuming a gas temperature of keV (Table 1). The largest scale of the radio emission from the 1.4 GHz NVSS radio image (Condon et al. 1993) is about (FWHM). PKS2354-35 is a 1.27 Jy source at 1.4 GHz, and has a spectral index of (Taylor et al. 1994). Assuming that this extended radio flux comes from a uniform prolate cylindrical region of size , that the ratio of the energy of ions to electrons is unity, that the volume filling factor is unity, that the magnetic field is perpendicular to the line of sight, and that the lower and upper cutoff of the radio frequencies are 10 MHz and 100 GHz, respectively, we find a minimum energy magnetic field of 17 G, and a radio pressure of ergs cm-3 (e.g., Miley 1980), which is about a factor of 5.8 smaller than the gas thermal pressure. But considering the uncertainties in the estimate of the minimum-energy radio pressure (e.g., if the energy ratio of ions to electron is 100, the radio pressure becomes ergs cm-3), the radio pressure may be comparable to that of the thermal X-ray gas.
Closer to the center, nonthermal radio pressures are somewhat higher in the two radio lobes; the pressures are ergs cm-3 and ergs cm-3 for the northern and southern radio lobes, respectively (Taylor et al. 1994). These pressures are, however, measured at a distance of from the radio core. On this scale, the X-ray thermal pressure is about ergs cm-3. So, the thermal and nonthermal pressures are again comparable in the innermost regions, and it is possible that the radio lobes and the X-ray gas are in pressure equilibrium. This would be expected if the radio lobes have displaced, expanded against, and been confined by the X-ray gas. This is consistent with the interpretation of the X-ray holes as regions where the radio source has displaced the X-ray gas.
On the other hand, it is odd that the radio emission in the available images does not appear to fill the observed X-ray holes. One possibility is that the relativistic electrons in the X-ray hole regions have undergone severe synchrotron losses, or that the X-ray holes are residuals of a previous epoch of radio activity. In a 17 G magnetic field, synchrotron losses dominate, and the lifetime of electrons emitting at a frequency of 1.4 GHz, the lowest frequency at which the source was observed and detected with on the largest linear size, is years. We can also estimate the age of the radio source from the variation in the radio spectral indices (Myers & Spangler 1985). Taylor et al. (1994) found that the spectral index of the radio source changed from at the radio core to at the faint, diffuse component to the radio lobes, which suggests this faint, diffuse radio component has been around for about years. Thus, we are not surprised that much of the radio emission at 1.4 GHz or higher has faded beyond the region of the observed radio lobes. An upper limit to the age of the X-ray holes, assuming they are supported by nonthermal pressure, is the timescale for their disruption by Rayleigh-Taylor instabilities and/or by buoyant forces. Roughly, either of these processes should occur on a timescale which is 10 times the sound crossing time of the holes in the surrounding X-ray gas. This maximum age is about years, which is much longer than the lifetime of electrons emitting at the observed radio frequencies. Thus, it is possible that the radio emission from much of the region has faded, but that the lobes are still supported by the pressure of cosmic ray ion, low energy cosmic ray electron, and the magnetic field. In general, in a radio source with a steep spectrum like PKS2354-35 (Taylor et al. 1994), most of the nonthermal electron pressure is due to electrons at low energies, which might emit at very low radio frequencies.
5.3. Alignment of the X-ray, Optical, and Radio Emission
As described in § 3, the X-ray isophotes for are aligned with the direction of elongation of the optical isophotes of the cD galaxy PKS2354-35, and the cluster galaxy isopleths. In addition, the strong radio lobes from the cD galaxy is also extended along the major axis of the cD potential. This is consistent with the anisotropic merger model for the formation cD galaxies and the orientation of their sources as proposed by West (1994). West noted that the alignments in A4059 continue to larger scales, where the two nearest Abell clusters also lie approximately along the same axis. In his model, cD galaxies were formed by anisotropic mergers occurring preferentially along an axis determined by large scale structure. Gaseous accretion associated with these mergers determined the axis of rotation of a central black hole, and this is the axis along which radio jets propagate. Evidence for the alignment of the X-ray emission, central cD galaxy, subclusters, host clusters, and surrounding superclusters have been proposed recently in many other clusters (e.g., West et al. 1995; Allen et al. 1995; West, Jones, & Forman 1995).
5.4. Radio Lobe Inflation or a Rotating Disk?
The central X-ray structure in the cD galaxy PKS2354-35 is similar to that in NGC 1275 (Böhringer et al. 1993). In the case of NGC 1275, the regions of X-ray minima are filled by the radio lobes from the central cD galaxies. The radio nonthermal pressure in the lobes is comparable to the X-ray thermal pressure in the surrounding gas, within the errors. This is consistent with the idea that the radio lobes have displaced the X-ray emitting gas, and are expanding against and being confined by this gas.
The same model may apply to PKS2354-35 in A4059, but the radio emission does not seem to extend completely into the X-ray holes in either the 1.4 or 4.85 GHz radio images. It is possible that the extended radio emission has a very steep spectral index, and that lower frequency radio emission fills the X-ray holes. Alternatively, it may be that the present period of radio activity in PKS2354-35 is ending, or that the X-ray holes are relics of a previous epoch of activity. This might account for the absence of radio emission from the outer parts of the X-ray holes. In either scenario, the holes may still contain cosmic ray ions, low energy cosmic ray electrons, and magnetic fields with a sufficient pressure to maintain the X-ray holes against the pressure of the surrounding X-ray emitting gas.
An alternative interpretation for the central X-ray structure emphasizes the elongated X-ray bar rather than the X-ray holes. Perhaps it is not that the X-ray emission from the holes is weak, but rather that the emission orthogonal to the direction of the holes (along the bar) is strong. The X-ray bar might be a disk of X-ray emitting gas seen edge-on. A disk might be formed from cooling flow gas with angular momentum, which becomes more rotationally supported as it contacts into the center of the cluster. Eventually, part of the gas from this disk might feed an accretion disk around the central AGN, and the radio jets may emerge perpendicular to this disk. Recently, 2-D numerical simulations have shown that a rotationally supported disk can be formed under some circumstances in a cooling flow (Garasi, Loken, & Burns 1996). On the other hand, Nulsen, Stewart, & Fabian (1984) have argued that turbulent viscosity will effectively transport the angular momentum of cooling flow gas outward, and that the gas will not form a rotationally supported disk in the inner regions. A disk might also be formed due to a merge with a gas rich dwarf galaxy, although such galaxies are rare in centers of rich cluster.
In either case, there would be no reason to expect the initial angular momentum of the gas would be aligned with the major axis of the cluster and cD galaxy. However, West (1994) argues that cD galaxies are highly prolate, and that differential procession will cause accreting gas to settle into a disk which is perpendicular to the major axis of the galaxy, as required in A4059. Hydra A seems to show just such a disk, which is seen prominently in 21 cm H I emission (Dwarakanat et al. 1995). Optical emission line spectra of the disk in Hydra A show that it is rotating (Ekers & Simkin 1983; Baum et al. 1988). However, there is no similar evidence for a rotating disk in Abell 4059.
6. SUMMARY
In summary, we have analyzed the ROSAT HRI image and PSPC spectra of Abell 4059. The most striking feature of the X-ray image is the two X-ray holes and an orthogonal X-ray bar in the center of the cluster. It is likely that the radio plasma from the cD galaxy may have displaced the X-ray gas and created the X-ray holes, or we may be seeing a rotationally supported disk of the X-ray emitting gas. There may also be a moderate cooling flow in the center of the cluster, yr-1, as suggested by the X-ray surface brightness profile. However, such a cooling flow is not needed in the spectral fitting of the PSPC data. It may be that the cooling flow has just begun in the center of the cluster. In addition, very little intrinsic absorption was found in the center of the cluster.
References
- (1) Abell, G. O., Corwin, H. G., Jr., & Olowin, R. P. 1989, ApJS, 70, 1
- (2)
- (3) Allen, S. W., Fabian, A. C., Edge, A. C., Böhringer, H., & White, D. A. 1995, MNRAS, 275, 741
- (4)
- (5) Baum, S. A., Heckman, T., Bridle, A., van Breugel, W., & Miley, G. 1988, ApJS, 68, 643
- (6)
- (7) Böhringer, H., Voges, W., Fabian, A. C., Edge, A. C., & Neumann, D. M. 1993, MNRAS, 264, L25
- (8)
- (9) Buote, D. A., & Tsai, J. C. 1996, ApJ, 458, 27
- (10)
- (11) Buta, R. 1995, ApJS, 96, 39
- (12)
- (13) Condon, J. J. 1992, ARA&A, 30, 575
- (14)
- (15) Condon, J. J., Cotton, W. D., Greisen, E. W., Perley, R. A., Yin, Q. F., & Broderick, J. J. 1993, BAAS, 25, 1389
- (16)
- (17) David, L. P., Slyz, A., Jones, C., Forman, W., Vrtilek, S. D., & Arnaud, K. A. 1993, ApJ, 412, 479
- (18)
- (19) Dwarakanath, K. S., Owen, F. N., & van Gorkom, J. H. 1995, ApJ, 442, L1
- (20)
- (21) Edge, A. C., & Stewart, G. C. 1991, MNRAS, 252, 414
- (22)
- (23) Edge, A. C., Stewart, G. C., & Fabian, A. C. 1992, MNRAS, 258, 177
- (24)
- (25) Ekers, R. D., & Simkin, S. M. 1983, ApJ, 265, 85
- (26)
- (27) Fabian, A. C., Hu, E. M., Cowie, L. L., & Grindlay, J. 1981, ApJ, 248, 47
- (28)
- (29) Garasi, C., Loken, C., & Burns, J. 1996, preprint
- (30)
- (31) Green, M. R., Godwin, J. G., & Peach, J. V. 1988, MNRAS, 234, 1051
- (32)
- (33) Green, M. R., Godwin, J. G., & Peach, J. V. 1990, MNRAS, 243, 159 (GGP)
- (34)
- (35) Huang, Z., & Sarazin, C. L. 1996, ApJ, 461, 622
- (36)
- (37) IRAS Point Source Catalog, Version 2, 1988, The Joint IRAS Science Working Group (Washington, D.C.: GPO), 200
- (38) Jedrzejewski, R. I. 1987, MNRAS, 226, 747
- (39)
- (40) Lipovetsky, V. A., Neizvestny, S. I., & Neizvestnaya, O. M. 1988, SoSAO, 55, 5
- (41)
- (42) Matsumoto, H. 1994, in New Horizon of X-ray Astronomy, ed. F. Makino & T. Ohashi (Tokyo: Universal Academic Press), 511
- (43)
- (44) Miley, G. 1980, ARA&A, 18, 165
- (45)
- (46) Myers, S. T., & Spangler, S. R. 1985, ApJ, 291, 52
- (47)
- (48) Nulsen, P. E., Stewart, G. C., & Fabian, A. C. 1984, MNRAS, 208, 185
- (49)
- (50) Ohashi, T. 1995, in Dark Matter, ed. S. S. Holt & C. L. Bennett (New York: AIP Press), 255
- (51)
- (52) Roettiger, K., Burns, J., & Loken, C. 1993, ApJ, 407, L53
- (53)
- (54) Schwartz, D. A., Bradt, H. V., Remillard, R. A., & Tuohy, I. R. 1991, ApJ, 376, 424
- (55)
- (56) Slezak, E., Durret, F., & Gerbal, D. 1994, AJ, 108, 1996
- (57)
- (58) Stark, et al. 1992, ApJS, 79, 77
- (59)
- (60) Taylor, G. B., Barton, E. J., & Ge, J. 1994, AJ, 107, 1942
- (61)
- (62) West, M. J. 1994, MNRAS, 268, 79
- (63)
- (64) West, M. J., Jones, C., & Forman, W. 1995, ApJ, 451, L5
- (65)
- (66) White, D. A., Fabian, A. C., Allen, S. W., Edge, A. C., Crawford, C. S., Johnstone, R. M., Stewart, G. C., & Voges, W. 1994, MNRAS, 269, 589
- (67)
- (68) White, D. A., Fabian, A. C., Johnstone, R. M., Mushotzky, R. F., & Arnaud, K. A. 1991, MNRAS, 252, 72