COMPTEL -ray study of the Crab nebula
Abstract
We report on a study of the -ray continuum emission from the
Crab supernova nebula
and on a search for nuclear de-excitation -ray lines.
Crab is the brightest continuum source in the 1–10 MeV -ray sky,
and its continuum radiation is most likely of synchrotron origin.
It is a likely source of cosmic rays through shock acceleration
and thus a potential candidate for -ray line emission from nuclear interactions.
Five years of COMPTEL observations enable a fine spectral binning
to investigate the behaviour of the 0.75–30 MeV emission in detail
and to search for nuclear de-excitation lines on top of the continuum.
The nebular spectrum shows a break
at the edge of the COMPTEL energy range
and connects well to the EGRET spectrum,
probably reflecting electron energy losses in the synchrotron emission scenario.
Such a smooth continuum model alone may not be sufficient to explain the observations.
A weak bump in the spectrum at 1–2 MeV may be present.
No significant evidence for distinct line emission is seen,
but the presence of a blend of line features or another synchrotron component
cannot be excluded.
Key Words.:
ISM: Crab nebula – cosmic rays – ISM: supernova remnants – Gamma rays: observations1 Introduction
Strong shocks in Galactic supernova remnants (SNRs) are widely believed to be sources of cosmic rays (CRs) below eV. This has only been substantiated, however, through detection of accelerated energetic electrons by their synchrotron emission. Direct evidence for the acceleration of the nuclear component is still to be found. Searches for signatures of the nuclear component in the TeV range (e.g. Atoyan & Aharonian atoyan (1996); Allen et al. allen (1995)), for instance, have only provided upper limits. The existence of accelerated protons and nuclei can also be deduced from the presence of -ray lines which these particles produce when interacting with the ambient medium.
Nuclear interaction line emission has so far been reported from solar flares (e.g. Chupp chupp (1990); Murphy et al. murphy (1991); Ryan et al. ryan (1992)) and in only one occasion from an extra-solar source, the Orion Complex (Bloemen et al. 1994a , 1997a ). Evidence is seen now in emission from the inner Galaxy as well (Bloemen et al. 1997b ). These detections were obtained with the Compton Telescope (COMPTEL) aboard the Compton Gamma Ray Observatory (CGRO). COMPTEL operates between 0.75 and 30 MeV, which is the energy regime where signs of nuclear interactions can be expected. The observed 3–7 MeV emission from Orion was tentatively attributed to 12C∗ (4.44 MeV) and 16O∗ (6.13 MeV) de-excitation lines. Solar flare spectra show several additional lines from heavier nuclei (20Ne, 24Mg, 28Si), mainly in the 1–2 MeV regime. Here we report on a search for such -ray lines from the Crab nebula, using COMPTEL data obtained during the first five years of the mission.
The Crab nebula is an extensively studied 943 year old SNR. The pulsar wind from the central, isolated pulsar supplies high-energy particles that synchrotron radiate (Shklovsky shklov (1953); Dombrovsky dombrov (1954); Oort & Walraven oort (1956)) while gyrating in the magnetic field of the nebula (Kennel & Coroniti kennel (1984)). However, in situ acceleration has to occur as well. The radio-to--ray spectrum consists of a mix of different power-law components, separated by breaks (e.g. Zombeck zom (1982); De Jager et al. dejager (1996)), which seem to indicate three electron populations. The continuum emission up to Hz is associated with the optically visible nebula. The break may reflect the energy losses for electrons as old as the SNR; the average field of the optical nebula can then be calculated to be G (e.g. Trimble trimble (1982); Marsden et al. marsden (1984)). Consequently, the electrons responsible for the torus of X-ray emission, the spectrum of which breaks somewhere between 60 and 150 keV (Bartlett bartlett2 (1994)), should have a lifetime of month. The inner edge of the nebula lies at 8” (0.08 pc), so it is clear that these electrons have been accelerated in or near the nebula.
De Jager et al. (dejager (1996)) discuss evidence for a third spectral break at MeV, from early observations by COMPTEL and EGRET (also aboard CGRO), which is addressed below. This would indicate another population of energetic electrons, with lifetimes of day. We present further evidence for this spectral break using more COMPTEL and EGRET observations.
| Obs | Tstart | Tend | Obs | Tstart | Tend |
| # | dd-mm-yy | dd-mm-yy | # | dd-mm-yy | dd-mm-yy |
| 0a | 28-04-91 | 07-05-91 | 321.5 | 15-02-94 | 17-02-94 |
| 1.0 | 16-05-91 | 30-05-91 | 337 | 09-08-94 | 29-08-94 |
| 31 | 11-06-92 | 25-06-92 | 412 | 28-02-95 | 07-03-95 |
| 36.0 | 11-08-92 | 12-08-92 | 413 | 07-03-95 | 21-03-95 |
| 36.5 | 12-08-92 | 20-08-92 | 419.1 | 04-04-95 | 11-04-95 |
| 39.0 | 01-09-92 | 17-09-92 | 419.5 | 09-05-95 | 23-05-95 |
| 213 | 23-03-93 | 29-03-93 | 420 | 23-05-95 | 06-06-95 |
| 221 | 13-05-93 | 24-05-93 | 426 | 08-08-95 | 22-08-95 |
| 310 | 01-12-93 | 13-12-93 | 502 | 17-10-95 | 31-10-95 |
| 321.1 | 08-02-94 | 15-02-94 | |||
| a Data obtained during the verification phase | |||||
2 Instrumentation, observations & data analysis
2.1 Instrument
COMPTEL is designed to detect -ray photons with energies between about and MeV with an energy resolution of 5–10% FWHM. It has a field-of-view of steradian and an angular resolution of typically 1°–3°, which enables the instrument to monitor several objects simultaneously. The location accuracy is about for a strong source. A detailed description of the detection principle and instrument is given by Schönfelder et al. (schoen (1993)). Ideally, incoming -ray photons are first Compton scattered in an upper detector layer and then completely absorbed in a lower detector layer. The measured energy deposits and locations in these layers determine the scatter direction, scatter angle, and total energy of each photon. For selected energy bands, the telescope events are binned in a 3-dimensional data space, which consists of two scatter direction coordinates and a Compton scatter angle coordinate. Here we use a binning of . The source response function of the instrument in this data cube has a cone-like shape and depends on the actual source spectrum. In the present work we have adopted an power-law input spectrum, but our findings are not sensitive to this specific choice.
| E | Fluxunp | Errorunp | Fluxtot | Errortot | |
|---|---|---|---|---|---|
| MeV | cm-2 s-1 | cm-2 s-1 | |||
| 0.78–0.96 | 34.07 | 1.57 | 42.75 | 1.00 | |
| 0.96–1.16 | 31.11 | 1.30 | 36.68 | 0.82 | |
| 1.16–1.38 | 21.54 | 1.09 | 27.80 | 0.69 | |
| 1.38–1.62 | 18.68 | 1.04 | 23.78 | 0.65 | |
| 1.62–1.88 | 13.03 | 0.82 | 17.02 | 0.52 | |
| 1.88–2.16 | 8.90 | 0.71 | 11.62 | 0.45 | |
| 2.16–2.48 | 7.84 | 0.70 | 10.25 | 0.44 | |
| 2.48–2.84 | 8.66 | 0.57 | 9.79 | 0.36 | |
| 2.84–3.22 | 6.14 | 0.52 | 7.28 | 0.33 | |
| 3.22–3.62 | 4.41 | 0.46 | 6.13 | 0.29 | |
| 3.62–4.08 | 4.28 | 0.41 | 5.80 | 0.26 | |
| 4.08–4.56 | 4.44 | 0.36 | 4.77 | 0.22 | |
| 4.56–5.08 | 2.94 | 0.33 | 3.96 | 0.21 | |
| 5.08–5.66 | 3.42 | 0.32 | 3.69 | 0.20 | |
| 5.66–6.26 | 2.30 | 0.28 | 2.91 | 0.18 | |
| 6.26–6.94 | 2.15 | 0.28 | 2.64 | 0.18 | |
| 6.94–7.64 | 1.60 | 0.25 | 2.11 | 0.16 | |
| 7.64–8.42 | 1.17 | 0.20 | 1.80 | 0.13 | |
| 8.42–9.26 | 1.36 | 0.17 | 1.75 | 0.11 | |
| 9.26–10.16 | 1.24 | 0.15 | 1.47 | 0.10 | |
| 10.00–11.20 | 1.05 | 0.15 | 1.57 | 0.10 | |
| 11.20–12.48 | 1.12 | 0.14 | 1.37 | 0.09 | |
| 12.48–13.92 | 1.12 | 0.14 | 1.24 | 0.09 | |
| 13.92–15.52 | 0.62 | 0.13 | 0.92 | 0.09 | |
| 15.52–17.28 | 0.83 | 0.14 | 0.96 | 0.09 | |
| 17.28–19.28 | 0.50 | 0.14 | 0.68 | 0.09 | |
| 19.28–21.60 | 0.31 | 0.14 | 0.69 | 0.10 | |
| 21.60–24.08 | 0.23 | 0.15 | 0.29 | 0.10 | |
| 24.08–26.88 | 0.16 | 0.18 | 0.26 | 0.11 | |
| 26.88–30.00 | 0.13 | 0.27 | 0.09 | 0.18 | |

We applied a maximum-likelihood method (de Boer et al. deboer (1992)) to obtain flux estimates and to construct spectra with narrow energy bins equal to twice the FWHM of the COMPTEL energy resolution, given by
with in MeV (Schönfelder et al. schoen (1993)). Our method of analysis does not allow a significantly finer energy binning at this stage. At high energies ( MeV) the limited number of events requires even larger bins. In this study we have a total of 30 statistically independent bins.
On average, more than % of the number of events tagged by the instrument as Compton-scattered -ray should be attributed to the background (instrumental and isotropic). The likelihood analysis requires, for each energy interval separately, a careful estimate of this background for which a variety of methods has been studied. The results shown in this paper are based on a method of background determination in which a filter technique is applied to the data space. This method is described by Bloemen et al. (1994b ), although we applied here an improved algorithm involving an iterative process of background estimation. The filter eliminates to first order any source signature present. In each iteration the background is further corrected for the smeared-out source signature.
In this work we use point spread functions (PSFs) from analytical modeling based on single-detector calibrations. PSFs from Monte Carlo simulations of the instrument are preferred, but not available yet for the narrow energy bins used here. A globally somewhat softer spectrum is expected with the simulated response (about 0.1 in spectral index).
2.2 Observations
Crab was within 30°of the instrument pointing during several observations in the first 5 years of CGRO operations (Table 1). Observation 2.5 was excluded because the instrumental settings were optimized for solar flare observations.
2.3 Phase selection
In addition to the Crab nebula, the Crab pulsar is a strong (pulsed) -ray source as well, which fully dominates the high-energy ( MeV) -ray emission (e.g. Kanbach et al. kanbach (1990); Nolan et al. nolan (1993); Fierro fierro (1996)). In the COMPTEL energy range, about 20% of the total Crab emission is estimated to be due to the pulsar (cf Fig. 6 in Much et al. 1995a ). COMPTEL cannot resolve the Crab pulsar from the surrounding nebula spatially, but it is possible to disentangle them by pulsar phase selection, assuming that there is no pulsar emission in the “off”-phase at -ray energies. We determined the unpulsed emission by selecting the events in the off-pulse phase 0.525-0.915, as defined by Nolan et al. (nolan (1993)). Our analysis thus gives 39% of the flux, which is then normalized to the full period. The observations listed in Table 1 were combined and folded by our pulsar analysis software.
3 Results

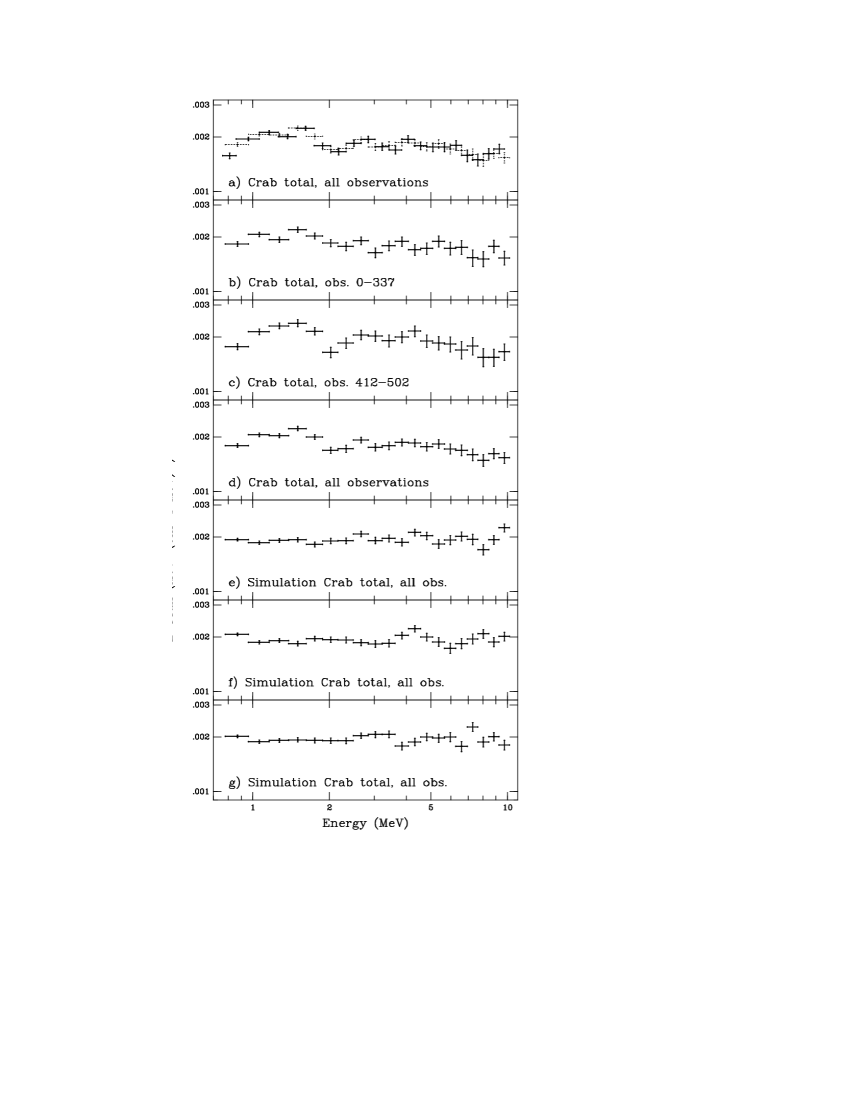
Figure 1 shows a power-per-decade spectrum of the off-pulse fluxes (Tab. 2). Our data points are in good agreement with the COMPTEL spectrum presented by Much et al. (1995b ), which was based on observations obtained during the first two years of the mission and contains 7 data points only. Statistical error bars are shown. The absolute calibration uncertainty is conservatively estimated to be 30%. The total number of photons in this spectrum is . Measurements from GRIS (Bartlett et al. bartlett1 (1993)) and EGRET (Fierro fierro (1996), April 1991 – Aug. 1994) are added to place the COMPTEL points in a broader perspective.
De Jager et al. (dejager (1996)) have modelled the emission of the Crab nebula. They used an inverse-Compton (IC) component and a synchrotron component with an exponential cut-off to fit COMPTEL (Much et al. 1995b ) and EGRET data (both April 1991 – May 1993):
Their best-fit result is shown as a dashed line in Fig. 1 (limited to the 1–100 MeV range). Figure 1 shows that the spectral break represented in the model begins in the COMPTEL domain. We have fit our data and the first 3 EGRET points to the first term of the equation. We ignore the IC component of the model, which is valid because the IC influence on the used data points is negligible. For the fit parameters we find: the energy cut-off MeV, cm-2 s-1 MeV-1, and , with a reduced ranging from 1.9 to 2.2 for 28 degrees of freedom (dof). The latter value was obtained by fitting the model to a spectrum with bins shifted by 1 FWHM of the energy resolution. Figure 2a shows, in solid lines, this shifted spectrum from 0.75–10 MeV. For comparison, the unshifted spectrum, also shown in Fig. 2b, is represented by dotted lines. The errors on the fit parameters have been calculated by increasing the with 3.5 (Lampton et al. lampton (1976)). The result can be seen in Fig. 1 (solid line). The cut-off energy is somewhat sensitive to the EGRET data points. Leaving all EGRET points out gives fit parameters of MeV, cm-2 s-1 MeV-1, and , with a reduced fit ranging from 2.0 to 2.3, for 25 dof. For comparison, De Jager et al. (dejager (1996)), who included the COMPTEL calibration uncertainty in their fit but excluded the MeV COMPTEL point, found: MeV, cm-2 s-1 MeV-1, and .
The fit is not perfect, as indicated by the value obtained above, but no obvious systematic trends can be seen. The deviations from the model fit are below the 3 level in the individual energy bins. In order to assess the systematic errors of our method we analyzed three Monte Carlo simulations of the Crab up to 10 MeV (Fig. 2cde), assuming an E-2 spectrum with an integrated 1–10 MeV flux of cm-2 s-1, as derived from the observations. It appears that with this input flux (corrected for the phase selection, i.e. cm-2 s-1) our method generates randomly placed features similar to those in the observed spectrum. Therefore, no significance can be given to the observed features. Best fits of the simulations to power-law spectra
give values of 0.9, 1.4, and 0.9 respectively, for 18 dof. For comparison, the best power-law fit to the observed data up to 10 MeV has an index of , () cm-2 s-1, and a ranging from 2.6 to 3.0, depending on the bin positions. The errors on the fit parameters have been calculated by increasing the with 2.3 (Lampton et al. lampton (1976)).
Since a mixture of line features (including broad-line components) may well be present, it cannot be excluded that we overestimated the continuum contribution. On the other hand, a decrease of the fitted continuum level would not exhibit clear evidence for known candidate lines (triangles in Fig. 2b) without introducing other features as well (e.g. near 2.8 MeV). Gravitationally redshifted -ray lines caused by ions falling onto the pulsar have not been included in the candidate lines, because it is unknown how deep in the atmosphere the particles would interact, and thus how large the redshift would be.
Much et al. (1995a ) reported that the Crab unpulsed emission might be time variable. Spectral changes (e.g. the position of the break energy) may occur on short time scales, possibly affecting the global appearance of our spectrum. Time variability of the Crab emission will be the topic of future study.
In order to obtain the cleanest data, we selected only 39% (the unpulsed fraction) of the available nebula events. However, as the emission from the nebula dominates the total emission from the Crab, we have used the set of all available (pulsar contaminated) events for our analysis as well. Figure 3d shows the total Crab spectrum using all observations; Fig. 3a shows the same spectrum (dotted lines) and the spectrum with shifted bins (solid lines). The integrated 1–10 MeV flux of cm-2 s-1 has been used as input parameter for simulations of an E-2 spectrum (Fig. 3efg). The best power-law fits to the simulations have values of 1.5, 2.4 and 1.7 (18 dof). Clearly, this is not perfect; the deviations may result from the fact that we have used the actual observations as the basis for our simulations, so that the smoothed Crab signal may influence our findings. Anyway, the best power-law fit to the observed data up to 10 MeV [, () cm-2 s-1], has a ranging from 5.0 to 7.4 (depending on the bin positions), which is a clear indication that the spectrum is more complicated. The main difference between observation and simulations is in the low energy range; at 1–2 MeV there is a hint for a broad feature. Some evidence for this feature could in fact already be seen in the unpulsed spectrum of Fig. 1, but it seems more pronounced in the total Crab spectrum. After splitting the data in two time intervals (Fig. 3bc, observations 0-337 and 412-502 respectively), some evidence for this feature is seen in both spectra. We cannot exclude, however, that it is associated with the pulsar, if real. The BATSE (35–1700 keV) Cycle 1–3 total Crab spectrum (Ling ling (1997)), although higher than the GRIS and COMPTEL points (Much et al. muchhar (1996)), shows a deviation from a simple power-law spectrum, which can be interpreted as a rise near 1 MeV as well. If real, the feature could well be due to a blend of lines, or it could be the synchrotron signature of a different population of electrons. Morphological comparisons of OSSE, BATSE and COMPTEL Crab spectra will be the topic of future study.
4 Conclusions
COMPTEL observations from the first five years of the mission were combined to search, in a fine binned spectrum, for nuclear de-excitation -ray lines from the Crab supernova nebula. No significant evidence for line emission is found. A reasonable fit to the off-pulse fluxes can be obtained with the synchrotron component of the model from De Jager et al. (dejager (1996)), giving a break energy of about 25–40 MeV. An indication for a bump at 1–2 MeV cannot readily be explained by known systematic and statistical errors. It is possible that line contributions or an extra continuum component have resulted in an overestimation of the single continuum component.
Acknowledgements.
The COMPTEL project is supported by the German government through DARA grant 50 QV 90968, by NASA under contract NAS5-26645 and by NWO. R.D. van der Meulen is supported by the Netherlands Foundation for Research in Astronomy (NFRA) with financial aid from the Netherlands Organization for Scientific Research (NWO).References
- (1) Atoyan, A.M., Aharonian, F.A., 1996, MNRAS 278, 525
- (2) Allen, G.E., Berley, D., Biller, S., et al., 1995, ApJ 448, L25
- (3) Bartlett, L.M., 1994, Ph.D. thesis ”High Resolution Gamma-Ray spectroscopy of the Crab”, Univ. of Maryland
- (4) Bartlett, L.M., Barthelmy, N., Gehrels, N., et al., 1993, In: The Second Compton Symposium, eds. C.E. Fichtel, N. Gehrels, J.P. Norris, (AIP: New York), vol. 304, 67
- (5) Bloemen, H., Wijnands, R., Bennett, K., et al., 1994a, A&A 281, L5
- (6) Bloemen, H., Hermsen, W., Swanenburg, B.N., et al., 1994b, ApJS 92, 419
- (7) Bloemen, H., Bykov, A.M., Bozhokin, S.V., et al., 1997a, ApJ 475, L25
- (8) Bloemen, H., Bykov, A.M., Diehl, R., et al., 1997b, In: The Fourth Compton Symposium, eds. C.D. Dermer, J.D. Kurfess, AIP, in press
- (9) Chupp, E.L., 1990, ApJS 73, 213
- (10) De Boer, H., Bennett, K., Den Herder, H., et al., 1992, In: Data Analysis in Astronomy IV, eds. Di Gesù et al., Plenum Press, New York, vol. 59, 241
- (11) De Jager, O.C., Harding, A.K., Michelson, P.F., et al., 1996, ApJ 457, 253
- (12) Dombrovsky, V.A., 1954, Dokl. Akad. Nauk. USSR 94, 1021
- (13) Fierro, J.M., 1996, Ph.D. thesis ”Observations of Spin-Powered Pulsars with the EGRET Gamma Ray Telescope”, Stanford University
- (14) Kanbach, G., 1990, In: The EGRET Science Symposium, ed. C. Fichtel et al., (NASA Conf. Pub. 3071), 101
- (15) Kennel, C.F., Coroniti, F.V., 1984, ApJ 283, 694
- (16) Lampton, M., Margon, B., Bowyer, S., 1976, ApJ 208, 177
- (17) Ling, J.C., et al., 1997, ApJS, submitted
- (18) Marsden, P.L., Gillett, F.C., Jennings, R.E., et al., 1984, ApJ 278, 29
- (19) Much, R.P., Bennett, K., Buccheri, R., et al., 1995a, A&A 299, 435
- (20) Much, R.P., Bennett, K., Buccheri, R., et al., 1995b, Adv. Space Res. 15(5), 81
- (21) Much, R.P, Harmon, B.A., Nolan, P., et al., 1996, A&AS 120, 703
- (22) Murphy, R.J., Ramaty, R., Reames, D.V., Kozlovsky, B., 1991, ApJ 371, 793
- (23) Nolan, P.L., Arzoumanian, Z., Bertsch, D.L., et al., 1993, ApJ 409, 697
- (24) Oort, J.H., Walraven, T., 1956, Bull. Astron.Inst. Netherlands 12, 285
- (25) Ramaty, R., Kozlovsky, B., Lingenfelter, R.E., 1979, ApJS 40, 487
- (26) Ryan, J.M., Aarts, H., Bennett, K., et al., 1992, Proc. of NASA Compton Observatory Science Workshop, Annapolis, Sept. 1991, NASA Conf. Publ. 3187, 470
- (27) Schönfelder, V., Aarts, H., Bennett, K., et al., 1993, ApJS 86, 657
- (28) Shklovsky, I.S., 1953, Dokl. Akad. Nauk. USSR 90, 983
- (29) Trimble, V.L., 1982, Rev. Mol. Phys. 54, 1183
- (30) Zombeck, M.V., 1982, Handbook of Space Astronomy and Astrophysics, Cambridge Univ. Press