On Formation and Evolution of Disk Galaxies: Cosmological Initial Conditions and the Gravitational Collapse
Abstract
We use a semianalytical approach, and the standard cold dark matter (SCDM) cosmological model to study the gravitational collapse and virialization, the structure, and the global and statistical properties of isolated dark matter (DM) galactic halos which emerge from primordial Gaussian fluctuations. Firstly, from the statistical properties of the primordial density fluctuation field the possible mass aggregation histories (MAHs) are generated. Secondly, these histories are used as the initial conditions of the gravitational collapse. To calculate the structure of the virialized systems we have generalized the secondary infall model to allow arbitrary MAHs and internal thermal motions. The average halo density profiles we obtained agree with the profile derived as a fitting formula to results of N-body cosmological simulations by Navarro et al. (1996, 1997). The comparison of the density profiles with the observational data is discussed, and some possible solutions to the disagreement found in the inner regions are proposed.
The results of our approach, after considering the gravitational dragging of the baryon matter that forms a central disk in centrifugal equilibrium, show that the empirical Tully-Fisher (TF) relation and its scatter can be explained through the initial cosmological conditions, at least for the isolated systems. The SCDM model produces galaxies with high velocities when compared to observations, but when the SCDM power spectrum is normalized to an excellent agreement with the observable TF relation is found, suggesting that this relation is the natural extension to galactic scales of the observed galaxy distribution power spectrum. The theoretical TF scatter is close to the measured one. The slope of the TF relation is practically invariant witn respect to the spin parameter .
1 Introduction
A point of major interest in the study of the origin and evolution of galaxies is the link between the physical conditions of the early universe and the properties of present-day galaxies. This point becomes particularly relevant if the properties of galaxies have indeed been strongly affected by the cosmological initial conditions. The aim of the present paper is to explore this question studying the gravitational collapse of primordial density fluctuations, and the characteristics of the virialized structures as a function of the properties of the primordial density fluctuation field (hereafter DFF). The building up and evolution of luminous disks will be treated in a future paper. Currently the most predictive scenario for cosmic structure formation is based on the gravitational paradigm, and on the inflationary cold dark matter (CDM) cosmological models. In this scenario, to a first approximation, the problem of cosmic structure formation can be studied by making use solely of gravitational physics. Although N-body simulations offer the most direct method to follow the gravitational clustering of collisionless systems, in practice several difficulties arise. On the one hand, computational limitations make it impossible to reach arbitrary resolutions and to overcome problems like discreteness and collision errors (e.g., Kuhlman, Melott, & Shandarin 1996; Melott et al. 1997). On the other hand, due to the “black box” character of these simulations, it is not easy to explore intermediate physical processes, and to reach a complete statistical description of the results. All this suggests that other alternative approaches should be developed in parallel.
To overcome the problem of the excessively steep density profiles obtained in numerical experiments with uniform spheres collapsing in an expanding universe, Gunn & Gott (1972), Gott (1975), and Gunn (1977) proposed the secondary infall process. Later, analytical and semianalytic extensions of the secondary infall model (SIM) were developed to study the gravitational collapse of fluctuations whose density profiles were derived from the cosmological conditions through the single-filter approximation. Most of them are valid only for self-similar cases and radial infall. The first studies about the structure of objects identified as virialized in the outcome of cosmological numerical simulations for the Gaussian CDM models showed a good agreement with the predictions of the SIM (see Hoffman (1988), and the references therein). This was an amazing result because in the numerical simulations the formation of DM halos is seen as a chaotic process of mergers, contrary to the symmetric, centralized, and gentle collapse implied in the SIM. Recently Zaroubi, Naim, & Hoffman (1996) concluded that the apparently very chaotic collapse seen in cosmological N-body simulations seems to look ordered and gentle when viewed in energy space. This raises the question of persistence of memory in the initial conditions. In Voglis, Hiotelis, & Harsoula (1995) the gravitational collapse of spherical fluctuations with several initial density profiles was explicitly studied by means of N-body simulations, and a clear correlation between the profiles and the final structures was found: the more steeply declining the initial profiles the shallower the final structures are. Such a trend has been confirmed by Zaroubi et al. (1996), who have pointed out that when the initial density profiles induce a gentle collapse, order is preserved in energy space, and the final structure reflects the initial gravitational potential. Dark halo formation of disk galaxies may reasonably be described by the SIM because the dynamical disk fragilty implies that major mergers could not have played a significant role in these cases (e.g., Tóth & Ostriker 1992).
The structure of DM halos has been explored in more detail using new high resolution N-body cosmological simulations. The results of these simulations suggest that the density profiles of the DM halos are coreless and self-similar, with the mass being the simple scaling parameter (Navarro, Frenk, & White 1996, 1997, hereafter NWF96, NFW97). Nevertheless, such a universal density profile is obtained as an average fitting to the numerical results which are statistically limited. Since the structure of DM halos could play an important role in establishing the global properties of galaxies, a more detailed and transparent statistical description of their characteristics is needed in order to study galaxy formation and evolution. Here we address the question of how do the structures of virialized objects, and their global and statistical properties depend on the initial conditions of formation defined by the primeval fluctuations.
Tight observational structural correlations were established for disk galaxies, as for example the luminosity-maximum rotation velocity relation. First, Tully & Fisher (1977) established this relation for luminosities in the B band, and later similar relations were found for other passbands. A self-consistent scenario of galaxy formation and evolution would have to explain the origin of these relations as well as of their scatters. The question of whether they are the result of the primordial cosmological conditions or not, is still an unsolved problem. The galaxy formation and evolution approach we propose here will allow us to investigate this question in a natural fashion.
In Section 2, a heuristic approach aimed at connecting the cosmological initial conditions with some global properties of galaxies is presented. The limitations of this approach are discussed, and overcoming them is one of the main goals of the paper. In section 3, the method we use to calculate the collapse and virialization of spherical density fluctuations with arbitrary MAHs (initial density profiles), and nonradial motions is described. Section 4 is devoted to the derivation of initial conditions for the gravitational collapse from the statistical properties of the DFF. In section 5, the results of our calculations for the SCDM model are presented and discussed. Subsection 5.1 specializes in the structure of DM halos; comparisons with results obtained in N-body cosmological simulations are made, and some possible alternatives to overcome the core problem are discussed. Subsection 5.2 is concerned with the statistical distribution of the different virialized configurations, their dependence on mass, and the origin of the long wavelength Tully-Fisher (TF) relations and their scatters. In section 6 we present the conclusions.
2 Global galaxy properties from the primordial fluctuations: simple analytical comparisons
As a first order approach, the naive top-hat spherical collapse model (e.g., Gunn & Gott 1972; Gott & Rees 1975; White & Rees 1978; Peebles 1980) allows one to establish, for a given power spectrum of fluctuations, a relationship between the mass (visible+dark) of a r.m.s. density fluctuation and its formation (collapse) epoch . For a Gaussian DFF, and an Einstein-De Sitter universe:
| (1) |
where , is the effective index of the power spectrum at the scale For the CDM models the values of lie approximately between -2.0 and -2.4 for and systems, respectively, so that , with roughly between 1/6 and 1/10. Observations show a tight relation between luminosities and line width velocities for galaxies: the TF relation for disk galaxies (, and the Faber-Jackson (Faber & Jackson 1976, FJ) for the elliptical ones . To transform these empirical relations into a relation, where is the maximum circular velocity of the dark halo before the baryon dissipative collapse (this quantity is a measure of the gravitational potential of the virialized structure), we assume that (1) the luminosity is proportional to the visible mass, (2) the maximum rotation or dispersion velocities inferred from the measured line width profiles is proportional to (but see sections 4 and 5), and (3) the visible mass is a fraction of and all the baryon matter is incorporated into the visible structure (this assumption may not be realistic especially for the low velocity systems); if the mass distribution in galaxies resembles the primordial baryon-to-dark ratio, where , and is the Hubble constant in units of 50 kms-1Mpc-1. Then, we obtain,
| (2) |
where and m are the coefficient and the slope of the empirical TF or FJ relations, is the mass-to-luminosity ratio, and is the factor by which the maximum circular velocity increases after the dissipative collapse. Now, assuming that the radius of the virialized object is half the radius attained at the maximum expansion, the top-hat model gives:
| (3) |
In the case of the infrared (H band for example) TF relations the slope seems to be much smaller than the canonical value of 4 found in early studies with aperture photometry. A value in the range of 3.0-3.5 is more accepted today (e.g. Pierce & Tully 1988; Gavazzi 1993; Bernstein et al. 1994; Gavazzi, Pierini, & Boselli 1996). Thus, according to eq. (3), with between 0 and 1/10. Therefore, for disk galaxies the cosmological initial conditions either play a marginal role in establishing the TF relation, and/or the very simplified top-hat model is not able to describe the process of formation of these galaxies. For elliptical galaxies the slope of the FJ relation is roughly independent from the passband, and oscillates between 3.6 and 4.0 for the B to the H bands, respectively (de Vaucouleurs & Olson 1982). Hence, the slope of the Faber-Jackson relation is in agreement with the one derived from the power spectrum according to the top-hat model. It is commonly thought that the formation of elliptical galaxies indeed could have occurred through a violent collapse because they are typically more concentrated objects than disk galaxies, and poor in young stellar populations.
Another important global property of disk galaxies is the luminosity-radius relation, As Burstein and Sarazin (1983) have shown, this relation and the TF relation are connected through the protogalactic conditions. Under certain assumptions they found that Comparing this expression with eqs. (1) and (3) one obtains for disk galaxies. Gavazzi et al. (1996) have found 2.5 for observations in the H band, which is in excellent agreement with the observational estimates for , but again in conflict with the values predicted from the CDM power spectra in the frame of the top-hat model.
The most serious inconsistency of the top-hat model is related to the fact that the formation of cosmic structures implies a continuous process of mass aggregation. Furthermore, a given present-day mass is not characterized by a unique aggregation history, but a wide range of possibilities exists according to the statistical properties of the DFF (section 4). If, as a first order approximation, the MAHs are characterized by one parameter that could be, for example, the redshift when half of the mass is reached, then relation (1) might still be meaningful, and the model presented above could be useful as a heuristic approach able to connect initial cosmological conditions with global galaxy properties. In what follows we shall resort to a more detailed analysis of galaxy formation with the aim to study the questions stated here, as well as the structure of virialized objects, and to explore to what extent the properties of galaxies are connected with the cosmological conditions.
3 The virialization of dark halos
3.1 The analytical approximation
The dynamics of collapsing spherical shells in an expanding universe can be calculated in a first approximation through the spherical collapse model (e.g., Peebles 1980). The dynamics of these shells depend only on the mass contained within them and on the cosmological model. In the case of an Einstein-de Sitter universe, used throughout this paper, the collapse is described by the solution of a closed universe embedded in a flat universe.
Once the initial mass excess (over the average density of the universe, linearly extrapolated to the present epoch), within a sphere of commoving radius is given, the solution of the spherical collapse model allows us to calculate the imaginary density profile constructed by phasing out the maximum expansion times of all the shells to a fixed time. For simplicity consider the case of a self-similar profile, , where . After maximum expansion a mass shell falls to the center, and in a time of the order of the dynamical time virializes. If, as a preliminary approximation, we consider that the virialized (time averaged) radius is proportional to the maximum expansion radius, with for a given , then the shape of the imaginary density profile at the maximum expansion is conserved after the virialization. Thus, the density profile of the DM halo will be given by:
| (4) |
where was normalized to 0.5, and is the present average density of the universe. The case leads to an isothermal structure, while for a density profile decaying as arises.
Since in our approach to galaxy formation we try to reconstruct a present-day galaxy as a function of its collapse regime, instead of the fluctuation profiles it is more appropriate to give as initial conditions the MAHs parametrized in such a way that a total mass is attained by the present epoch :
| (5) |
In eq.(5) is the collapse time conventionally defined as twice the maximum expansion time. Using the spherical collapse model we have for the self-similar cumulative density profile that with , and on assuming a constant collapse factor the density profile of the virialized object (eq. (4)) in terms of the parameters of the MAH will be:
| (6) |
where is in units of Given the density profile by a simple integration it is easy to calculate the circular velocity profile:
| (7) |
Immediately one sees that flat circular velocity profiles are obtained for the high accretion regime case, while for the low accretion regime, , the velocity profiles are almost Keplerian. In this case one has a very concentrated object in the central regions (the circular velocities are high toward the center), while the most external regions are loosely bound. Eqs. (6) and (7) are useful as a first approximation to the more complex cases of no self-similarity and non constant collapse factors.
3.2 A higher order approximation for the virialized structure calculation
The main difficulty in calculating the virialization of spherical fluctuations in an expanding universe is introduced by the shell crossing which occurs after the maximum expansion phase. The problem is much simplified assuming that the dynamical time of a given inner shell is smaller than the outer shell aggregation time. Thus, the inner shell admits an adiabatic invariant. Gunn (1977) was the first who applied the adiabatic invariant formalism to calculate the effect of secondary infall on a virialized system with a power-law density profile. In Zaroubi & Hoffman (1993) the exact solutions for the asymptotic limit in the self-similar case were presented. We expand the approach of Zaroubi & Hoffman in order to study the more general case of non- self-similar collapse and non-radial motion. Ryden & Gunn (1987) treated this problem using another approach.
Under the assumption of spherical symmetry the fluctuation from which a galaxy emerges can be described as a sequence of concentric shells. During the early cosmological expansion each shell contains a mass , and it will reach a first maximum expansion at radius ; the function is given by the initial conditions. We assume that, given a shell, the internal ones have reached the first maximum expansion radius earlier than this, which implies a radially declining density profile for the fluctuation. After its first maximum expansion, each shell will fall toward the center due to the gravitational field of the internal mass and will evolve through a radial oscillatory movement. Each oscillation defines a maximum expansion radius (apapsis), which retains the information of . The function is crucial in our problem, and according to the initial conditions, it is an increasing monotonic function. The gravitational field at a radius is given by the shells with apapsis that permanently oscillate inside the radius and whose mass is , as well as by the shells with apapsis that only momentarily fall inside the radius and whose mass contribution is . If we assign to each shell a function , where represents the apapsis of the shell, and the probability to find the shell inside the radius , then
| (8) |
where is the apapsis of the last shell, i.e. always. The total mass inside a radius is
| (9) |
The function may be written as
| (10) |
where is the radial velocity of a shell with apapsis when its radius is . For a given shell the expression of is
| (11) |
where is the total energy of the shell, and is the typical angular momentum per unit mass of a shell mass element due to the thermal motion which will be taken constant in time. The condition defines the apapsis and a value which determines the maximum penetration of the shell towards the center. We express through the ratio and, although it is defined for the first and of every shell, through we are parametrically taking into account the thermal energy that could be produced by the mergers of substructures and tidal forces at all times. The sequential aggregation of new shells, combined with their motion toward the center, introduces new contributions to the gravitational field which acts on the underlying shells. This non-conservative spherical gravitational field changes , and consequently and of each shell. The contraction of leads to an asymptotic value of which is identified as the current virialized radius The change of may be estimated by assuming an adiabatic invariant for the radial motion. The problem is completely determined when (related to the MAH) and (related to the parameter are assigned. A simple iterative numerical method allows us to calculate the solution.
Once the initial conditions are given, through the method described above we are able to calculate the gravitational collapse and obtain the virialized structure of a DM halo. As thermal energy tends to zero (almost pure radial orbits), the virialized structure tends to present flat rotation curves down to the center, irrespective of the MAH. An increment in the value of the thermal energy (increasing the parameter for each shell) produces shallower cores in the halo. With the aim to test the numerical method the structures obtained in the self-similar case were compared with the analytical approximation given by eq.(7). An excellent agreement was found (Avila-Reese 1998).
3.3 Gravitational influence of the dissipative collapse
Baryonic matter is able to dissipate energy, therefore virialization is only an intermediate phase in the collapse of baryonic gas. This collapse can be halted only by centrifugal forces and/or when gas is transformed into stars. Here we assume that the gas fraction of a shell that has attained its maximum expansion, is incorporated into a disk in centrifugal equilibrium within a dynamical time (for galaxies the gas cooling time is typically smaller than the dynamical time (Silk 1977; Rees & Ostriker 1977; Silk 1984)). The collapsing baryon mass drags DM by gravitational interaction, making the DM halo more concentrated. We estimate this effect by allowing the baryon mass fraction, initially distributed as DM, to form a disk in centrifugal equilibrium, and by calculating its gravitational influence on the DM under the assumption of adiabatic compression of the halo (see e.g., Flores et al. 1993). On what concerns the ordered angular momentum it is assumed that the shells are in solid body rotation, and that every mass element maintains its angular momentum during the radial contraction. The angular momentum acquirement by protogalaxies is commonly explained by the tidal torques induced by neighboring density fluctuations on a given fluctuation that is still in its linear gravitational collapse regime (e.g., Peebles 1969; Thuan & Gott 1977; Fall & Efstathiou 1980; White 1984; Catelan & Theuns 1996). Using the Zel’dovich approximation it is possible to estimate how the specific angular momentum of a shell that contains a mass depends on this mass and on the time when the shell separates from the overall expansion, or equivalently, on the maximum expansion radius,
| (12) |
(e.g., White 1994). The angular momentum of structures identified as virialized in the analytical studies and the outcomes of N-body simulations is commonly expressed through the spin parameter where and are the total angular momentum and energy of the system. Most of these works find an average value for around 0.05 (e.g. Catelan & Theuns 1996, and references therein). We fix the factor needed in relation (12) in such a way that the of the evolving dark halo is equal to 0.05.
4 Initial conditions for galaxy formation from the primordial density fluctuation field
The two initial conditions required for calculating the collisionless gravitational collapse through the method described in subsection 3.2 are the MAH and the thermal energy content. The last one depends on the degree of substructure of the collapsing region and on the external tidal field. The limitations of the method (spherical symmetry and a not direct treatment of external forces) do not allow to explicitly introduce these effects. However, the thermal energy content can be considered in the problem as a free parameter that, as was discussed in subsection 3.2, is characterized by the orbital axis ratio .
In what regards the MAHs, their determination from the primeval DFF is much more direct. In the first atempts to establish a direct connection between the properties of virialized objects and the cosmological initial conditions (Peebles 1984; Hoffman & Shaham 1985; Ryden & Gunn 1987; Ryden 1988), the mean density profiles around local maxima of Gaussian fields calculated with the single-filter peak formalism (Peebles 1984; Bardeen et al. 1986) were used. Notwithstanding the good qualitative results obtained in these works, the single-filter peaks statistics is not adequate for calculating the initial density profiles from which galaxies will emerge, because of the high degree of correlation between the substructures on small scales with the smoothed fluctuation (Bardeen et al. 1986; Bond & Myers 1996).
The Press-Schechter or excursion set approach (e.g., Press & Schechter 1974; Peacock & Heavens 1990; Bower 1991; Bond et al. 1991; Jedamzick 1995) offers a more satisfactory method for determining the MAHs of dark halos (but see also Manrique & Salvador-Solè 1995, 1996). The key concept is that of the conditional probability that given a collapsed region of mass at some time , an object of mass (spatially chosen at random from within the volume containing the mass ) had collapsed at some earlier time This probability was independently deduced by Bower (1991) and Bond et al. (1991) for Gaussian fields. In this case the initial fluctuation power spectrum is the only statistical information needed to completely define the fluctuation field. The regions which have collapsed at time are identified as those regions whose linear cumulative density contrast has reached a critical threshold The spherical collapse model allows us to exactly calculate this threshold for any cosmology. Assuming , for an Einstein-de Sitter universe one obtains 1.69. A good agreement between the analytical Press-Schechter mass distribution -where plays the role of a parameter- and the results of N-body simulations has been found when a value smaller than 1.69 is used. We shall use the value suggested by Carlberg & Couchman (1989), =1.44. Now, fixing an initial mass and its cumulative density contrast at , recurrent trials with the mass distribution given by the conditional probability are applied (Lacey & Cole 1993, Eisenstein & Loeb 1996) to construct several MAHs which will serve as initial conditions for the gravitational collapse and virialization of dark halos. An example of what these MAHs look like can be found in Figure 1 of Avila-Reese & Firmani (1997).
Since our interest is to determine the initial conditions for disk galaxy formation, some constraints have to be applied to the MAHs. Disk galaxies tend to be isolated systems. That is why, according to the definition of isolated objects given by Jedamzick (1995), we consider only systems whose present-day mass virialized from a region overdense by which is not yet included in a larger region overdense by On the other hand, in calculating the MAHs one must follow the history of the main progenitor, which is attained by identifying the most massive subunity of the distribution at any time. This is realized as follows: for each temporal step at which a random mass at time was found given the mass at time through the Monte Carlo trial, we ask if the complementary mass is larger than if this is the case then, using mass conservation, we find the cumulative density contrast of the complementary region and again carry out a trial for obtaining the mass contained in the complementary region and collapsing at This procedure is repeated until the current complementary mass is smaller than the calculated collapsed mass. Among the collapsed regions with masses the most massive is chosen as the corresponding to and it is used as the conditional for the next time step.
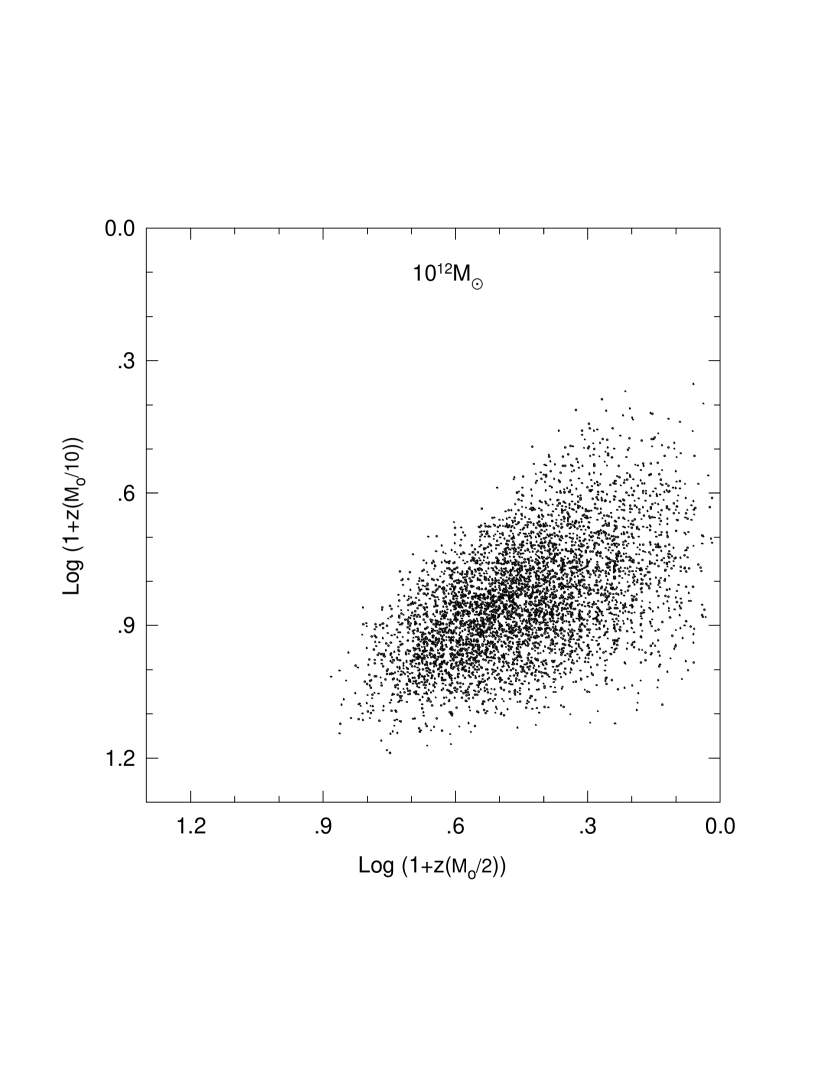
The random MAHs obtained are particular realizations of a multidimensional parent distribution defined by the statistical properties of the DFF. To reach a statistical description of the parent distribution in strict terms we should work in a n-dimensional space (n is the number of temporal steps), where every mass aggregation trajectory would have to be represented by a point. Nevertheless, a reasonable statistical description of the MAHs can be still given by two parameters, for example the redshifts and at which they attain half and one tenth of the present-day mass, respectively (a more detailed statistical analysis of this question is treated in Avila-Reese 1998). In the plane a point will correspond to a random MAH (see Figure 1). The random MAHs which fall into a given small region of this plane have rather similar morphologies along all their points, showing that two points are enough to characterize them.
5 Results and discussion
We now apply the method for calculating the virialization of spherical fluctuations in an expanding universe presented in section 3 to the initial conditions inferred from the statistical properties of the primeval DFF in the way described in section 4. Since our aim is to study the general behavior of the hierarchical clustering scenario in what concerns galaxy formation, as well as the structure and scaling laws of galactic halos, whose generalities do not depend on the assumed cosmology, results for a representative model are sufficient. Here these results are presented for the SCDM model with the power spectrum normalized to , which sets our work on a common ground with other studies, and facilitates comparisons of the approach.
5.1 The structure of dark matter halos
For a fixed present-day mass the initial conditions (the MAHs) will give rise to a family of DM halo structures. We choose as the representative cases the MAH obtained as the average of all the mass trajectories, and two trajectories (upper and lower) corresponding roughly to the two extreme deciles of the distribution of trajectories in the plane. This means that roughly 80% of all galactic halos will fall in the range defined by the chosen upper and lower cases. The median case is typically very similar to the average one.
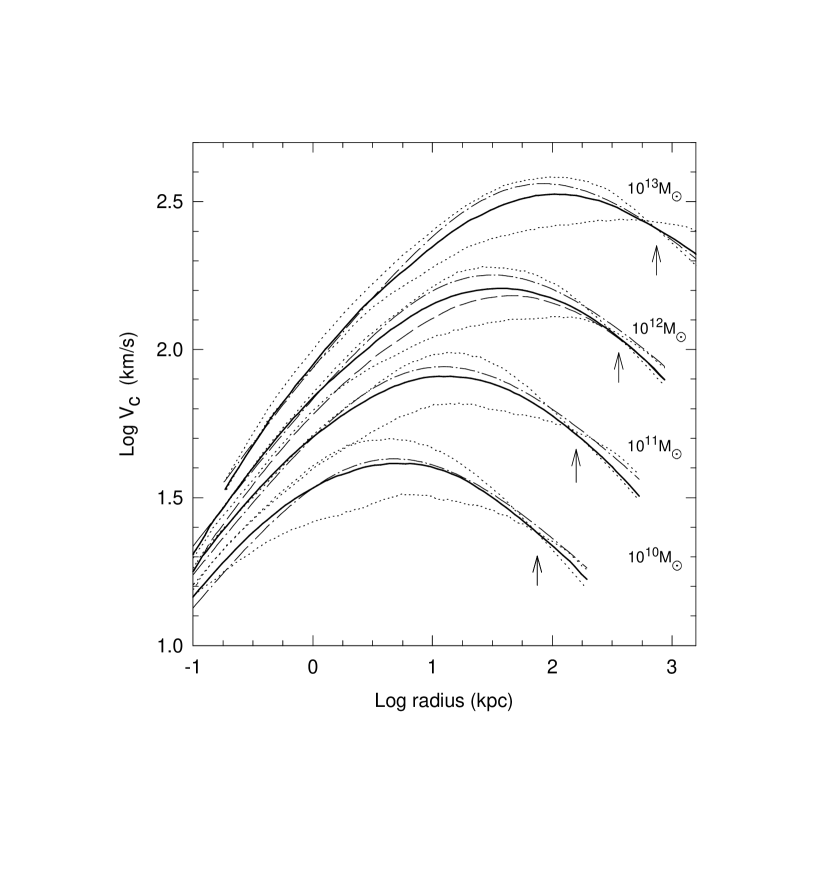
Figure 2 presents the logarithmic rotation curves of DM halos of and for the three chosen MAHs. The asymptotic structures of the halos are in agreement with the analytical solution for the self-similar case (subsection 3.1): halos formed through an initial fast collapse have a more concentrated structure than those which undergo a more extended collapse. To compare the DM halo structures obtained through our approach with the outcomes of cosmological N-body simulations, in Figure 2 we also plot the “universal” velocity profile proposed in NFW96 and NFW97 (appropriately calibrated to the SCDM =1 model) (dot-dashed lines). The circular velocity profiles inferred from these N-body simulations not only fall in the statistical range calculated here, but are in rough agreement with the profiles corresponding to the average initial conditions. It is encouraging that through two very different methods the result tends to be almost identical. This implies (i) that the complex nonlinear processes related to the non-sphericity of real fluctuations and the influence of external tidal forces play only a second-order role in establishing the structure of DM halos, and (ii) that the adiabatic invariant assumption on which the SIM is based is a good approximation to the problem of the cosmological gravitational collapse. As a matter of fact processes related to the mergers and tidal forces which could produce tangential perturbations (thermal energy) in the collapsing matter, were implicitly considered in our models through the free parameter ; it appears that the detailed description of these processes is largely erased by the virialization process, remaining only through the value of . The value 0.3 was fixed for all the shells.
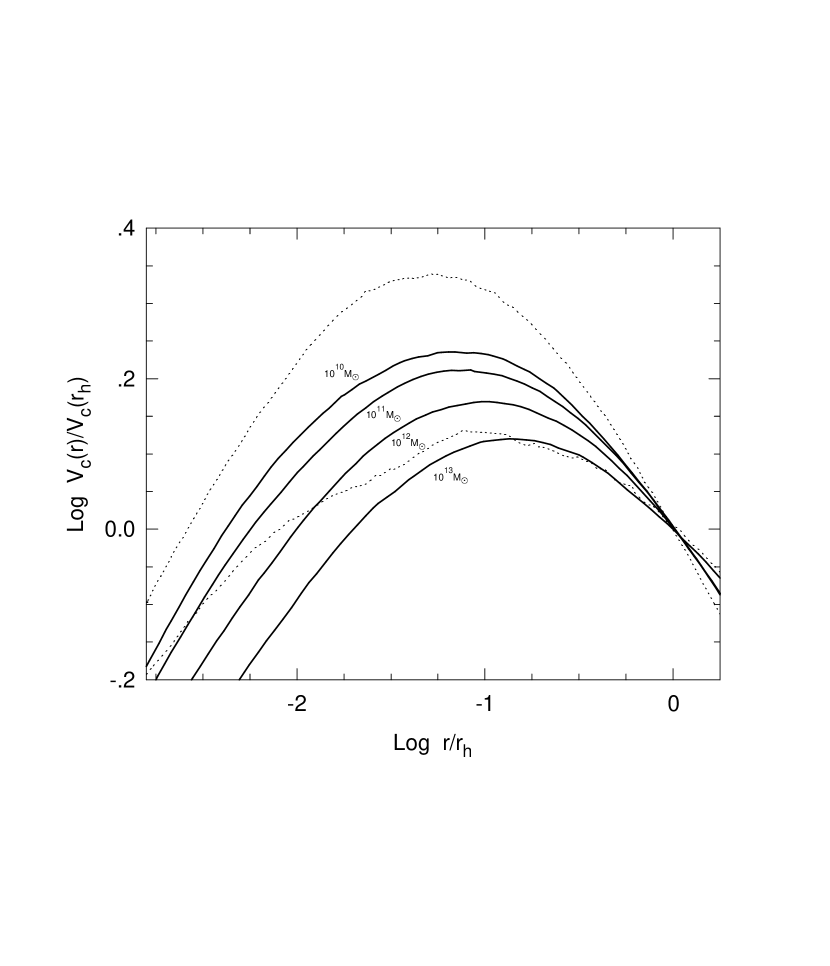
In Figure 3 we present the scaled rotation curves for the case of the most probable trajectories for four halo masses. For the halo the upper and lower deviations are also plotted (dotted lines). We scale radii by the virialized radius at the present epoch which encompasses , and circular velocities by their values at this radius. One observes a tendency of low mass systems to have more concentrated circular velocity profiles than the high mass ones, although the scatter for a given mass due to the statistical dispersion of initial conditions, is as significant as the differences due to the mass. Therefore, the density profiles of DM halos depend at least on two factors, namely (i) the mass and (ii) the scatter in the initial conditions which is in turn determined by the statistical properties of the primordial DFF. If the formation histories and structural properties of galactic halos are important in establishing the properties which define the Hubble sequence then these two factors should be considered when studying the origin of this sequence.
The fact that for the less massive halos the aggregation of matter is typically faster at early epochs than for the more massive halos is ultimately determined by the primordial fluctuation power spectrum. As a rough approximation, the epoch when the protogalaxy has attained half the present-day mass can conventionally be defined as its formation epoch (Lacey & Cole 1993). Then, through the excursion set formalism the distribution of the so-defined formation redshifts can be found. Using the average or median values of this distribution a direct relation between mass and the epoch of formation is derived (formula 2.32 in Lacey & Cole 1993). For instance, taking =-2, =1, the median value for (see Lacey & Cole), and the two masses and in the case of the top-hat model while according to the excursion set formula one gets approximately Our simulations for a power-law spectrum with =-2 and using the most probable MAHs give the same dependence. For the SCDM =1 power spectrum, such a dependence turns out even smaller, roughly Now in the light of the hierarchical clustering scenario, it is worth emphasizing that the observed slopes of the TF and luminosity-radius relations (see section 2) are in excellent agreement with the slope 1/15 of this nominal mass-formation redshift relation.
The central structure of DM halos is affected by the gravitational dragging of the baryon matter that dissipates and collapses within them. Using the method described in subsection 3.3 we have calculated this effect and obtained the final rotation curves. The values of 0.05 were used for the parameters and (assuming respectively, although it is important to bear in mind that these parameters can span a range of values, as is the case of the dispersion in found in the numerical and analytical calculations. This will introduce an extra scatter in the results of the final (after baryon collapse) structures. The main relevance of such a dispersion is related to the understanding of the disk Hubble sequence and the nature of the LSB galaxies (e.g., Dalcanton, Spergel, & Summers 1996). In the - range the maximum circular velocities after the dissipative collapse grow approximately by factors of 1.30 and 1.43 for the low and high MAH, respectively, and 1.34 for the average MAHs. The total rotation curves for all the cases are nearly flat or slightly decreasing. However, the rotation curves typically rise very steeply. This point seems to be related to a possible inconsistency of the models: the cuspy inner structure of DM halos. Indeed, when looking at the rotation curve decompositions, the modeled structures show a strong contribution to the gravitational potential of DM down to very small radii of the galaxy. The standard rotation curve decompositions applied to normal galaxies are commonly well fitted with a dominant disk gravitational contribution over that of the dark halo at the central regions (e.g. van Albada et al. 1985). In Figure 4 the rotation curve decomposition is shown for a galaxy where the most probable MAH was used. If the original dark halo velocity profile (“halo before” in the Figure) would rise more slowly, then the baryonic matter contribution to the gravitational potential would dominate at the center after its collapse, maintaining at the same time the rotation curve nearly flat. As we shall see, more direct observations of the internal structure of galactic halos seem to confirm the acuteness of this problem.
5.1.1 The inner density profile of dark matter halos
Since dwarf galaxies probably are systems strongly dominated by DM, their rotation curves could be providing direct information about the internal structure of the “virgin” DM halos. Flores & Primack (1994), Moore (1994), and Burkert (1995) have shown that the inner structures inferred from the rotation curves of dwarf spiral galaxies are characterized by a large core where the density profile is nearly flat. Low surface brightness galaxies also seem to provide direct probes of the internal structure of their dark halos, and signatures of large cores in them were found (de Blok 1997; de Blok & McGaugh 1997). Flores & Primack (1994) have also argued that gravitational lensing analyses on cluster scales exclude the possibility of coreless DM structures. Thus, the observational data about the internal dynamics of those systems whose DM halos have not been much deformed by the dissipative collapse of baryon matter tend to confirm that nature produces DM halos with large cores. As has been shown above, our results for a Gaussian SCDM model predict DM halos with density profiles slightly shallower than for the central regions. From the outcomes of high resolution cosmological N-body simulations carried out in recent years, similar inner profiles (Dubinsky & Carlberg 1991; Katz 1991; Warren et al. 1992; Crone, Evrard, & Richstone 1994; NFW96, NFW97; Cole & Lacey 1996, Kravtsov et. al. 1997a), or even steeper (Fukushige & Makino 1996, Moore et al. 1997) were found. This incompatibility between models and observations was pointed out as a shortcoming of current cosmological models. However, in a recent work by Kravtsov et al. (1997b), who carefully reanalyzed this problem, they conclude that the internal structures of DM halos produced in their high resolution N-body simulations for several CDM models are actually in reasonable agreement with the observations.
In our approach the dynamical collective processes related to the substructures are not treated explicitly. Therefore, some of these processes could be the basis of an effective mechanism of energy pumping into the central regions of the dark halo. For example, it is possible that the central part of the halo gains thermal energy due to the orbital energy loss from dynamical friction of the lumps which are spiraling in toward the center, and which could be disrupted by tidal stripping. Within the frame of our approach this effect is compatible with the introduction of radial perturbations in the orbital motion of the shells. In a future work this possibility will be studied in detail. We should note that for a given initial density profile or MAH a larger tangential velocity component (a larger ) tends to reduce the dark halo central density since the orbits of the infalling particles are more circular. However, if the MAH is such that it extends continuously to very early epochs as a power law, then, even with =1, the virialized structure will be coreless. On the other hand, values for larger than 0.3 (the corresponding eccentricity of the orbit is ) are not satisfactory as they imply an extreme situation of dominion of tangential motion with respect to the radial motion.
A second vein of exploration in looking for alternatives to produce cores in the DM structures is related to the cosmological initial conditions. Having assumed the statistical properties of the primordial DFF, the most obvious influence of the cosmological model on the internal structure of the DM halo is related to the nature of the collisionless particles. If the primordial density fluctuations are constituted by hot or warm DM particles, then a minimal physical length scale for the fluctuations will exist. To explore how the internal structures of virialized objects will change in this case we use a power spectrum with a cut-off at some minimal scale. It is reasonable to take this cut-off at the mass scale of the order of ; otherwise, other mechanisms aside from hierarchical clustering should be invoked in order to form low mass galactic halos. We assume a toy power spectrum (WDM) which is like the SCDM down to the scale corresponding to and from this scale towards smaller masses -if viewed as the mass variance- it flattens faster than the SCDM in such a way that at it is completely flat; scales smaller than are suppressed.
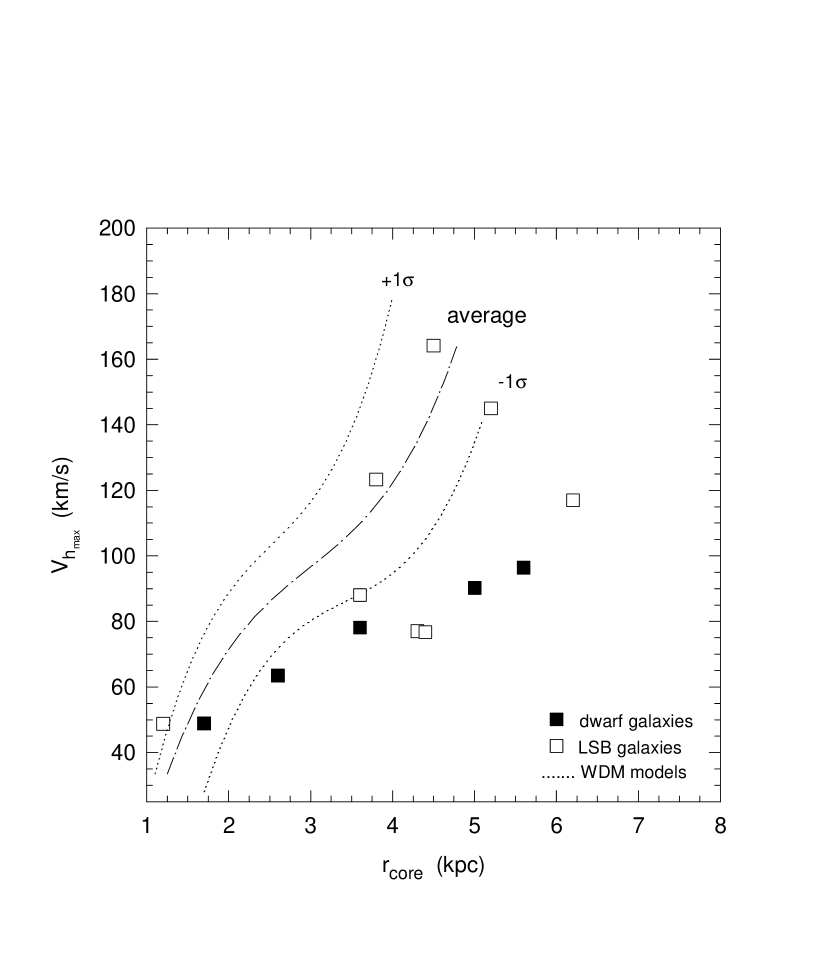
The DM halos constructed using the WDM-like power spectrum have a constant density core. Burkert (1995) has pointed out that the observational data for the dwarf galaxies show some scaling relations between, for example, the core radius and the rotation velocity at this radius. To reproduce this kind of correlation and to compare with the predictions of the WDM-like model, we shall use a fitting formula for both the observed and theoretically calculated rotation curves. This formula is based on a density profile of the form:
| (13) |
where was fixed to a value of 10. Note that according to our results the structures of the DM halos are not described by a single density profile. Nevertheless, as a first approximation, and bearing in mind that the observational data are still incomplete, formula (13) is assumed here as universal. The observational data to be considered consist of the 4 dwarf galaxy rotation curves used in Moore (1994) and Burkert (1995), the halo rotation curves of the dwarf galaxy NGC55 derived from the decomposition given in Puche & Carignan 1991, and the measured rotation curves of the 8 most DM dominated galaxies of the 17 LSB galaxies presented in de Blok & McGaugh (1997). The models were calculated in such a way that a envelope is taken into account. In Figure 5, the maximum rotation velocity and the core radius obtained from the fitting to the observational data and the WDM models using formula (13) are plotted. The fitting was applied to the increasing part of the rotation curves. The standard deviation of the fitting formula, scaled to the maximum circular velocity given by the same fitting, , is less than for all the cases. Consequently, the noise introduced by this fitting procedure in the determination of the core size is negligible with respect to the observational uncertainties. Dwarf galaxies show a tight relation between and , while the LSB galaxies show a big dispersion in this plane. It is important to remark that a large observational error is expected in the velocity measurements of the LSB galaxies, typically associated with beam smearing. According to Figure 5 when one compares the structures corresponding to the dwarf galaxies with the DM halo structures produced in a WDM-like model, this model does not satisfactorily reproduce the observational trend of with in spite of its ability to generate near constant-density cores. However, for the LSB galaxies some agreement with the predicted structures is found, although the scatter is large. A better understanding of the physics of dwarf galaxies and more observational data on both the LSB and dwarf galaxies is necessary to reach more definitive conclusions.
The other question related to the ability of the initial cosmological conditions to influence the internal structure of DM halos is the statistics of the primordial DFF. The MAHs strongly depend on the assumed statistical distribution. In the case of Gaussian fluctuations, for the CDM models the MAHs are such that they continuously extend to very early epochs giving rise to the steep inner density profiles. While for the lognormal distribution the situation may be even worse, other possible statistical distributions for the primordial DFF might in principle generate MAHs able to produce non-singular DM halos.
5.2 The Tully-Fisher relation and its scatter
It was shown that DM structures emerge from the primordial DFF with different configurations. Now we shall estimate the statistical distribution of these configurations, as well as the global relation between the mass and the gravitational potential of them.
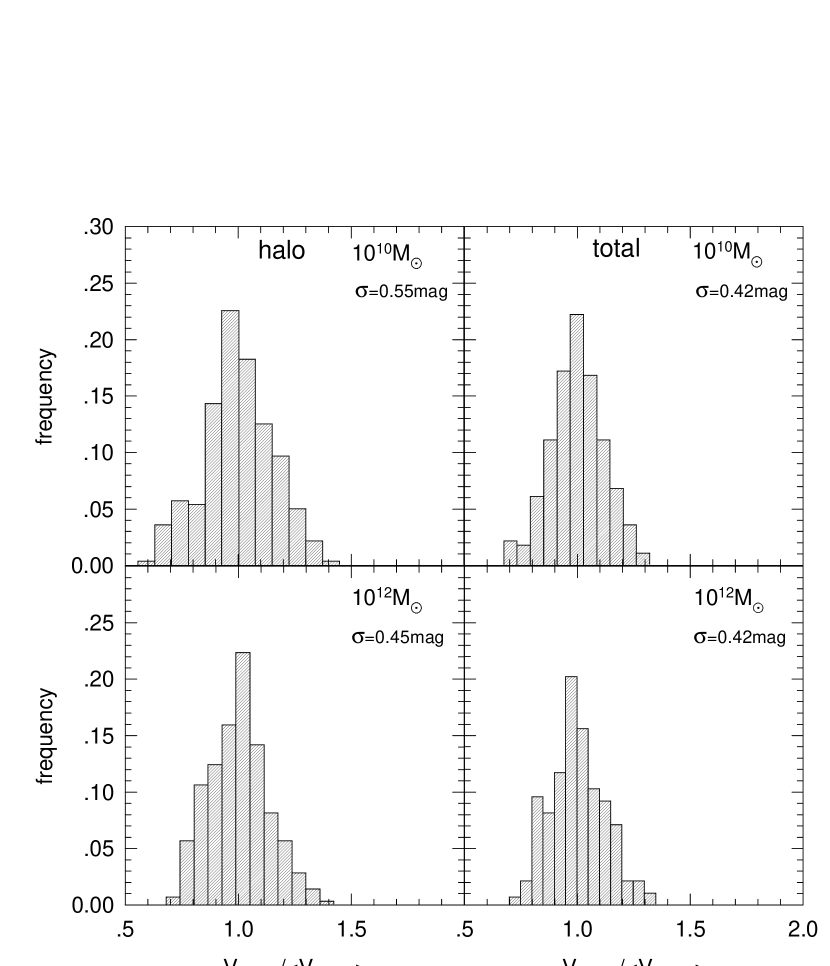
The maximum circular velocity of a DM halo, , is a good characterization of its gravitational potential. For a given mass, halos with larger maximum circular velocities are more concentrated, and most of their matter should have been assembled at earlier times, when the density of the universe was higher. This directly depends on the initial conditions, i.e. the MAHs generated from the primordial DFF. Given that we know the probability of realization of every one of the points (mass trajectories) in the plane , we can easily find the probability distribution of the maximum circular velocities (section 4). In Figure 6 the frequency distributions of maximum circular velocities corresponding to halos before (a) and after (b) baryon gas collapse are shown for two masses, and , and for the SCDM model. The velocities were scaled by the average velocity. It is seen that the distributions are slightly asymmetrical. The corresponding averages and fractional standard deviations are given in Table 1. The frequency distributions of maximal circular velocities are slightly narrower after the dissipative collapse: initially more concentrated dark halos are less affected by the gravitational dragging of collapsing dissipative matter than the more diluted halos.
Since for a given mass a range of circular velocities exists, in order to establish a relationship between and the “cosmological” TF relation, it is necessary to define a typical circular velocity. Here we shall use the average velocity, as this typical velocity for a given mass. This case roughly corresponds to the average MAH. The relation is where 3.5104 , and on average 3.38 ( very slightly increases with the mass) for the SCDM model, and 2.3105, 3.02 for the WDM-like model. From the analytical estimate of section 2 it was established that the slope of the relation depends on the slope of the relation. When 0, then 3. The small slope of the “cosmological” TF relation found in our simulations for the SCDM model indeed completely agrees with the above mentioned small value for (1/15). The relationship between the disk mass and the average maximum total velocity after the gas collapse, , , is nearer to the observable TF relation. After the dissipative collapse we obtain on the average 560, and 3.41 for the SCDM model, and 2.0103, 3.18 for the WDM-like model. The dispersions for both relations can be roughly characterized by the fractional standard deviations of maximum circular velocities, (see Table 1). They slightly decrease with increasing mass. The fractional standard deviations in the are slightly smaller than those previously estimated by Eisenstein & Loeb (1996) who used a much more simplified scheme to calculate the cosmological TF scatters (note that they use a SCDM model normalized to =1.3). Using the slopes of the and relations for the SCDM model the fractional standard deviations in velocities were translated to dispersions in masses expressed in astronomical magnitudes (columns 4 and 7 of Table 1). It is interesting to note that after the dissipative collapse the scatters tend to reduce.
The physical origin of the empirical TF relation is still unclear. The most general layout of this question deals with the “nature or nurture” dualism, i.e. was the TF relation established by the initial conditions of galaxy formation (and, if any, by the same cosmological conditions), or did it arise as a product of some evolutionary processes mainly related to the gas hydrodynamics and star formation history. In the light of the results obtained within the approach developed here we shall explore whether this relation is a product or not of the cosmological initial conditions. Since the galactic luminosity in the redder bands is dominated by older, low-mass stellar populations, the luminosity in these bands is a reliable tracer of the disk stellar masses. We shall use the TF relations in the H band presented in Gavazzi (1993), and in Peletier & Willner (1993). Although the absolute magnitudes for cluster and field galaxies in Gavazzi (1993) were obtained through aperture photometry, some corrections were applied in order to obtain an estimate of the total light emitted by galaxies in the H band (see the references given in Gavazzi 1993). The line widths were not corrected for noncircular motions. Therefore, in order to estimate the maximum rotational velocity, we apply the formula suggested in Tully & Fouquè (1985), and we normalize it in such a way that the corrected line widths in the range of 250 to 350 kms-1 were in agreement with the transformations from radio to optical line widths given by Courteau (1992) and Mathewson et al. (1992). The average corrections for the different levels at which the line widths are measured in the different works were taken from Haynes & Giovanelli (1984). Peletier & Willner (1993) presented H band imaging of a complete sample of galaxies in the Ursa Major cluster and obtained total magnitudes for these galaxies. Using H I velocity widths from the compilation of Bottinelli et al. (1990), and applying the nonrotational correction according to Tully & Fouquè (1985), Pelletier & Willner derived the H band TF relation. We normalize their corrected line widths to the optical observations of Courteau (1992) and Mathewson et al. (1992), and we assume a distance modulus to the Ursa Major cluster of 30.95 and a value of H0=85 kms-1Mpc-1, because this is the value that seems to be in better agreement with this assumed distance modulus (Pierce & Tully 1988). Now, in order to transform luminosities into masses a mass-to-luminosity ratio should be assumed. As Gavazzi et al. (1996) have shown, in the H band this ratio seems to be constant. They have calculated from a large sample of galaxies the dynamical mass-to-luminosity ratio: =2.3 in solar units. Now, using the canonical value of 2 for the dynamical-to-visible mass ratio inside the optical radius in spiral galaxies (e.g., Rubin 1987), we obtain in solar units. A more direct estimate of this ratio was made by Thronson & Greenhouse (1988) using the observed stellar population in the solar neighborhood. They found a value for the total stellar mass-to-H luminosity ratio of 0.55 in solar units, and they extend this ratio to apply to a wide range of galaxies. Considering that on average in the disks of spiral galaxies 20% of the mass is contained in gas, the disk mass-to-H luminosity ratio will be 0.7. If we assume that the value of the Hubble parameter is 70 kms-1Mpc-1, then this mass-to-luminosity ratio scaling with the Hubble parameter will be . Using M=3.46 mag, the TF relations given by Gavazzi (1993) and Pelletier & Willner (1993) and corrected as explained above, can be now transformed to the next disk mass-circular velocity relations:
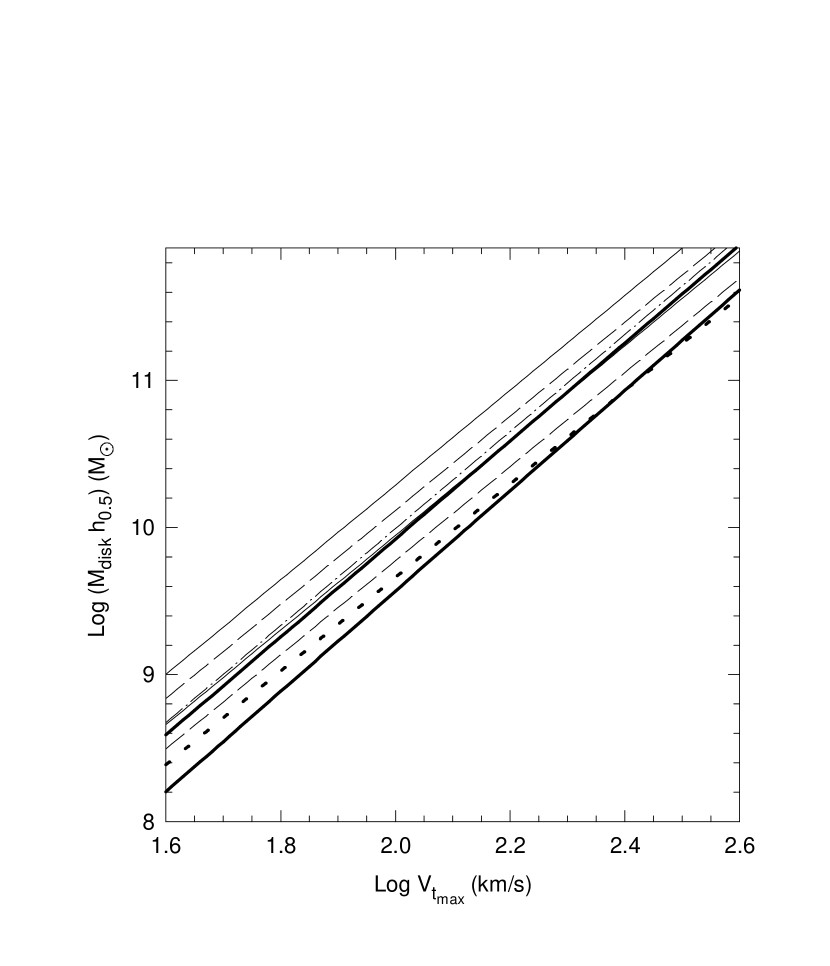
where the velocity is given in km/s, and the first and second lines in each expression correspond to the Gavazzi et al. (1996) and Thronson & Greenhouse (1988) mass-to-light estimates, respectively. These relations are plotted in Figure 7.
For the I band we use the template TF relation presented in Giovanelli et al. (1997). The mass-to-luminosity ratio in the I band is also not much dependent on mass or luminosity. If we use the slopes presented in Gavazzi et al. (1996) for this dependence in the U, B, V and H bands, and interpolate the corresponding value for the I band, we find that Normalizing this relation in such a way that a typical galaxy ( has 1.8 (Pierce 1990, taking H0=85 kms-1Mpc-1), and assuming again a dynamical-to-visible mass ratio of 2, we obtain . With this estimate, and using M=4.19 mag the mass-circular velocity relation presented in Giovanelli et al. (1997) will be:
where the velocity is given in km/s. This relation is also plotted in Figure 7. The lower thick solid and point lines in Figure 7 correspond to predictions for SCDM and WDM-like models, respectively. Note that the mass is scaled with the Hubble parameter. Strictly speaking, the curves corresponding to the models should not be plotted in this graphic since they were calculated only for one value of the Hubble parameter (=1). Nevertheless, it is easy to show that the model curves in Figure 7 will have roughly the same behavior with as the observational curves. Since and according to the top-hat model where is related to the power spectrum index, then Using for the SCDM model 1/15 (see above), then In the case of the WDM model is even smaller than this value. For the observational curves the velocity roughly scales with the Hubble parameter as where 3.2-3.3. Therefore, in Figure 7 the observational and theoretical curves scale with roughly in the same way.
The mass-velocity relations theoretically obtained for the SCDM and WDM-like models have slopes very similar to the ones inferred from observations. However, as it is seen in Figure 7, these models, specially the CDM case, produce objects with too high circular velocities. This is not a surprise since it is well known that the SCDM model suffers from an excess of power at small scales. We have calculated models for the same SCDM case, but taking a value suggested by the masses and abundances of rich clusters of galaxies (White, Efstathiou, & Frenk 1993). The obtained mass-velocity relation is plotted in Figure 7 (upper thick solid line). The curve is clearly better centered in the range of the observational estimates, and it is very near to the curves we consider most reliable. An extrapolation to galactic scales of the observational estimates for the galaxy distribution power spectrum (see fig. 4 in Stompor et al. 1996, and references therein) is also in rough agreement with a SCDM power spectrum normalized to . We argue that at the basis of this consistency is the fact that the TF relation is a manifestation at galactic scales of the same mass distribution observed at larger scales, and primarily established by the initial cosmological conditions, i.e. the power spectrum of fluctuations. It is worth noting that the SCDM power spectrum at galactic scales roughly resembles the COBE normalized power spectrum of a flat CDM model with 0.7 and 0.7.
The question of the scatter in the TF relation has been widely discussed in the literature (for a review see Strauss & Willick 1995). Recent studies by Willick et al. (1997) (see for the other references therein), and by Mathewson & Ford (1994) using large and complete samples, found scatters in the I band of 0.35-0.40 mag and 0.42 mag, respectively; in the H band a scatter of 0.45 mag was found (see the reference in Strauss & Willick 1995). The scatter estimated in Giovanelli et al. (1997) for the I band varies between 0.25 mag among fast rotators to 0.40 mag among the slowest rotators of their sample. Eisenstein & Loeb (1996) have shown that for open or flat, low- CDM models the scatter is lower than for the SCDM model. The ratio of the scatters of the flat, 0.7, and the SCDM models which they calculated is roughly 0.7. Hence, the scatter of 0.42 mag predicted here for the SCDM model could be reduced to 0.3 mag for the flat, 0.7 model.
To estimate the influence of different on the results obtained here, we have calculated models with 0.1 for the SCDM case. In the range of the slope of the TF relation remains the same as for the 0.05 case, while the zero-point increases by a factor of 1.73 which corresponds to 0.57 mag. Taking this value as a standard deviation -which can be considered as an upper limit since the intrinsic distribution of is commonly approximated by a lognormal distribution with 0.05 and (e.g., Catelan & Theuns 1996)- and considering that the dispersions in and in the MAHs are independent -again this will imply an upper limit estimate- the standard deviation of the SCDM TF relation would result be 0.71 mag, while for the CDM model it could be 0.64 mag. If these theoretical estimates of the TF scatter are intended to be compared with the observational data, then the last should consider also the family of LSB galaxies since the effect of changing directly reflects on the surface brightness and scale lengths of disk galaxies.
6 Conclusions
1. In a hierarchical clustering scenario the shapes of DM virialized structures depend on mass and on the history of mass aggregation of the systems, ranking from very compact configurations to nearly isothermal structures. The range of MAHs for an isolated galaxy of a given mass follows a distribution determined by the statistical properties of the primordial DFF. The average MAHs corresponding to a given mass produce DM halos with a density profile well described by the outcomes of N-body cosmological simulations (NFW96, NFW97, Kravtsov et al. 1997a). Since our approach is based on the assumption of spherical symmetry, adiabatic invariance, and only a moderate influence of the external tidal forces on the gravitational collapse, such an agreement reveals the robustness of these assumptions, at least in what concerns the external structure of DM halos.
2. The inner density profiles of dark halos produced in the SCDM model (and probably in other CDM models) are slightly shallower than Direct (rotation curves of dwarf and LSB galaxies) and indirect (rotation curve decompositions of normal galaxies) observational data do not confirm this result. Collective dynamical processes related to the collapsing substructures which are considered only in a parametric and limited fashion in our approach, may be at the heart of this inconsistency. These processes might be able to generate efficient mechanisms of energy pumping to the central regions of the dark halos. Comparisons with the results of high resolution N-body simulations will show whether these processes are important or not. Unfortunately the results of the N-body simulations are still controversial. Introducing a cut-off at low wavelengths in the power spectrum of fluctuations, i.e. using a WDM-like model, we have found that the virialized structures have nearly constant density-profile cores, although the size of these cores tend to a constant value as the maximum circular velocities of the system increase.
3. Within the frame of the heuristic approach given in section 2 the slope of the TF relation is easily connected to the slope of the nominal mass-formation redshift relation. In the more realistic context of hierarchical clustering, galaxies are continuously forming according to their MAHs which determine the structures of their DM halos. Since the MAHs depend on mass and on the statistical properties of the primordial density fluctuations, a structural relation between total mass and the maximum circular velocity of the system (the cosmological TF relation), with a natural scatter, arises. For a SCDM model we predict 3.510 with a fractional standard deviation in velocity, , of 16% and 13% for and systems, respectively. For the WDM-like model used here, we obtained 2.310 and the deviations are smaller than for the SCDM model.
4. The dissipative collapse of the baryon gas within the virialized DM halos increases the concentration of the halos in the central regions. The factor by which the maximum circular velocity increases after the dissipative collapse, taking ==0.05 and =0.05, for the SCDM model, oscillates roughly between 1.30 and 1.43. The dissipative collapse tends to reduce the initial scatter in the mass-maximum circular velocity relation: for both the and SCDM galaxies the resulting standard deviations in velocity are 12%, or 0.42 mag. The disk mass-maximum rotation velocity relation for the SCDM model is 560, while that for the WDM-like model is 2.010. The slopes of these relations are in good agreement with the observational estimates.
5. Although the maximum circular velocities of the structures after baryon collapse decrease with increasing the spin parameter , the slope of the TF relation remains the same. The theoretical TF scatter (an upper limit) estimated as the independent combination of the dispersions in the MAHs and in increases to 0.7 mag for the SCDM model.
6. The 1 SCDM model produces galaxies with high rotation velocities as compared to observations (Figure 7). Using a SCDM power spectrum normalized to , the theoretical prediction is in excellent agreement with the most reliable observational estimates of the H and I band TF relations. The observational estimates of the space galaxy distribution are also in agreement with the SCDM power spectrum with this normalization (at galactic scales this power spectrum is similar to that of the flat, COBE normalized, CDM model with 0.7 and 0.7). In this way, the H and I band TF relations can be considered as the natural extension to galactic scales of the galaxy distribution power spectrum, which reveals that the TF relation is mainly a product of the power spectrum of fluctuations and the rate at which the protogalaxies aggregate mass, i.e. at the basis of its nature are the cosmological initial conditions. The H and I band TF relations can be used to probe the power spectrum at galactic scales.
In a forthcoming paper the galactic evolution of the disks built up in the evolving dark halos will be calculated with the aim to explore the possibility that the morphological Hubble sequence is a direct result of the cosmological initial conditions, and to find the parameters on which this sequence depends.
-
Albada, T.S. van, Bahcall, J.N., Begeman, K., & Sancisi, R. 1985, ApJ, 295, 305
-
Avila-Reese, V. 1998, PhD. Thesis, UNAM
-
Avila-Reese, V., & Firmani, C. 1997, in “Dark and visible matter in galaxies and cosmological implications”, eds. Persic, M., & Salucci, P., ASP Conference Series, vol. 117, 416
-
Bardeen, J.M., Bond, J.R., Kaiser, N., & Szalay, A.S. 1986, ApJ, 304, 15
-
Bernstein, G.M., Guhathakurta, P., Raychaudhury, S., Giovanelli, R., Haynes, M.P., Herter, T. & Vogt, N.P. 1994, AJ, 107, 1962
-
Bond, J.R., Cole, S., Efstathiou, G., & Kaiser, N. 1991, ApJ, 304, 15
-
Bond, J.R., & Myers, S.T. 1996, ApJS, 103, 1
-
Bottinelli, L., Gouguenheim, L., Fouquè, P., & Paturel, G. 1990, A&AS, 82, 391
-
Bower, R.G. 1991, MNRAS, 248, 332
-
Burkert, A. 1995, ApJ, 447, L25
-
Burstein, D., & Sarazin, C.L. 1983, ApJ, 264, 427
-
Carlberg, R., & Couchman, H.M.P. 1989, ApJ, 219, 18
-
Catelan, P., & Theuns, T. 1996, MNRAS, 282, 436
-
Cole, S.M. & Lacey, C. 1996, MNRAS, 281, 716
-
Crone, M., Evrard, A.E., & Richstone, D.O. 1994, ApJ, 434, 402
-
Courteau, S. 1992, Ph.D. Thesis, University of California, Santa Cruz
-
Dalcanton, J.J., Spergel, D.N., & Summers, F.J. 1996, ApJ, 482, 659
-
de Blok, W.J.G. 1997, in “Dark and visible matter in galaxies and cosmological implications”, eds. Persic, M., & Salucci, P., ASP Conference Series, vol. 117, 39
-
de Blok, W.J.G., & McGaugh, S.S. 1997, ApJ, MNRAS, 290, 533
-
de Vaucouleurs, G., & Olson, D.W. 1982, ApJ, 256, 346
-
Dubinsky, J., & Carlberg, R.G. 1991, ApJ, 378, 496
-
Eisenstein, D.J., & Loeb, A.1996, ApJ, 459, 432
-
Faber, S.M., & Jackson, E.J. 1976, ApJ, 204, 668
-
Fall, S.M., & Efstathiou, G. 1980, MNRAS, 193, 189
-
Flores, R.A., & Primack, J.R. 1994, ApJ, 427, L1
-
Flores, R.A., Primack, J.R., Blumenthal, G.R., & Faber, S.M. 1993, ApJ, 412, 443
-
Fukushige, T., & Makino, J. 1996, ApJ, 477, L9
-
Gavazzi, G. 1993, ApJ, 419, 469
-
Gavazzi, G., Pierini, D., and Boselli, A. 1996, A&A, 312, 397
-
Giovanelli, R., Haynes, M.P., Herter, T.H., Vogt, N.P., da Costa, L.N., Freudling, W., Salzer, J.J., & Wegner, G. 1997, AJ, 113, 53
-
Gott, J.R. 1975, ApJ, 201, 296
-
Gott, J.R., & Rees, M.J. 1975, A&A, 45, 365
-
Gunn, J.E. 1977, ApJ, 218, 592
-
Gunn, J.E., & Gott, J.R. 1972, ApJ, 176, 1
-
Haynes, M.P., & Giovanelli, R. 1984, AJ, 89, 758
-
Hoffman, Y. 1988, ApJ, 328, 489
-
Hoffman, Y., & Shaham, J. 1985, ApJ, 297, 16
-
Jedamzik, K. 1995, ApJ, 448, 1
-
Katz, N. 1991, ApJ, 368, 325
-
Kravtsov, A.V., Khoklhov, A.M. & Klypin, A.A. 1997a, ApJS, 111, 73
-
Kravtsov, A.V., Klypin, A.A., Bullock, J., & Primack, J. 1997b, preprint (astro-ph/9708176)
-
Kuhlman, B., Melott, A.L., & Shandarin, S.F. 1996, ApJ, 470, L41
-
Lacey, C., & Cole, S. 1993, MNRAS, 262, 627
-
Manrique, A. & Salvador-Solé, E. 1995, ApJ, 453, 6
-
. 1996, ApJ, 467, 504
-
Mathewson, D.S., Ford, V.L. 1994, ApJ, 434, L39
-
Mathewson, D.S., Ford, V.L., & Buchhorn, M. 1992, ApJS, 81, 413.
-
Melott, A.L., Shandarin, S.F., Splinter, R.J., & Suto, Y. 1997, ApJ, 479, L79
-
Moore, B. 1994, Nature, 370, 629
-
Moore, B., Governato, F., Quinn, T., Stadel, J., & Lake, G. 1997, preprint, (astro-ph/9709051).
-
Navarro, J., Frenk, C.S., & White, S.D.M. 1996, ApJ, 462, 563 (NFW96)
-
. 1997, ApJ, 490, 493 (NFW97)
-
Peacock, J.A., & Heavens, A.F. 1990, MNRAS, 243, 133
-
Peebles, P.J.E. 1969, ApJ, 155, 393
-
. 1980, “The Large Scale Structure in the Universe” (Princeton University Press, Princeton)
-
. 1984, ApJ, 277, 470
-
Peletier, R.F., & Willner, S.P. 1993, ApJ, 418, 626
-
Pierce, M.J. 1990, in “Evolution of the Universe of Galaxies”, ed. Kron, R.G. (ASP vol.10, Provo, Utah), p.48
-
Pierce, M.J., & Tully, R .B. 1988, ApJ, 330, 579
-
Press, W.H., & Schechter, P. 1974, ApJ, 187, 425
-
Puche, D., & Carignan, C. 1991, ApJ, 378, 487
-
Rees, M.J., & Ostriker, J.P. 1977, MNRAS, 179, 541
-
Rubin, V.C. 1987, in IAU Symp. 117, “Dark Matter in the Universe”, eds. J. Kormendy & G. Knapp (Dordrecht: Reidel), p.51
-
Ryden, B.S. 1988, ApJ, 329, 589
-
Ryden, B.S. & Gunn, J.E. 1987, ApJ, 318, 15
-
Silk, J. 1977, ApJ, 211, 638
-
. 1984, Nature, 301, 574
-
Stompor, R., Gorski, K.M., & Banday, A.J. 1996, MNRAS, 277, 1225
-
Strauss, M.A., & Willick, J.A. 1995, Phys. Rep., 261, 271
-
Thuan, T.X., & Gott, J.R. 1977, ApJ, 216, 194
-
Tóth, G., & Ostriker, J.P. 1992, ApJ, 389, 5
-
Thronson, H. A., & Greenhouse, M.A. 1988, ApJ, 327, 671
-
Tully, R.B., & Fisher, J.R. 1977, A&A, 54, 661
-
Tully, R.B., & Fouquè, P. 1985, ApJS, 58, 67
-
Voglis, N., Hiotelis, N., & Harsoula M. 1995, Ap&SS, 226, 213
-
Warren, M.S., Quinn, P.J., Salmon, S.K., & Zurek, W.H. 1992, ApJ, 399, 405
-
Willick, J.A., Courteau, S., Faber, S.M., Burstein, D., Dekel, A., & Strauss, M.A. 1997, ApJS, 109, 333
-
White, S.D.M. 1984, ApJ, 286, 38
-
. 1994, preprint MPA 831
-
White, S.D.M., & Rees, M.J. 1978, MNRAS, 183, 341
-
White, S.D.M., Efstathiou, G., & Frenk, C.S. 1993, MNRAS, 262, 1023
-
Zaroubi, S., & Hoffman, Y. 1993, ApJ, 416, 410
-
Zaroubi, S., Naim, A., & Hoffman, Y. 1996, ApJ, 457, 50
| Massaain units of | bbbefore the baryonic collapse, in | ccafter the baryonic collapse, in | ||||
|---|---|---|---|---|---|---|
| 1 | 41.0 | 0.16 | 0.55 | 55.7 | 0.12 | 0.42 |
| 100 | 161.4 | 0.13 | 0.45 | 215.0 | 0.12 | 0.42 |