Neutral Hydrogen in the Edge-on Spiral Galaxy NGC 3044 – Global Properties and Discovery of HI Supershells
Abstract
The first detailed VLA mapping of the neutral hydrogen distribution in the isolated, edge-on spiral galaxy NGC 3044 is presented. Physical parameters such as , , etc. determined for this galaxy are typical for galaxies of its morphological class (SBc). We have modelled the HI spectra in order to derive its global density and velocity distributions. An HI scale height of 420 pc is thus found. This can be compared to the impressive radio continuum halo, previously found to extend to above the midplane.
The present study reveals an asymmetry in the HI distribution as well as numerous high-latitude HI structures at various galactocentric radii. The approaching (northwest) side of the galaxy is 14% less massive than the receding side and its rotation curve does not reach terminal velocity. The rotation curve of the receding (southeast) side however resembles that of a normal galaxy.
Twelve high-latitude features were catalogued, of which four exhibit the signature of an expanding shell. There is some correlation of these features with features observed in the radio continuum from independent data. The most massive shell (Feature 10) extends out to 6 kpc above the galactic disk. The radii and masses of these shells range from and , respectively. We have investigated the possibility that the supershells could have been produced by external impacting clouds, but conclude that this scenario is unattractive, given the age of the shells, the isolation of the galaxy, and the lack of any observed features sufficiently massive to form the shells in the vicinity of the galaxy. Therefore, an internal origin is suggested. Since the implied input energies from supernovae are extremely high (e.g. from , corresponding to 400 74,000 supernovae), we suggest that some additional energy (e.g. from magnetic fields) may be needed to produce the observed supershells.
Lee and Irwin \rightheadHI in NGC 3044
1 Introduction
More than a decade ago, Heiles found HI shells, supershells and “worms” in the Milky Way Galaxy (Heiles 1979, 1984). These structures are seen protruding from the plane of the Galaxy in the z-direction. Diameters of the shells and supershells range from a few tens of pc to a few kpc. In some cases, the shells’ diameters change with velocity, indicative of expansion. Similar features are also found in some external galaxies (e.g., NGC 5775, Irwin 1994; NGC 4631, Rand and van der Hulst, 1993) either as shells, partial shells or extensions. M31 is also observed to have hundreds of HI “holes”, regions devoid of neutral hydrogen, which are possibly cavities within shells or supershells ([Brinks and Bajaja 1986]). Several other example also exist, but the list is still short.
Two possible explanations have been proposed: 1) the effect of stellar winds and supernova explosions and 2) collisions of clouds with a galactic disk (see [Tenorio-Tagle and Bodenheimer 1988] and references therein). Considerable effort has been expended in the first category beginning with the “galactic fountain” model of Shapiro and Field (1976). Norman and Ikeuchi (1989) then extended this to develop the “Chimney Model” in which they propose that high-latitude features are formed due to clustered supernova explosions. The hot gas in the disk flows to the halo via “chimneys” with walls of HI gas, cools at high-latitude and subsequently falls back onto the disk. This way, a circulation of mass, energy and momentum is set up between the disk and the halo. It has been argued ([Rand and van der Hulst 1993] and others) that kpc scale features observed in our own and other galaxies are too large and require too many input supernovae (e.g., 10,000 in some cases) to be explained in this way. Thus there exists an energy problem for large HI supershells if they are created by supernovae and stellar winds. The cloud collision model, in part a response to this problem, on the other hand, requires the presence of a companion. Thus the discovery of HI shells in isolated systems would strongly favour an internal origin. We have therefore targeted one such galaxy, NGC 3044, which we felt to be a good candidate for HI extensions (see below) and has no nearby companions.
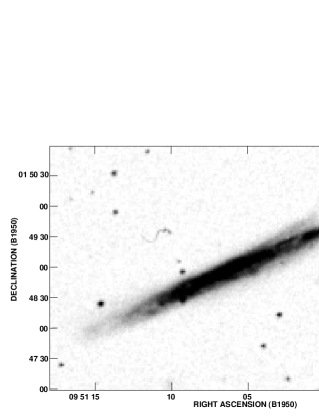
NGC 3044 (Fig. 1, from the ST ScI Digital Sky Survey 111The Digitized Sky Surveys were produced at the Space Telescope Science Institute under U.S. Government grant NAG W-2166. The images of these surveys are based on photographic data obtained using the Oschin Schmidt Telescope on Palomar Mountain and the UK Schmidt Telescope. The plates were processed into the present compressed digital form with the permission of these institutions.) is an edge-on, SBc galaxy in the Leo Cloud ([Tully 1988]). Solomon and Sage (1988) classify it as a Type I galaxy (i.e, second lowest level of interaction), which has companions within 10D25 ( Mpc in projection, where h is given by /100), on the Palomar Sky Survey (PSS) print, with a velocity difference of less than 1000 km s-1 and showing no morphological disturbance. A dust lane (, ) appears prominently on the northwestern (NW) side of the galaxy, obscuring part of the disk. Above the dust lane, a faint feature protrudes at an angle away from the major axis appears to be the source of the classification by Sánchez-Saavedra (1990) of the galaxy as having a “barely perceptible” optical warp pointing in a counter-clockwise direction (inverse integral sign). On the southeastern (SE) side, the galaxy’s optical disk fades out more gradually than the NW end, suggesting a possible asymmetric distribution of matter.
NGC 3044 was originally observed as part of a survey to search for galaxies with extended radio continuum halos. The results ([Sorathia 1994]) show the galaxy to have extended radio continuum emission to distances as far as 8 kpc from the plane. Since this galaxy is also infrared bright ([Soifer 1987]), it therefore appeared to be a good candidate for finding high-latitude neutral hydrogen arcs and filaments. Throughout this paper, we use a distance to NGC 3044 of 16.14 Mpc (see §3.3). At this distance, kpc.
In the following, we present the first high resolution HI observations of NGC 3044. Thus, aside from searching for high latitude HI, we also model the HI distribution in the disk, deriving global parameters. Observations and data reduction are given in §2, the HI distribution, velocity field and the global HI profile of the galaxy in §3. §4 provides the details of modelling the galaxy as well as a discussion of the modelling results. The observed asymmetry and the energetics of the HI supershells are given in §5. Finally, a summary can be found in §6.
2 Observations and Data Reduction
NGC 3044 was observed with the Very Large Array (VLA)222Operated by Associated Universities, Inc. under contract with the National Science Foundation. on June 19-20, 1993 in the C configuration. The primary flux calibrators were 3C48 and 3C286, having flux densities of 16.09 Jy and 14.88 Jy respectively. The secondary calibrator, 0922+005 (flux density 0.75 Jy), was observed about every half hour. The data were Hanning-smoothed on-line. Bandpass calibration was done using the primary flux calibrators. 33 line-free channels were averaged together and subtracted from all 63 channels to obtain spectral line data alone. The NRAO AIPS (Astronomical Image Processing Software) routine “MX” was used for mapping and deconvolution of the data cube (using the “Cleaning” algorithm). Two cubes were obtained, one using natural weighting and the other using uniform weighting. Correction for primary beam attenuation was applied to both cubes. Parameters pertaining to the observations and mapping of NGC 3044 are listed in Table 1.
| Parameter | Value |
|---|---|
| VLA configuration | C |
| Observing date | 1993 June |
| On-source observing time | 8.75 hr |
| Approximate largest scale visibleaaFrom Perley, 1994 | 420 |
| Primary beam FWHM | 315 |
| Band centerbbHeliocentric, optical definition. | 1318 km s-1 |
| Total bandwidth | 1331 km s-1 |
| Channel width (=resolution) | 20.8 km s-1 |
| Synthesized beam parameters: | |
| Uniform weighting | 136135 @ PA=-7819 |
| Natural weighting | 207202 @ PA=-2954 |
| Root mean square map noise: | |
| Uniform weighting | 0.61 |
| Natural weighting | 0.45 |
| Rayleigh-Jean conversion factor (): | |
| Uniform weighting | 3.30 |
| Natural weighting | 1.45 |
3 Results
3.1 The HI Distribution
3.1.1 The HI Channel Maps

The distribution of neutral Hydrogen in velocity space can most easily be discerned from channel maps. The naturally weighted channel maps in Figure 2(a) show clearly that the SE side of the galaxy is receding and the NW side is approaching. Since the dust lane occurs most prominently along the south edge of the galaxy, this must be the closest edge to us. Therefore, any trailing spiral structure observed should have an inverted “s” shape.
There is distinct evidence of HI arcs and extensions and high latitude features away from the plane of the galaxy. For example, on the SE side, a disconnected feature at , reaches a height of kpc in the 1422 km s-1 channel and an impressive high-latitude extension is found on the NW side at , from 1110 km s-1 to 1235 km s-1. It reaches a projected height of 7.1 kpc from the midplane. These features and others will be discussed in more detail in §5.2.
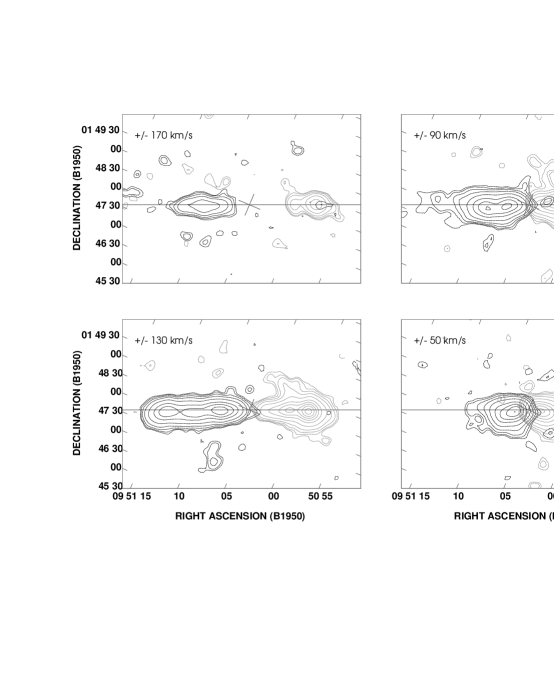
The channel maps also reveal the asymmetric distribution of gas in the galaxy, which we highlight in Figure 2(b), by superimposing selected channel maps of equally red- and blue-shifted velocities with respect to systemic. The HI distribution of the receding side (dotted contours) is much more elongated than that of the approaching side (solid contours) and the approaching side is more “active” displaying the largest high-latitude extensions above the HI disk. The disk appears to be fairly straight at high velocities, although the outer contours (1.5 - 3) on the NW side dip below the major axis, probably due to an extension. The asymmetry will be discussed in §5.1.
3.1.2 The Column Density Maps
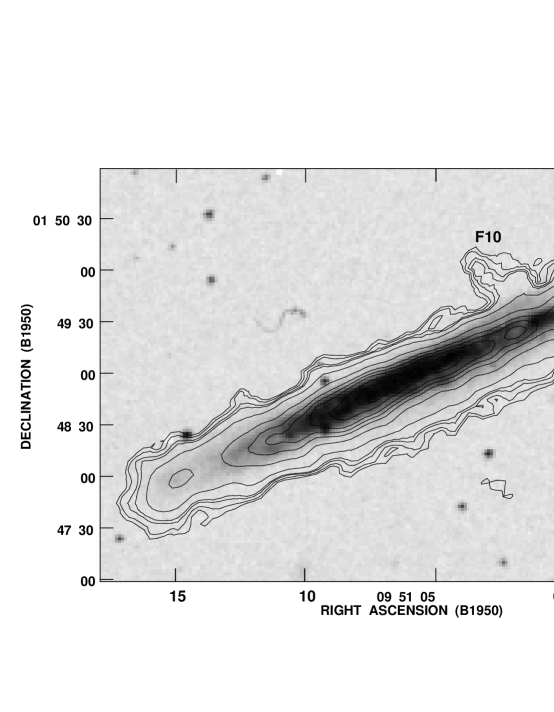
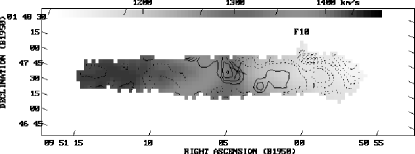
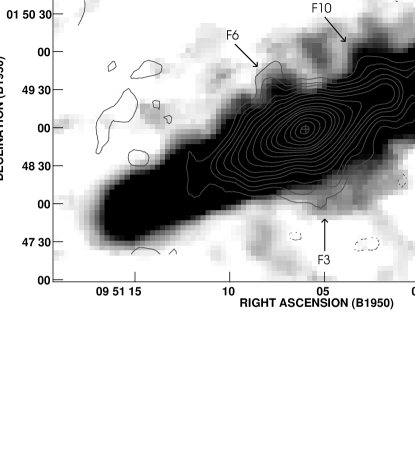
In Figure 3(a), the velocity-integrated column density (moment zero) map of NGC 3044 for the uniformly weighted data is superimposed on the optical grey-scale image from the Digitized Sky Survey. The naturally weighted column density map (contours and grey-scale) are shown in Figure 3(b). In Figure 3(a), one extension is particularly obvious – labelled F10 (feature 10, see §5.2). The disk’s column density peaks at , . Besides this peak, there are three other peaks along the major axis. The two outermost ones are roughly symmetrically located with respect to the central peak, both at a distance of about 10 kpc (126) on either side. The NW peak is 2.5 times stronger in intensity than its counterpart on the SE side, being and , respectively. The peak of the HI distribution does not coincide with the peak of the optical image but is offset by about 43 along the major axis to the SE. The optical distribution extends to the outer SE HI peak, but with very low intensity. Interestingly, there is another HI column density enhancement () between the central peak and the outer NW peak, directly below feature 10. This smaller peak seems to coincide with a region of low surface brightness on the optical image, which could be due to absorption by a dust lane.
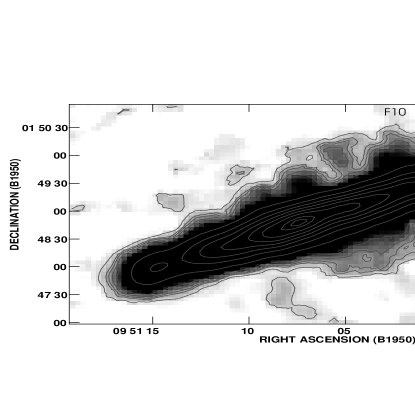
Measured from the outermost contour of the naturally weighted map [Fig. 3(b)], the HI disk spans a length of 57 or 2.3R25 along the major axis. Feature 10 is clearly visible and more extended than in Figure 3(a) along with various other extensions. F10 extends out to about 6 kpc above the plane of the galaxy in Figure 3(b). In fact, Figure 3(b) shows an extensive disturbance in the region near feature 10. We show below (see ) that feature 10 is indeed an expanding feature. Other protruding features are also visible in Figure 3(b). For example, the hole at , and numerous protrusions along the northern edge of the galaxy can be seen.
3.2 The Velocity Field

The naturally weighted velocity field of NGC 3044 is shown in Figure 4. The kinematic major axis is parallel to the optical major axis to within one degree out to a radius of about 50 (4 kpc). The kinematic minor axis is not perpendicular to the inner kinematic major axis, this is typically an indication of a bar structure (Bosma, 1981), which is consistent with the optical classification of this galaxy. Beyond about 17 (8 kpc) on the NW side, the velocity field becomes disturbed. For example, there is a closed 1160 km s-1 contour at the position of F10. On both sides, beyond 4 kpc, the kinematic major axis bends slightly towards the south. Therefore the major axis does not resemble the more commonly seen kinematic warp in other edge-on galaxies and we interpret the disturbance near feature 10 as high-latitude features instead of a simple warp.
In Figure 4, we plot the systemic velocity of the galaxy, obtained from the global profile, on the major axis of the galaxy (represented by at , ). This position is significantly different from the position of both the column density peak (labelled in Fig. 4) as well as the optical centre (labelled +), so that the kinematic centre is between the column density peak and optical centre. However, the kinematic centre does coincide with the peak of the radio continuum map (represented by ). The kinematic centre given by our model (labelled ) is also shown. This will be discussed more fully in §4.1. Here, we identify the radio continuum centre as the ‘true’ centre of the galaxy.
Notice all velocity contours have bends and kinks in them, especially near the outer edges of the contours. Such features are usually explained by shock fronts occurring at the inside edge of spiral arms as a density-wave perturbs the local velocity field ([Visser 1980]). However, due to the high inclination of NGC 3044, this is difficult to verify from the column density map. At the location of feature 10, the velocity field is inconsistent with normal galactic rotation; instead it is more blueshifted. If feature 10 is actually located at a larger distance (so that its distance from the nucleus in Figure 4 is just a foreshortened distance in projection), then we would expect its radial velocity to be redshifted. It is clear that feature 10 does not follow the general flow of material in the disk below it.
3.3 The HI Global Profile

Figure 5 shows the global profile of NGC 3044 from the naturally weighted cube. The profile agrees within error with previously published data ([Staveley-Smith and Davies 1988], 12 beam).
The global properties of NGC 3044 are tabulated in Table 5. Row 1 gives the systemic velocity from the midpoint of the 20% intensity level. Row 2 gives distance deduced from the systemic velocity corrected to the reference frame of the 3K background radiation (see the Third Reference Catalogue of Bright Galaxies [[de Vaucouleurs 1991]], hereafter RC3). Row 3 gives the velocity width at the 20% level uncorrected for inclination due to the high inclination for this galaxy (, [Bottinelli 1984]).
clc \tablecolumns3 \tablewidth4in \tablecaptionGlobal HI Properties of NGC 3044 \tablehead\colheadRow & \colheadParameter \colheadValue \startdata
(1) & (km s-1) 1287 10 \nl(2) ( Mpc) 16.14 \nl(3) (km s-1) 351 10 \nl(4) (Jykms) 48.2 3.6 \nl(5) 3.0 0.2 \nl(6) \tablenotemarka 0.22 0.02 \nl(7) \tablenotemarkb 1.1 0.1 \nl(8) 8.1 0.4 \nl(9) 0.027 0.002 \nl\enddata\tablenotetexta is calculated using the total “face-on” apparent blue magnitude () given in the RC3 and using a value of +5.48 for the absolute blue magnitude of the Sun. \tablenotetextbRadius is taken to be the maximum extent of the third contour in the naturally weighted position-velocity diagram (Fig. 6) and is the average of the maximum blue- and red-shifted velocities with respect to the systemic velocity measured using the same contour. The third (4.5) contour is used so as to avoid the protruding feature on the approaching side of the p-v diagram (see Fig. 6) which probably does not reflect the maximum blueshifted rotational velocity.
The integrated flux density of NGC 3044 is given in row 4. Our value agrees with both Staveley-Smith and Davies (1988) and Krumm and Salpeter (1980). Row 5 shows the estimated HI mass of the galaxy using the equation where is in , is in Mpc and is in Jykm s-1. This equation is valid under the assumption of optical thinness. Haynes and Giovanelli (1984) investigated the effect of HI self-absorption on HI integrated flux as a function of morphological type and galaxy inclination. They concluded that for Sc-type galaxies with inclinations like NGC 3044, the correction factor is about 1.3. Thus could be up to 30% higher than the value in Table 5. The peak brightness temperature for NGC 3044 is 83.1 K in the 13 beam. Thus optical depth effects should not be strong. The HI mass of the receding side is 14% larger than the approaching side while the uncertainty due to the error bars in the global profile is only 8%. This asymmetry is obvious in Fig. 5 and will be discussed in §5.1.
Row 6 in Table 5 gives the HI mass to blue luminosity ratio. Row 7 gives the estimated total mass of the galaxy within the outermost detectable HI radius. The usual equation assuming a spherical geometry is used []. The quoted uncertainty reflects only the asymmetry of the receding and the approaching sides of the galaxy, which dominates the errors. Using a spherical geometry may result in an overestimate of the true total mass within if the total mass is dominated by the disk component. The overestimate will be no more than 40% (Lequeux 1983). Row 8 gives the ratio of total mass to blue luminosity and row 9 gives the fractional HI mass.
The values of Table 5 were compared with those of Roberts and Haynes (1994) for the Local Supercluster (galaxies with km s-1), correcting to their value of . With an additional slight correction for the method of calculating , we find that all values for NGC 3044 are typical for its Hubble type.
4 Data Cube Modelling and Results
For edge-on galaxies, the usual first and second moment analysis ([van Gorkom and Ekers 1994]) cannot be used successfully to obtain density and velocity distributions because the flux density at each pixel results from an integration along the line of sight which spans many galactocentric radii.
We instead use the technique of Irwin and Seaquist (1991) and Irwin (1994) which models the intensity at every pixel given the radial and perpendicular density distributions and the form of the rotation curve. These curves are parameterized, and the parameters are fit via a non-linear least squares algorithm. The parameters are a subset of RA and DEC of the nucleus, the position angle (PA) and inclination (i) of the galaxy, the systemic velocity (), the galactocentric radius () at which maximum rotational velocity () occurs, a rotation curve shape index (m), the peak volume density of the distribution (), the density scale length for the radial distribution () and the scale height () of the vertical distribution. The model intensities are then smoothed to the spatial resolution of the data and the residuals (data minus model) are found. The best result is considered to be the model producing the lowest residuals.

The trial density distributions are exponential or Gaussian for both the radial and z-axis distributions centered at the galaxy centre and midplane, respectively. In addition, a Gaussian or exponential ring distribution in the plane of the galaxy centered at a radius of was also tried. The choices for the form of the velocity curve are the Brandt curve and a user specified numerical rotation curve which we take from the velocity-position diagram along the major axis (Fig 6) (allowing the amplitude to vary). The model also allows for a velocity dispersion. Thus the geometrical parameters (particularly the inclination which cannot normally be found without an assumption of the scale height), the velocity distribution and the density distribution (radial and vertical) can be found. For NGC 3044, we model the uniformly weighted data cube as it has a higher spatial resolution than the naturally weighted cube, yet the integrated flux density (426 Jykm/s) still agrees with that of the naturally weighted cube (see Table 5). There are 2248 independent data points of real positive emission, hence the free parameters should be well constrained.
The best fit results are shown in Table 6 for the entire galaxy (column 2) and the receding (column 3) and advancing sides (column 4). Column 1 is a list of free parameters. Brandt rotation curves are used for all the models in this table, since they resulted in better fits in all trials than a user-specified numerical curve. We shall hereafter use notations such as ‘RG(GS)-EX’ to represent a model having a Gaussian ring distribution in the plane and an exponential distribution in the z-direction. The uncertainties quoted are either standard deviations of the results of all trial models (including those not shown in Table 6) or formal 1 errors from the fit of the best model, whichever is larger. The following subsections discuss the model results.
lrrr \tablewidth0pt \tablecaptionModel Parameters \tablehead \colheadParameter & \colheadWhole Galaxy \colheadReceding Side \colheadApproaching Side \nl\colhead \colheadRG(GS)-GS \colheadGS-GS \colheadRG(GS)-EX \nl\colhead \colheadring @ 30 \colhead \colheadring @ 104 \nl\colhead(1) \colhead(2) \colhead(3) \colhead(4) \startdata\nl(1950) & \nodata \nodata\nl(1950) \nodata \nodata\nlPA() 112.950.10 113.450.04 111.40.3 \nl 84.90.4 85.30.3 86.10.2\nl(km s-1) 12984 \nodata \nodata\nl(km s-1) 1503 1492 1513 \nl 6.40.4 4.90.2 94 \nl 2.3 \nodata 8.2 \nlm 0.990.18 0.640.15 0.480.26 \nl 0.380.15 0.400.18 0.330.16 \nl 5.30.7 6.40.8 1.90.2 \nl 0.420.04 0.490.04 0.450.03 \nl 1.200.02 \nodata 270029 \nl (km s-1) 24.32.2 19.92.2 17.72.2 \nl\nl
aInner Scale Length for .
4.1 Galaxy’s Geometry
The position of the nucleus of the galaxy is well constrained amongst the different models giving a standard deviation of 007 in RA and 04 in DEC. This is not surprising since the kinematic centre of a galaxy does not depend on the form of the density distributions either parallel or perpendicular to the plane. As mentioned before, the column density peak is shifted towards the SE (receding side) (§3.2). As part of the modelling process, we forced the model’s nucleus to coincide with the column density peak and the radio continuum peak separately. These resulted in worse models for all combinations of density distributions implying real offsets of these peaks from the model’s centre. The kinematic centre as given by the best model is 23 east and 88 south of the radio continuum peak (9h51m60, 14900, see Fig. 4). As the receding side is more massive, it is natural that the model’s centre is being weighted towards this side, hence the offset of the model’s centre from the radio continuum centre. The peak of the column density map is 233 east and 31 south of the modelled galaxy centre. These differences in the peak positions are significant. The P-V diagram of the major axis of the galaxy (Fig. 6) also shows an asymmetry in the sense that the receding side of the galaxy extends further. In addition, the flat part of the rotation curve shows up more prominently on this side. It therefore appears that either the galaxy’s HI emission has been ‘truncated’ on the approaching side or the receding side emission has been ‘stretched out’. We feel that the former is probably true as the receding side of the P-V diagram more closely resembles the P-V diagrams of other giant spirals.
The position angle and inclination of the galaxy are also well determined. Various models resulted in standard deviations of 010 and 04 for these two parameters, respectively. The position angle agrees with that given in the RC3 (note that there is a mistake in the RC3, the position angle listed should be 113 instead of 13). The inclination from the model () agrees with Bottinelli (1984) and Staveley-Smith and Davies (1988) who obtain i=842 and 9013 respectively. The former assumes an intrinsic oblateness of 0.15 while the latter uses 0.20. Our value is independent of the intrinsic axial ratio, and should be an improvement over the previous estimates.
4.2 The Rotation Curve
The systemic velocity given by the best model agrees with that measured from the global profile of the data (Table 5) to within errors. Fixing the systemic velocity at a lower value resulted in worse models for all trials. The rotation curve parameters, Vmax and Rmax, are also well-defined, with the spread in Vmax within 10% of the velocity resolution while the spread in Rmax is determined to 40% of the HPBW. The shape of the rotation curve is determined by the Brandt index, m, and the spread in this parameter is only 18% amongst all trials. When a velocity dispersion is included in the models, results for every model improved significantly. For the best model, the optimum FWHM of the Gaussian smoothing function is found to be 57.2 km s-1 (2.75 channels) corresponding to a velocity dispersion of 24.3 km s-1. This value reflects all non-circular motions along each line of sight, including any velocity variations due to spiral arms and is a global average. This velocity dispersion is comparable to that found in NGC 5775 (Irwin, 1994) and is about 3 times the velocity dispersion found for the Milky Way galaxy, which only measures the rms cloud velocity (Spitzer, 1978).
4.3 The Density Distributions
The model parameters related to the density distributions vary significantly amongst different models. This is expected as the parameters are defined differently between some of the models. While there is no obvious central hole in the column density map (Figs. 3), the best results of the modelling are found using a ring distribution rather than a distribution which peaks at the centre. From our best model (Gaussian ring in-plane and Gaussian in z-direction), the volume density at the radius of the ring (2.3 kpc) is found to be 0.38 . This is very similar to the average midplane density of our Galaxy between 4 to 8 kpc which is 0.35 ([Burton and Gordon 1978]). The outer radial scale length is 5.3 kpc, or 20% of the length of the HI disk as measured by the outermost contour of the column density map [Fig. 3(b)]. As a comparison, the Galactic HI density stays roughly flat from about 4 to 10 kpc and falls off beyond that. The inner scale length is the least constrained, its value depends sensitively on the position of the ring. The uncertainty associated with this parameter in Table 6 is therefore taken to be the 1- uncertainty of the fit instead of the standard deviation amongst the different models. Our best model gives the inner scale length of 1.20 kpc, about half the radius of the ring.
lccccc \tablewidth0pt \tablecaptionHigh-Latitude Arcs and Extensions \tablehead \colheadFeature & \colheadRight Ascension \colheadDeclination \colheadVelocities \colheadNumber of \colheadHeight from midplane \nl\colhead \colhead \colhead \colheadkm s-1 \colheadChannels \colhead kpc \startdata\nl1 & 9 51 9.8 1 49 5.0 1401.2 to 1442.8 3 2.9 \nl2 9 51 6.9 1 49 21.0 1359.6 to 1422.0 4 3.5 \nl3 9 51 5.0 1 48 17.0 1234.8 to 1359.6 7 6.0 \nl4 9 51 10.6 1 48 13.0 1338.8 to 1297.2 3 - \nl5 9 51 7.7 1 47 21.0 1380.4 to 1463.6 5 8.4 \nl6 9 51 9.5 1 49 5.0 1255.6 to 1318.0 4 5.0 \nl7 9 51 4.7 1 48 17.0 1276.4 to 1318.0 3 - \nl8 9 51 6.9 1 49 29.0 1193.3 to 1276.4 5 3.7 \nl9 9 51 5.3 1 50 1.0 1193.3 to 1214.1 2 6.6 \nl10 9 51 2.6 1 50 0.0 1110.2 to 1234.8 7 7.1\nl11 9 50 58.9 1 50 2.0 1151.7 to 1214.1 4 4.9 \nl12 9 50 57.8 1 49 0.0 1131.0 to 1193.3 4 5.2 \nl\nl
The vertical scale height given by the best model is kpc. This value is obtained as a global parameter, an average over the entire disk of the galaxy. Note that in specific places, e.g., feature 10, the HI extends to 5.7 kpc in projection. In the Galaxy, it is known that the HI distribution between 4 to 8 kpc consists of two components, a central layer with a FWHM of 0.1 kpc, and a low-intensity, high-temperature component with a FWHM of 0.5 kpc (Lockman, 1984). It is perhaps more helpful to compare the vertical scale height of NGC 3044 with an external galaxy. NGC 891 is also an edge-on, IR-bright spiral which exhibits high-latitude HI features. van der Kruit (1981) modelled the thickness of its HI layer and found that the FWHM of the z-distribution increases with galactocentric radii. The FWHM varies from 0.32 kpc at a radius of 4.2 kpc to 1.89 kpc at a radius of 20.8 kpc with an average value of 0.9 kpc. Therefore, NGC 3044 appears to have a moderately thick HI disk compare to the Galaxy yet not as extensive as that in NGC 891. To check the validity of a thick disk, we modelled the galaxy again by fixing the vertical scale height to a low value (0.1 kpc). This resulted in a significantly worse model fit to the data. In addition, Sorathia (1994) finds a large radio continuum scale height of 1.80.5 kpc for the 20 cm C-array data (see Fig. 9). Thus NGC 3044 has both a moderately thick HI disk as well as a thick radio continuum disk.
4.4 Modelling of Receding and Approaching Halves of the Galaxy
As we have noted before, the HI distribution of NGC 3044 is not symmetrical in the sense that the HI is more extended on the SE (receding side) and less so on the NW (approaching side). Modelling the receding and approaching side of the galaxy separately enforces this picture. Table 6 lists the best fit parameters for the two halves of the galaxy in comparison with the parameters given by the galaxy as a whole. Column 3 and 4 were obtained by fixing the nucleus position and the systemic velocity given by the best model for the whole galaxy (Table 6, column 2).
The model fits the receding side of the galaxy better which shows that this side of the galaxy is better described by a smooth spatial and velocity distribution of gas. This result simply reiterates what we see in the major axis rotation curve from the data (Fig. 6). Although and of both sides agree within error, the uncertainty in is much larger for the approaching side. The Brandt curve indexes show the same trend. The difficulty in pinning down these parameters is due to the fact that on the approaching side, the rotation curve never reaches a terminal velocity. For the density distribution parameters, the two halves of the galaxy differ significantly. The receding side is best fitted by a GS-GS distribution while the approaching side prefers a RG(GS)-EX distribution. In the latter case, the location of the ring is at the outer density peak and the inner scale length is extremely high, hence the HI distribution inside this peak is essentially flat. A consequence of the large ring radius is the small outer scale length, as expected. These results for both sides, separately, are consistent with the residual emission observed in Fig. 7 (see next section). Finally, the approaching side has a smaller velocity dispersion than the receding side, which can also be seen from the narrower (in velocity) emission on the approaching side in Fig. 6.
4.5 Comparing Model With Data

Figure 7 shows the column density map of the residual cube for the global model result. Negative (dotted) contours represent regions where the amount of gas was over-estimated by the model and positive (solid) contours represent regions of enhanced emission in the galaxy above a smooth distribution. The peak column density in the residual map is 30% of the peak column density in the data [Fig. 3(a)], this shows that the model is able to reproduce 70% of the underlying smooth distribution of the galaxy. There remain, however, pixel-to-pixel variations between model and data due to the unevenness of the distribution, as can be seen in Fig. 7. For example, feature 10 appears as positive contours, as do the two outer column density peaks [see also Fig. 3(a)]. The galaxy’s nucleus derived from the best model does not coincide with the central peak of the zeroth-moment map. As a result, the model under-estimated the column density at the data peak.
In terms of velocity, the model reproduced the velocity field of the galaxy well for the most part. This is confirmed by subtracting the first moment map of the model from that of the data (Fig. 8). The rms of this residual velocity field is 16 km s-1, smaller than the velocity resolution of the data. There are regions in the galaxy where the model’s velocity cannot reproduce the data, a good example is the region just under feature 10. In this region, the typical velocity excess is about -50 km s-1 (i.e., model over-estimated the velocity) which represents the highest departure of the model from the data. This is consistent with the observation made in §3.2, which shows that the velocity field near feature 10 is more blueshifted for its location than expected from normal galactic rotation.
5 The Remarkable Features of NGC 3044
In the following, we discuss two of the most remarkable features of NGC 3044, namely, the HI asymmetric distribution and the high-latitude structures. These features are readily understood for an interacting galaxy but remain puzzling in a seemingly isolated galaxy like NGC 3044.
5.1 Asymmetry
The asymmetric appearance of the optical disk has been described in §1 while the HI asymmetry is shown in the HI global profile (Figure 5) and the rotation curve (Figure 6) and was discussed in §3.1. In Figure 9, we compare the HI distribution with the 20-cm radio continuum map of similar beam size obtained from the completely independent data of Sorathia (1994). There are remarkable correlations between the 2 maps, both show extensions of the intensity contours towards the NW as well as enhancements in intensity at the most north-westernly peak of the HI column density map [, cf. Fig. 3(b)]. All the above points to a global asymmetry which manifested itself in various components of this galaxy.
As indicated in § 1, there is no morphological evidence for a disturbance in this galaxy (Solomon and Sage 1988). What, then, could have caused the asymmetric distribution in NGC 3044? We note here that HI asymmetries in field spirals are quite common. For example, at least 50% of 1400 field galaxies were classified as asymmetrical by Richter and Sancisi (1994). However, the origin of the asymmetry still eludes us. Zaritsky (1995) suggests that past mergers may be the cause of the optical asymmetries in a sample of about 30 galaxies. Could the asymmetry in NGC 3044 be similarly due to a past merger, perhaps with a smaller companion?
Mergers between gas-rich disks and satellite galaxies (i.e., minor mergers) have been studied extensively via simulations (e.g., Quinn , 1993, Mihos and Hernquist, 1994 and Hernquist and Mihos, 1995). In general, the effect on the parent galaxy for assimilating a satellite one tenth its own mass are: 1. massive gas in-flow to the nucleus causing a brief ( years) starburst phase; 2. heating of the stellar disk (i.e., increase in vertical scale height by a factor of a few); 3. flaring and warping of the stellar disk. In addition, depending on the satellite’s initial density, its core may or may not survive the tidal stripping to arrive at the nucleus of the parent. Therefore, an obvious signature that a merger has occurred is the existence of a double nucleus. In addition, Zaritsky (1995) finds a possible correlation between HI asymmetries and star formation rates using the set of HI-asymmetric galaxies from Rix and Zaritsky (1995). The higher than normal star formation rates are consistent with the starburst phase expected after a minor merger.
We do not yet have the data which could search for all of these effects. Star formation rates can be investigated, though. NGC 3044 is indeed classified as infrared-bright, but this is based on the IRAS 60 flux density (Soifer 1987). The infrared luminosity calculated from the 60 and the 100 flux densities given by Soifer (1989) is 4.8 and the massive star formation rate, following Condon (1992), is given by . These values show that NGC 3044 is only mildly starbursting at present (even if is adopted, which gives ). That is, the massive star formation rate in NGC 3044 is comparable to that of the Milky Way (cf. 0.3 to 0.5 for a supernova rate of 1 every 5 - 80 years) and lower than that of M 82 (2.2 ) by a factor of 5. Thus if a minor merger has occurred in NGC 3044, it likely occurred of order 108 years ago or more. A study of the CO content is underway to investigate the star formation efficiency, determine whether the CO is also asymmetric and to search for evidence of an increase in molecular gas density towards the nucleus (Lee and Irwin, in preparation). Further observations (e.g. optical or IR searches for a double nucleus or a close examination of the optical disk for flaring) would also be useful.
5.2 High-Latitude Arcs and Extensions
5.2.1 Evidence of Expanding Shells
The naturally weighted channel maps in Figure 2(a) display numerous low intensity, high-latitude arcs and extensions away from the galactic disk. These arcs and extensions in NGC 3044 resemble the so-called “Heiles Shells” in our Galaxy. Table 4.3 lists the positions, velocity ranges and the highest z-extent at the 1.5 level of the more prominent extensions/holes seen in Figure 2(a). Only features which show up in more than one consecutive channel are included. Some of these have very complex appearances and are probably the results of blended features along the same line-of-sight (e.g., feature 3). These features appear to be distributed randomly along the disk of the galaxy.
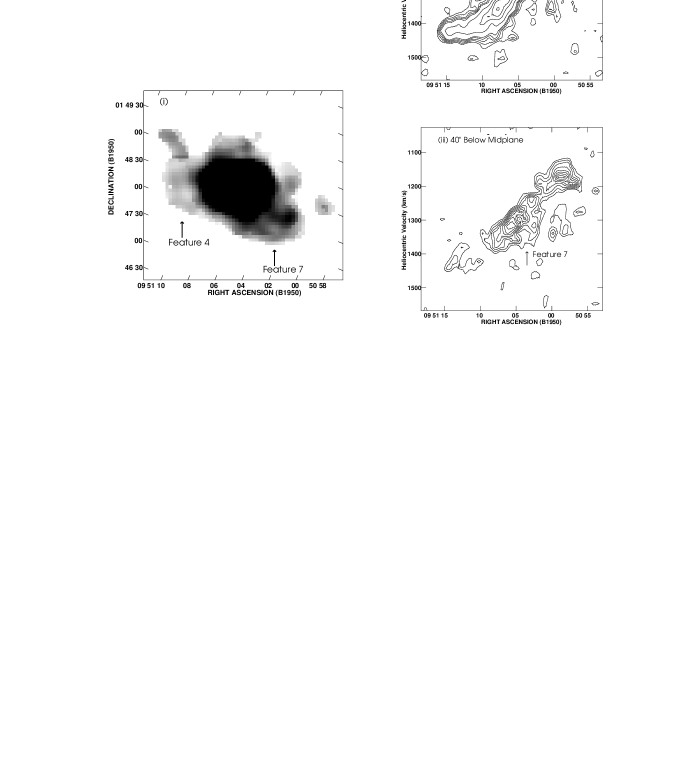
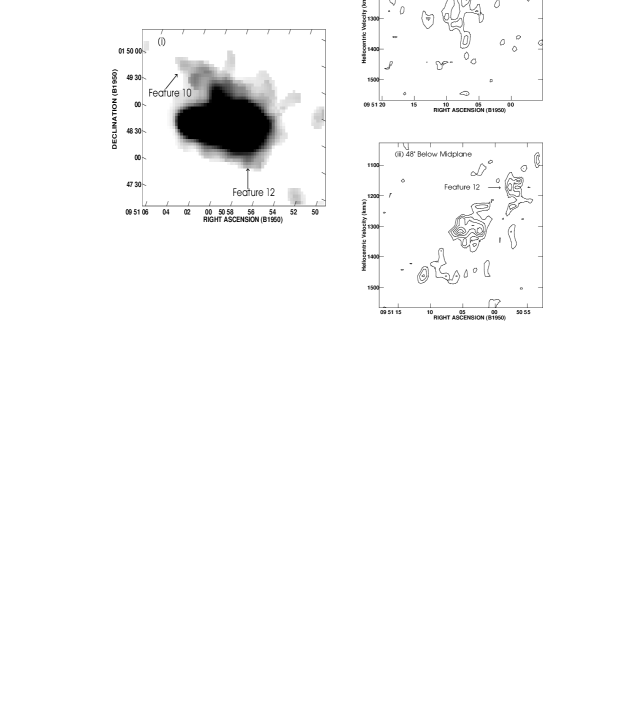
Features 4 and 7 are clearly “holes” and are most obvious at 1339 km s-1 and 1297 km s-1, respectively [see Fig. 2(a)]. Feature 6 straddles either side of the systemic velocity (1287 km s-1), hence we may be seeing both the receding and the approaching caps of an expanding shell on the northeast side of the galaxy (see below). Feature 10 is the most massive (see Table 5.2.2) extension in the list and spans 7 velocity channels. At 1172 and 1152 km s-1, feature 10 bends towards the east at high latitude so that the feature looks like an arc. Feature 5 reaches kpc above the midplane (most obvious at 1422 km s-1 where it could be disconnected from the disk), making it the most extended feature of all.
If any of these features are actually expanding shells or partial shells, they should appear as rings or partial rings in the position-velocity (P-V) slices across the centres of the features. Figure 10(a) and (b) show the zeroth-moment maps of features 4, 7, 10 and 12 and their associated P-V diagrams (natural weighting data). Each slice is an average of 2 pixels (8) parallel to the major axis. In each P-V slice shown in Figs. 10, we find expansion signatures at the position and velocity corresponding to these features. In all cases, the shells are not complete but are “open” at the sides toward lower density, both in P-V and in RA-DEC space. This is consistent with the Chimney models for a blow out case (see below). It could also indicate that the shell has more readily fragmented in low density regions.
All the features in Table 4.3 reach a projected height of at least 5 times the HI scale-height derived from our model (see Table 6. It is clear that, whatever the mechanism which created them, it must be energetic enough that the features are able to break through the moderately thick HI disk to reach the halo (this is termed blowout in [Heiles 1990]). For a blowout case, mass and momentum are injected into the halo. The total mass of all features measured is (a lower limit, see next section) or 7% of the total HI mass of the galaxy. If we assume that 10% of this mass eventually reaches the halo, and the typical lifetime for these features is about years (see in Table 5.2.2 and the next section), then a lower limit to the mass injection rate for cold neutral gas, , is . This is in rough agreement with numerical calculations utilizing the ISM parameters of the Galaxy ([Heiles 1990]).
5.2.2 Supershell Parameters
Table 5.2.2 lists the masses (Msh, column 2), expansion velocities (Vsh, column 3), radii (Rsh, column 4), projected galactocentric locations (Dsh, column 5), ambient densities in the mid-plane at Dsh (n0, column 6) , and kinetic energies (E, column 7) of the expanding shells. The masses are obtained by summing the fluxes associated with each features in the velocity channels listed in Table 4.3. These masses are lower limits since part of the shells are most certainly embedded within the HI disk and are not included. For holes 4 and 7, the masses are not listed as the thickness of the shell cannot be determined with confidence. Vsh is taken to be half the total velocity range which again may underestimate the actual range. Radii of the shells are measured from the 1.5 contours of the P-V diagrams. Dsh is an average of the measurements made from the channel maps and the P-V diagrams. We use the modelled density profile in the plane of the galaxy (see column 2 of Table 6) to estimate the ambient density at the galactocentric distance of a given shell.
lccccccc \tablewidth0pt \tablecaptionEnergy Requirements of Expanding Supershells \tablehead \colheadFeature & \colheadMsh \colheadVsh \colheadRsh \colheadDsh \colheadn0 \colheadEk \colheadEE \nl\colhead \colhead \colheadkm s-1 \colhead \colhead \colhead \colhead ergs \colhead ergs \nl\colhead(1) \colhead(2) \colhead(3) \colhead(4) \colhead(5) \colhead(6) \colhead(7) \colhead(8) \startdata\nl4 & \nodata 31.2 1.2 6.7 0.18 \nodata 4.11054 \nl7 \nodata 31.2 1.7 0.0 0.01 \nodata 4.11053 \nl10 5.5107 72.8 2.0 6.3 0.21 2.91054 7.41055 \nl12 1.6107 41.6 1.5 10.1 0.04 2.71053 1.91054 \nl\nl
The kinematical age of a shell, assuming constant expansion velocity, is . For the four shells listed in Table 5.2.2, we expect to be underestimated (see above) and therefore may be overestimated. The resulting kinematical ages range from 24 million years for shell 10, to 52 million years for shell 7. These ages are comparable to the expected lifetime of an OB association.
For an expanding shell which is formed from a one-time energy injection, such as from supernovae and is now in the radiating phase of its evolution, numerical analysis by Chevalier (1974) shows that the energy injected is given by
where the variables have the same meaning as before ( is in pc and in km s-1). Values of EE for the expanding shells in NGC 3044 are listed in column 8 of Table 5.2.2. As Table 5.2.2 shows, since the energies are all upwards of 1053 ergs, it is evident that all four shells are “supershells”, as defined by Heiles (1979, i.e. with energies 3 1052 ergs).
Since the input energy requirements for supershells are significant, it is worth considering the errors on . As indicated previously, the measured is a lower limit since complete shells are not observed. Increasing by a factor of 2, for example, would increase by a factor of 2.6. We have also minimized through our choice of Hubble constant (see dependence on in Table 5.2.2). Thus a change to increases by a factor of 1.8. If the features are actually located at larger galactocentric distances than the projected radius, , then the ambient densities, , would be lower than the listed values. In the extreme case of a shell actually occurring at the outer radius of the HI disk (R = ), then , decreasing by a factor of 30 for feature 10, which has the highest in Table 5.2.2. However, note that for Feature 10, = 3 1054 ergs. This value gives only the kinetic energy of expansion of the feature and thus the input energy must be much higher (i.e. by at least a factor of 10 for an efficiency of 10%). Therefore, for this feature is likely to be within a factor of 2 of the value listed in Table 5.2.2. This then implies that Feature 10 is at a position much closer to its projected galactocentric distance than near the edge of the disk. Given the irregular density distribution in the galaxy (§ 4.5, Fig. 7), there are also possible variations in for individual shells. For example, Feature 7, with a projected center at the center of the galaxy, is the most extreme example since it could have an energy more than an order of magnitude larger than the table 5.2.2 value if is determined by the fits to the two sides of the galaxy separately, rather than to the galaxy as a whole (Table 6). Overall, however, the irregularities in density tend to be within 30% of the modelled density, introducing similar sized errors into . Most of the assumptions we have made effectively minimize the values of in Table 5.2.2. We conclude that the energy estimates, under the assumption of instantaneous input, are order of magnitude values.
If supernova explosions are the source of the energy, then between to supernovae are required to produce the shells in Table 5.2.2. Heiles (1979) found energies an order of magnitude lower for Galactic shells while shells in NGC 3079 ([Irwin and Seaquist 1990]) and NGC 4631 ([Rand and van der Hulst 1993]) require comparable energies ( - erg) when scaled to . Note that NGC 3044 probably has many lower energy shells like those in the Galaxy and the fact that we detect only the supershells is merely a selection effect. Such a high energy requirement for the supershells is difficult to reconcile with input energies typical of Galactic OB associations which contain only a few tens of stars of spectral types B0 and earlier. H luminosities of bright HII regions in some external late-type galaxies do suggest the existence of superclusters which contain thousands of supernovae (Heiles 1990) and therefore H observations of NGC 3044 may be helpful in this regard.
There is certainly some dependence of the required input energy on adopted model. For example, if a slower, continuous energy injection is assumed over a typical cluster ( shell) age (several 107 years), then we find energies which agree to within a factor of 4 with the tabulated for Features 4 and 10, but are at least an order of magnitude lower for the low density Features 7 and 12 (cf. Vader and Chaboyer 1995). Also, since the supershells have achieved blowout, an understanding of these features would also benefit from numerical hydrodynamical modelling for such conditions (cf. Mac Low, McCray, & Norman 1989). Nevertheless, one cannot escape the fact that some of the observed high latitude features in NGC 3044 are supershells which require large input energies to produce. The kinetic energies of expansion, , which are model-independent and essentially assume 100% input efficiency, are of order 1053 - 1054 ergs and these kinetic energies are underestimated for reasons outlined above. For a more realistic situation in which the efficiency is 10% or less, the input energies must be at least an order of magnitude larger.
5.2.3 Origin of the Supershells
We have so far implicitly assumed that the shells are formed internally through the collective effects of clustered supernovae. Since the energy requirement are very high, however, the leading alternative scenario, i.e. that the supershells are produced from impacting external clouds, should also be considered.
Impacting cloud models are an attractive way to explain large, energetic supershells because the resulting energies are a function of the infalling mass for which there are no hard limits in the case of galaxy-galaxy interactions. If we assume that the supershells in NGC 3044 are due to impacting clouds, however, we must consider where such clouds would originate. NGC 3044 has no nearby companion, nor is there strong evidence (apart from the asymmetry) for a previous interaction. Moreover, a previous interaction, if it occurred, more likely occurred over timescales of order 108 yr (a typical interaction timescale, see also §5.1). However, we find kinematical ages for the shells of a few 107 yrs. Therefore, if the shells are produced by infalling clouds, the situation is more likely one in which high velocity clouds (HVCs) exist around the galaxy and are continuously “raining down”. This also suggests that there should be evidence for such clouds around the galaxy now.
One of the two supershells found in NGC 4631 ([Rand and van der Hulst 1993]) was modelled by Rand and Stone (1996) as a HVC impact structure using a 3-D hydrodynamical simulation. They found the most likely HVC that formed the supershell has a radius of 500 pc and an HI mass of . Since NGC 3044 and NGC 4631 have remarkably similar kinematics, global HI distribution and shell parameters (see [Rand 1994]), we can assume that infalling clouds of similar size and mass are required to form the supershells in NGC 3044. Converting these parameters to a column density, we find (within one beam) a value of , which corresponds to the fifth contour in Figure 3(b). There is clearly no evidence at the present time for such massive clouds in the vicinity of NGC 3044. Thus, the impacting cloud model may be reasonable for interacting galaxies like NGC 4631, but is much less attractive for an isolated system like NGC 3044.
From Figure 9, there appears to be a correlation between high latitude radio continuum and high latitude HI features in the case of features 3, 6, and 10. Indeed there appears to be an HI feature wherever a radio continuum feature exists. However, the converse is not true, as there are a number of HI features which do not (at the sensitivity limit of the observations) have corresponding radio continuum features. The observations are not inconsistent, at least qualitatively, with the Chimney model ([Norman and Ikeuchi 1989]). In this model, the HI features are walls of ambient material swept up by spatially correlated supernova explosions. Relativistic electrons then funnel through these “Chimneys” to reach the halo. It is difficult to tell, at this resolution and with the blended features, whether the radio continuum emission is interior to a specific chimney, or whether the emission is coincident with the walls of a chimney.
As the above analysis shows, the formation of supershells in NGC 3044 is far from clear. Both supernovae models and the cloud-galaxy collision model have difficulties. However, given the timescales for shell formation, the absence of companion galaxies near NGC 3044, and the lack of evidence for surrounding massive clouds, and the apparent correlation between high latitude HI and radio continuum features, we favour an internal origin for the supershells. Several recent studies have shown, for example, that when magnetic fields are included (not just as a secondary effect) that large shells and blow-out can occur with more modest energy requirements (e.g. Kamaya 1996; Frei 1997). Therefore, more sophisticated models including effects like this may reconcile the energy requirements of supershells with fewer numbers of supernovae.
6 Summary
What has been presented in the preceding sections represents the first comprehensive HI study of the isolated, edge-on, infrared-bright galaxy NGC 3044. The IR brightness is partly due to proximity, since the massive star formation rate is a factor of 5 lower than that of M 82 (§5.1).
The HI distribution in the galaxy was modelled using all available data points, i.e. HI spectral lines were modelled over the entire galaxy in order to determine the best global density and velocity distributions in the galaxy as well as the best geometrical parameters. The resulting quantities are listed in Table 6. A Gaussian ring density distribution in the plane was found to be the best fit overall. An important result derived from the model is that the galaxy has a moderately thick HI disk with a Gaussian vertical scale height of . This is consistent with previous observations which have also revealed a thick radio continuum disk.
NGC 3044 shows a very asymmetric distribution optically, in HI, and in the radio continuum, with excellent agreement between the radio continuum and HI column density distributions (see §5.1). In HI, the asymmetry is particularly apparent from the global profile, which shows a lopsided double-horned structure. Otherwise, however, derived global parameters tell the story of a normal SBc galaxy. The column density map confirms the asymmetric distribution of the HI in the galaxy. This is clear from the 27 offset of the HI peak to the east of the radio continuum peak. The major-axis rotation curve also shows the asymmetry in that the approaching side of the galaxy appears to be “truncated” before reaching terminal velocity while the receding side stays flat for about after reaching terminal velocity. While the galaxy is asymmetric in HI, it also shows an extremely straight disk (i.e., no obvious disk warp).
It is not clear what could have caused the asymmetry in this apparently isolated galaxy. It is likely, though, that the mechanism would have to act on the galaxy after its formation, since it is difficult to explain how the galaxy would form asymmetrically in the first place. It is noted here that asymmetries in isolated galaxies are not uncommon, which indicates that a common mechanism such as past minor mergers may be responsible for it. If this is the case for NGC 3044, the merger likely took place over 108 yrs ago.
The velocity channel maps reveal a host of high-latitude HI extensions. We have catalogued a total of 12 such features that appear in at least two consecutive velocity channels. These features are distributed uniformly across the disk of the galaxy and above and below the plane. We derive a lower limit for mass flow to the halo of , = . There is also some correlation between high-latitude HI features and high-latitude radio continuum features ( 5.2.3).
Four of the high latitude features exhibit the signature of an expanding shell and have radii of order a few kpc. Based on the assumption that the shells were formed by supernovae energy input, the required input energies are in the range 4 1053 to 7 1054 ergs. These values vary somewhat depending on the adopted model, but it is clear, even from the kinetic energies of expansion of the individual supershells, that large numbers (e.g. up to tens of thousands) of correlated supernovae are required to form them. This means that NGC 3044 would have to harbour a number of such superclusters (such as the cluster R136 in the 30 Doradus region in the LMC), something which is not supported by the current massive star formation rate.
The alternative model, that of impacting external clouds, is even less attractive as a formation mechanism for the supershells because of the absence of companions, the fact that the supershells are young (of order the age of a typical OB association) and because HI clouds which are massive enough to produce these shells would have been easily detected in our data. We suggest that the supershells are indeed formed internally, but that some additional energy-boost (e.g. through magnetic fields) is needed to explain their large energies.
Acknowledgements.
The authors wish to thank the staff at the VLA for obtaining the HI data and Kathy Perrett for coordinating the remote observation. Thanks also go to Denise Giguere and Jayanne English for many useful discussions on various data reduction techniques. We have also made used of the NASA/IPAC Extragalactic Database (NED). This work is supported by the National Research Council of Canada.References
- [Bosma 1981] Bosma, A. 1981, AJ, 86, 1825
- [Bottinelli 1984] Bottinelli, L., Gouguenheim, L., Paturel, G., and de Vaucouleurs, G. 1984, A&AS, 56, 381
- [Brinks and Bajaja 1986] Brinks, E., and Bajaja, E. 1986, A&A, 169, 14
- [Burton and Gordon 1978] Burton, W. B., and Gordon, M. A. 1978, A&A, 63, 7
- [Chevalier 1974] Chevalier, R. A. 1974, ApJ, 188, 501
- [Condon 1992] Condon, J. J. 1992,ARA&A, 30, 575
- [Frei 1997] Frei, B. D., Henriksen, R. N., Irwin, J. A., and King, D. L. 1997, ApJ, submitted
- [van Gorkom and Ekers 1994] van Gorkom, J. H., and Ekers, R. D. 1994, in Synthesis Imaging in Radio Astronomy, ed. Perley, R. A., Schwab, F. R., and Bridle, A. H., (Astronomical Society of the Pacific Conference Series, Vol. 6), 341
- [Haynes and Giovanelli 1984] Haynes, M. P., and Giovanelli, R. 1984, AJ, 89, 758
- [Heiles 1979] Heiles, C., 1979, ApJ, 229, 533
- [Heiles 1984] Heiles, C., 1984, ApJS, 55, 585
- [Heiles 1990] Heiles, C., 1990, ApJ, 354, 483
- [Hernquist and Mihos 1995] Hernquist, L., and Mihos, J. C. 1995, ApJ, 448, 41
- [Irwin and Seaquist 1990] Irwin, J. A., and Seaquist, E. R. 1990, ApJ, 353, 469
- [Irwin and Seaquist 1991] Irwin, J. A., and Seaquist, E. R. 1991, ApJ, 371, 111
- [Irwin 1994] Irwin, J. A. 1994, ApJ, 429, 618
- [Kamaya et al. 1996] Kamaya, H., Mineshige, S., Shibata, K., Matsumoto, R. 1996, ApJ, 458, L25
- [van der Kruit 1981] van der Kruit, P. C. 1981, A&A, 99, 298
- [Krumm and Salpeter 1980] Krumm, N., and Salpeter, E. E. 1980, AJ, 85, 1312
- [Lequeux 1983] Lequeux, J. 1983, A&A, 125, 394
- [Lockman 1984] Lockman , F. J. 1984, ApJ, 283, 90
- [Mihos and Hernquist 1994] Mihos, J. C., and Hernquist, L. 1994, ApJ, 425, L13
- [Mac Low, McCray, and Norman 1989] Mac Low, M.-M., McCray, R., & Norman. M. L. 1989, ApJ, 337, 141
- [Norman and Ikeuchi 1989] Norman, C. A., and Ikeuchi, S. 1989, ApJ, 345, 372
- [Perley 1994] Perley, R. A. 1994, in Very Large Array Observational Status Summary, published by the National Radio Astronomy Observatory
- [Quinn 1993] Quinn, P. J., Hernquist, L. and Fullagar, D. P. 1993, ApJ, 403, 74
- [Rand and van der Hulst 1993] Rand, R. J., and van der Hulst, J. M. 1993, AJ, 105, 2098
- [Rand 1994] Rand, R. J. 1994, A&A, 285, 833
- [Rand and Stone 1996] Rand, R. J., and Stone, J. M. 1996, AJ, 111, 190
- [Richter and Sancisi 1994] Richter, O. -G., and Sancisi, R. 1994, A&A, 290, L9
- [Rix and Zaritsky 1995] Rix, H.-W., and Zaritsky, D. 1995, ApJ, 447, 82
- [Roberts and Haynes 1994] Roberts, M. S., and Haynes, M. P. 1994, ARA&A, 32, 115
- [Sánchez-Saavedra 1990] Sánchez-Saavedra, M. L., Battaner, E., and Florido, E. 1990, MNRAS, 246, 458
- [Shapiro and Field 1976] Shapiro, P. R., and Field, G. B. 1976, ApJ, 205, 762
- [Soifer 1987] Soifer, B. T., Sanders, D. B., Madore, B. F., Neugebauer, G., and Danielson, G. E. 1987, ApJ, 320, 238
- [Soifer 1989] Soifer, B. T., Boehmer, L., Neugebauer, and Sanders, D. B 1989, AJ, 98, 766
- [Solomon and Sage 1988] Solomon, P. M., and Sage, L. J. 1988, ApJ, 334, 613
- [Sorathia 1994] Sorathia, B. 1994, M.Sc. Thesis: A Radio Continuum Survey of Edge-on Spiral Galaxies, Queen’s University
- [Spitzer 1978] Spitzer, L., Jr. 1978, in Physical Processes in the Interstellar Medium, (New York: John Wiley and Sons)
- [Staveley-Smith and Davies 1988] Staveley-Smith, L., and Davies, R. D. 1988, MNRAS, 231, 833
- [Tenorio-Tagle and Bodenheimer 1988] Tenorio-Tagle, G., and Bodenheimer, P. 1988, ARA&A, 26, 145
- [Tully 1988] Tully, R. B. 1988, Nearby Galaxies Catalog, (Cambridge University Press)
- [Vader and Chaboyer 1995] Vader, J. P., and Chaboyer, B. 1995, ApJ, 445, 691
- [de Vaucouleurs 1991] de Vaucouleurs, G., de Vaucouleurs, A., Corwin, H. G., Jr., Buta, R. J., Paturel, G., and Fouqu, P. 1991, Third Reference Catalogue of Bright Galaxies, (New York: Springer-Verlag)(RC3)
- [Visser 1980] Visser, H. C. D. 1980, A&A, 88, 159
- [Zaritsky 1995] Zaritsky D. 1995, ApJ, 448, L17