11.01.2; 11.07.1; 11.19.1; 13.25.2
Th. Boller
2 Institute d’Astrophysique (IAP), 98 bis Boulevard Arago, F-75014 Paris, France
ROSAT All-Sky Survey observations of IRAS galaxies;
I. Soft X-ray and far-infrared properties
Abstract
The 120,000 X-ray sources detected in the RASS II processing of the ROSAT All-Sky Survey are correlated with the 14,315 IRAS galaxies selected from the IRAS Point Source Catalogue: 372 IRAS galaxies show X-ray emission within a distance of 100 arcsec from the infrared position. By inspecting the structure of the X-ray emission in overlays on optical images we quantify the likelihood that the X-rays originate from the IRAS galaxy. For 197 objects the soft X-ray emission is very likely associated with the IRAS galaxy. Their soft X-ray properties are determined and compared with their far-infrared emission. X-ray contour plots overlaid on Palomar Digitized Sky Survey images are given for each of the 372 potential identifications. All images and tables displayed here are also available in electronic form.
keywords:
galaxies: general — galaxies: active — galaxies: Seyfert — X-rays: galaxies1 Introduction
In a previous paper (Boller et al. 1992a) we presented results of a first correlation between the ROSAT All-Sky Survey and the 14,708 extragalactic sources selected from the IRAS Point Source Catalogue (hereafter IRAS PSC). This initial correlation used the first processing of the All-Sky Survey data by the Standard Analysis Software System (RASS I) (Voges et al. 1996a; Downes et al. 1994) and resulted in a sample of 244 objects. From the distribution of source separations (see Fig. 4 of Boller et al. 1992a) the number fraction of spurious sources herein was estimated to about 16.
Recently, a second processing of the ROSAT All-Sky Survey (RASS II) was performed that yielded about 120,000 sources with detection likelihoods larger 8 (cf. Cruddace et al. (1988) for the definition of the detection likelihood). The major differences of the second processing as compared with the first are: (i) the photons were not collected in strips but merged in 1378 sky-fields of 6.46.4 degree, which takes full advantage of the increasing exposure towards the ecliptic poles; (ii) neighboring fields overlap by at least 0.23 degree in order to ensure the detection of sources at the field boundaries, which posed a problem in the first processing; (iii) a new aspect solution reduces the number of sources with erroneous positions and morphology.
In this paper we present the results of a correlation of the 14,315 IRAS galaxies with the RASS II source list. 111 In order to maintain a well defined infrared source sample we did not include in our correlation the incomplete sample of high flux [ Jy] IRAS galaxies. These objects are excluded by the multivariate selection technique (cf. Adorf & Meurs 1988; Boller et al. 1992b; Sect. 2 of Boller et al. 1992a); however their RASS I spatially correlated sources are included in our first correlation. For consistency we have still taken the IRAS PSC sources, but use whenever available the IRAS FSC position and fluxes instead of the IRAS PSC positions and fluxes. Section 2 describes how the X-ray emitting IRAS galaxies were identified through a spatial correlation, and a subsequent superposition of X-ray emission contours on optical images. We adopted a classification scheme to characterize the likelihood that the infrared and X-ray emission originate from the same object. Thereby we obtained a list of IRAS galaxies with a very high probability of detected X-ray emission. Their soft X-ray spectral properties were analyzed and compared with their infrared emission in Sect. 3.
The aim of this paper is to present the basic data and to quantify the likelihood that the X-rays we measure are associated with the IRAS galaxy. In subsequent papers we shall present results of optical follow-up observations of our galaxy sample and of theoretical models addressing the X-ray and far-infrared emission of galaxies in different states of nuclear activity.
The images for the 372 potential identifications and the tables 3 to 5 of the paper are available as postscript files from http://www.rosat.mpe-garching.mpg.de/ ~bol/iras_rassII or can be retrieved via anonymous ftp from ftp.rosat.mpe-garching.mpg.de in the subdirectories /outgoing/bol/iras_rassII/images and /outgoing/bol/iras_rassII/tables, respectively.
2 Identifying X-ray emitting IRAS galaxies
Our RASS II source catalogue only includes sources with a detection likelihood larger than eight. In addition, the number of source photons in the (0.12.4 keV) energy band must be larger than six. The latter restriction is obtained from an analysis of the distribution of detection likelihood values versus the ratio of source to background count rates. Sources with five or less source photons show unusually high source to background count ratios for their values of the detection likelihood, compared to sources with a higher detection likelihood. This may be due to uncertainties in the standard analysis software analysis of weak sources. To avoid the uncertainties introduced by the SASS detection algorithm we therefore require the number of source photons to be above some threshold. The RASS II source catalogue thereby constrained has 116,471 sources.
Through a correlation of the positions of 14,315 IRAS galaxies with 116,471 RASS II source positions we obtained a list of 372 possible identifications. Because of its superior positional accuracy, when available we used the IRAS FSC position instead of the IRAS PSC position. Table 2 lists the corresponding FSC and PSC names for such objects.
In Sect. 2.1 we estimate the number of chance coincidences among our correlated IRAS and RASS II sources, as well as the dependence of that number on the positional uncertainty of the RASS II source positions.
In a second step (Sect. 2.2) the candidate identifications were individually examined through superimposing the X-ray emission contours on optical images taken from the Palomar Digitized Sky Survey. In these images we also show the IRAS 3 error ellipse. All objects were classified according to how clearly the X-rays appear to originate from the optical counterpart of the respective IRAS source.
2.1 Identification through positional coincidence and chance coincidence rate


This section describes our first identification step, a search for RASS II sources within 5 arcmin around each of the 14,315 IRAS galaxies. We estimate the chance coincidence rate and its dependence on the positional identification uncertainty.
2.1.1 Chance coincidence rate from two random sets
From two random sets of = 14,315 and = 116,471 sources we expect
chance pairs with an angular separation less than , where is measured in arcsec. Within a separation of 100 arcsec we therefore expect 98 chance coincidences, which account for one quarter of the source pairs we found.
To empirically verify this number of chance coincidences we re-correlated the IRAS galaxy positions five times with RASS II positions that were offset by 30 arcmin in right ascension and/or declination. The number of chance coincidences of separation less than 100 arcsec turned out to be 101 (), 105 (), 113 (.), 105 (), 102 (, ). The slightly higher number of pairs in the test correlations may be due to an excess of correlation below about 150 arcsec separations that we attribute to a wider spatial correlation between diffuse cluster X-ray emission and the infrared emission from galaxies within the clusters (see the discussion in the following Section).
The number distribution of pairs drawn from two randomly distributed sets of and objects, respectively, should follow
A least square fit to the average distribution up to 300 arcsec of our five test correlations (cf. Fig. 1b) yields , which corresponds to , in fair agreement with the expected value of .
2.1.2 Chance coincidence rate from the RASS II - infrared catalogue
We searched for RASS II counterparts within a radius of 5 arcmin around the position of each of the 14,315 IRAS galaxies and found 372 possible identifications. Fig. 1a shows the distribution of distances between the infrared position and its nearest X-ray source. In contrast to the distribution of random associations displayed in Fig. 1b, the actual correlation of the two catalogues shows a strong excess of source pairs within about 50 arcsec. Of the 372 pairs within 100 arcsec the expected number of chance coincidences is 105, with an uncertainty estimated from the different X-ray catalogue offsets of about 8. Thus statistically, we should have found about 267 IRAS sources with X-ray emission in their actual vicinity.
The width of the distribution of “real” source pair separations arises from positional uncertainties in each catalogue, resulting in a Gaussian distribution with some angular width . We therefore model the observed distribution as the sum of “real” pairs, and a background characterized by the total number, , of pairs in two sets of randomly distributed objects:
A least square fit to the observed distribution yields arcsec and (we have fixed the value of to that obtained from the distribution of Fig. 1b). Our visual inspection (cf. Sect. 2.3 and our overlays) of all 372 pairs resulted in 197 secure identification of X-ray emitting IRAS galaxies, a number in good agreement with the 204 objects attributed to the central Gaussian of the pair distribution function.
The number of 204 sources we attribute to the central Gaussian is smaller than the total number of pairs to 100 arcsec minus the expected random pairs, 372 - 105 = 267. This is probably due to another excess above the expected random distribution and outside the central Gaussian peak, reaching out to about 150 arcsec (cf. Fig. 1a). This wider excess could most naturally be explained as coming from IRAS galaxies embedded in clusters with diffuse X-ray emission from the intercluster gas. In such cases the IRAS galaxy is not the source of the X-ray emission, which come from the cluster gas and may peak somewhere within the cluster size away from the IRAS galaxy. The size of nearby clusters from which we would expect RASS–detectable intercluster gas emission is in fact of order 2 arcmin. In our detailed comparison of the ROSAT emission with the optical images we indeed found such clusters that we flagged accordingly (grade 3, cf. Section 2.3). The X-ray emission on the line of sight to IRAS F055376653 is a representative example.

For our 372 candidate pairs we searched the NASA/IPAC extragalactic database (NED) for optical identifications within a distance of 2 arcmin around the IRAS PSC positions. Table 3 lists the X-ray and infrared positions, and the positions of the found NED counterparts (we list at most nine of them) with their basic optical properties. Since NED comprises many catalogues, it may identify a given galaxy with several different names and coordinates. When an IRAS galaxy was clearly identified with an optical galaxy, the more accurate optical galaxy position is listed in Table 3 instead of the IRAS position.
We are aware that the spectral classification in NED is collected from the literature without quantifying the likelihood of the classification. For a better and consitent classification we therefore initiated an optical follow-up program the results of which will be presented in a separate paper.
2.1.3 X-ray position accuracy
In order to estimate the positional (aspect) errors of the X-ray sources we selected all IRAS galaxies with optical counterparts, and correlated the optical and RASS II positions. For accurate optical positions for the IRAS galaxies we searched the Hubble Space Telescope (HST) Guide Star Catalogue (GSC) (Lasker et al. 1990; Russell et al. 1990; Jenkner et al. 1990). Within a search radius of 5 arcmin 16,274 counterparts were found. Figure 2 shows the distribution of the optical and RASS II position offsets. Under the reasonable assumption that the accuracy of the HST GSC positions is much higher than that of the RASS II positions, we estimate the aspect error of the X-ray positions from the Gaussian width of the central distribution peak as arcsec. For a Gaussian distribution this results in 68% (90%) of ROSAT sources found within 10 arcsec (18 arcsec) of the HST GSC position. These numbers are in good agreement with the results (12 and 20 arcsec) found by Voges & Boller (1997) by correlating the ROSAT Bright Source Catalogue (Voges et al. 1996b) with the TYCHO catalogue for bright stars having an error of less than 1 arcsec (cf. their Fig. 3).
2.1.4 Comparison with RASS I catalogue
The 14,315 IRAS galaxies were previously correlated with the RASS I source catalogue and the results were presented in Boller et al. (1992a). The advantages of the RASS II processing with respect to the RASS I processing are discussed in the introduction of this paper. 52 objects from the original RASS I source catalogue are no longer included in the present catalogue. There are three reasons why objects were excluded; (i) the infrared flux at 100 is greater than 10 Jansky (see the footnote in our introduction), 26 objects fulfill this criteria; (ii) the positional offset from the new RASS II processing between the RASS II position and the infrared position is larger than 100 arcsec and/or the RASS II detection likelihood is less than eight (25 objects), and (iii), the number of RASS II source photons is less than six (one object).
Due to the merging of the original RASS I strips into 1378 sky-fields of 6.4 6.4 degree, 78 new objects at fainter X-ray fluxes are detected in the RASS II processing with respect to the RASS I processing and these objects appear now also in our new RASS II catalogue of IRAS galaxies.
The improved RASS II processing and our individual examination of the X-ray emission structure with respect to the optically visible galaxy and its environment together provide a higher degree of reliability of this catalogue compared to the previous RASS I IRAS correlation. A third release of this catalogue might be called for if major improvements can be made in the SASS processing.
2.2 X-ray contours on optical images
The Photon Event (PET) Files from the RASS II processing were used to produce X-ray images and contour plots. To obtain an optimal spatial resolution of the X-ray images, the PET files were binned in 5 arcsec width bins. The resulting images were then smoothed with a arcsec Gaussian filter, corresponding to a full-width at half maximum of 45 arcsec, which is the expected width of the point spread function in the ROSAT All-Sky Survey. X-ray contours were computed in units of source photons per FWHM detection cell. The background photon density is known at each source position from the RASS II processing. To detect at least one source photon within a circular area of 45 arcsec diameter requires a mean photon density of . The source plus background photon density is known from the PET files and the exposure map. The lowest contour line was chosen to represent two source photons per FWHM detection cell. The higher contour levels represent 3,5,9,17 (doubling the contour value difference) and then (for ) photons per FWHM detection cell. This choice of contours appears to best trace the source structure over their dynamic range.
The X-ray photon flux contours were overlaid on optical images, and a cross marks the centroid X-ray position obtained by the RASS II processing. Rectangles were drawn to mark the positions of NED sources, and for the IRAS FSC or PSC sources the 3 error ellipse. The likelihood grade of the association of the X-ray emission with the IRAS galaxy (see next section) is printed in the lower right corner of each image.
2.3 Classification of X-ray detection likelihood
For a visual inspection we consider all 372 pairs with a separation of 100 arcsec as potentially “real” correlations subject to further analysis.
This does however not necessarily imply that the IRAS galaxy itself is responsible for the X-ray emission. Since galaxies tend to be clustered (cf. our discussion in Sect. 2.1.1), the IR and X-ray emission may arise from neighboring galaxies, or from extended intercluster gas. An visual inspection of all 372 sources is therefore necessary to assess the emission structure in relation to the optically visible galaxy and its environment. In the visual examination we finally allow for a maximum separation of only 30 arcsec between the X-ray and the IR position, which reduces the number of expected chance coincidences to pairs.
We adopted a classification scheme with the following six grades to characterize the quality and likelihood of an identification of the RASS II emission with an IRAS galaxy.
1: The X-ray emission is spatially clearly coincident with an optical counterpart to the IRAS galaxy. There is no significant surrounding X-ray emission peak within the 5 arcmin detection cell used in the RASS II processing. Objects with a classification grade 1 have the highest likelihood that the X-ray emission is actually originating from the IRAS galaxy.
2: The X-ray emission is spatially coincident with an optical counterpart of the IRAS galaxy. However, there is significant surrounding X-ray emission within the RASS II detection cell. In this case the RASS II count rate was corrected by subtraction of the surrounding emission peaks, using the PET files. The number of source photons after subtraction of the secondary peaks is still required to be equal or greater then six.
2db: The IRAS galaxy may be a blend of two or more galaxies not resolved in the IRAS FSC or IRAS PSC. The X-ray emission is spatially coincident with the infrared position. The spatial resolution of the ROSAT All-Sky Survey does not allow a unique identification of one of the optical counterparts with the X-ray emission.
3: The X-ray emission shows complex and diffuse structure and cannot be uniquely associated with the IRAS galaxy. The complex emission may originate from intercluster gas, background or foreground objects. An identification with the IRAS galaxy is uncertain.
4: There is significant X-ray emission near the IRAS position, but it peaks at a distance larger than about 30 arcsec from the IRAS galaxy, which is about from the X-ray peak. This appears too far, but in some cases may be due to pointing errors in RASS II.
5: There is no spatial association of the X-ray emission with the IRAS galaxy. The RASS II centroid position only fortuitously coincides with the IRAS galaxy position.
9:
Other:
(i) a bright foreground star close to the position of the IRAS galaxy
is the most likely source of the X-ray emission;
(ii) less than 2 source photons are detected at the position of the RASS II
centroid position, i.e. no contour lines are plotted (cf. IRAS 055767655).
Only objects with a classification grade 1, 2 or 2db are considered secure identifications of X-ray emission with an IRAS galaxy.
2.4 RASS II sources with resolved X-ray emission
In Table 1 we list sources considered as secure identifications which have an source extent that exceeds the point spread function. The likelihood of the source extent is required to be at least 10, a value obtained from a verification process of that SASS parameter.
| (1) | (2) | (3) |
|---|---|---|
| IRAS name | extent | likelihood |
| F07387+4955 | 27 | 186 |
| F13518+6933 | 13 | 23 |
| F14157+2522 | 10 | 26 |
| F14400+3539 | 12 | 38 |
| F16136+6550 | 11 | 19 |
| F17020+4544 | 12 | 11 |
| F18011+4246 | 75 | 12 |
| F18216+6419 | 23 | 485 |
| F202405233 | 67 | 16 |
| F22402+2927 | 9 | 26 |
| 235660424 | 19 | 10 |
3 Soft X-ray and far-infrared properties of secure identifications
In Table 4 we list the soft X-ray (0.1–2.4 keV) fluxes and luminosities and the far-infrared () fluxes and luminosities for the secure identifications. To compute the soft X-ray (0.1–2.4 keV) energy flux from the PSPC count rate we assume a simple power-law spectrum
| (1) |
where is the galaxy’s energy flux between photon energies and . We assume a fixed photon spectral index , which is the typical value found for extragalactic objects with ROSAT (cf. Hasinger et al. 1991, Walter & Fink 1993), and an absorbing column density of hydrogen fixed at the Stark et al. (1992) Galactic value along the line of sight. In other words, the normalization of the spectrum from which the energy flux is derived is chosen such that a power law photon spectrum with , absorbed by a column , produces the observed count rate. These fluxes are referred to in the following as .
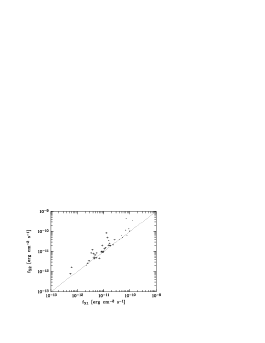
For 42 objects with more than 100 detected source photons we were able to improve the flux estimates by fitting power-law spectra with free spectral index , and free absorption column density, ; latter was however required to be larger or equal to the Galactic value at the respective position, . Under the assumption that the intrinsic spectrum is a power law, we can thereby account for absorption of X-rays inside the respective galaxy. The flux derived this way, , should usually be higher than that derived with fixed and , since it is derived from a larger absorbing column. However, in some cases . This occurs when our best fit , which results in a lower energy flux for a given count rate, and when at the same time is not much larger than the Galactic value. It may also be due to differences between the count rates determined in the standard analysis and the count rates derived from the Photon Event files using the EXSAS package (Zimmermann et al. 1994). The integrated energy fluxes and other spectral parameters for the 42 X-ray brightest galaxies we were able to fit this way are listed in Table 4. In Fig. 3 we compare the fluxes obtained from a free fit, , with those of a fixed spectral shape fit, . As expected, most objects have .
We are aware that in objects where detailed spectral modeling was performed, it often though not always appears that the spectrum can be fit with a hard power-law plus a soft excess component. Even if the spectrum is well represented by a power-law, the spectral index may assume a wide range of values (e.g. Boller et al. 1996) find a correlation between the soft X-ray photon index and the FWHM of the line). In these cases the power-law approximation may result to uncertain fluxes and luminosities.
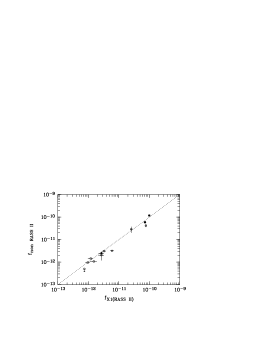
To illustrate the robustness of our flux determination we have searched the literature for detections by other X-ray satellites or other authors on RASS-detected IRAS galaxies from this paper. From the secure identification listed in our Table 4 the following sources have published X-ray fluxes obtained with the Einstein satellite (Fabbiano et al. 1992): IRAS F02321-0900, F03207-3723 (as well as ROSAT RASS I observations (Brinkmann et al. 1994)), F03372-1850, F04150-5554, F11034+7250, F11210-0823, F12125+3328, F13277+5840, F14157+2522; and within ROSAT pointed observations (Brinkmann et al. 1994) F04305+0514 and F12265+0219. Figure 4 shows a good agreement between different flux measurements. We are aware that source variability might also contribute to the scatter in Fig. 4, since the majority of ROSAT sources show variability (cf. Voges & Boller 1997 for a statistical analysis of the variability of ROSAT sources).
The total far-infrared (40-120) fluxes, , were computed following Helou (1985) from the IRAS 60 m and 100 m band fluxes:
where and are given in Jansky. The soft X-ray and far-infrared fluxes were converted to luminosities using equation (7) of Schmidt & Green (1986):
| (3) |
where a power-law spectrum is assumed in the energy range , so that the redshift-dependent functions and are then given by:
| (4) | |||||
| (5) |
For the photon index in the far-infrared we assumed . A Hubble constant and cosmological deceleration parameter of were adopted.
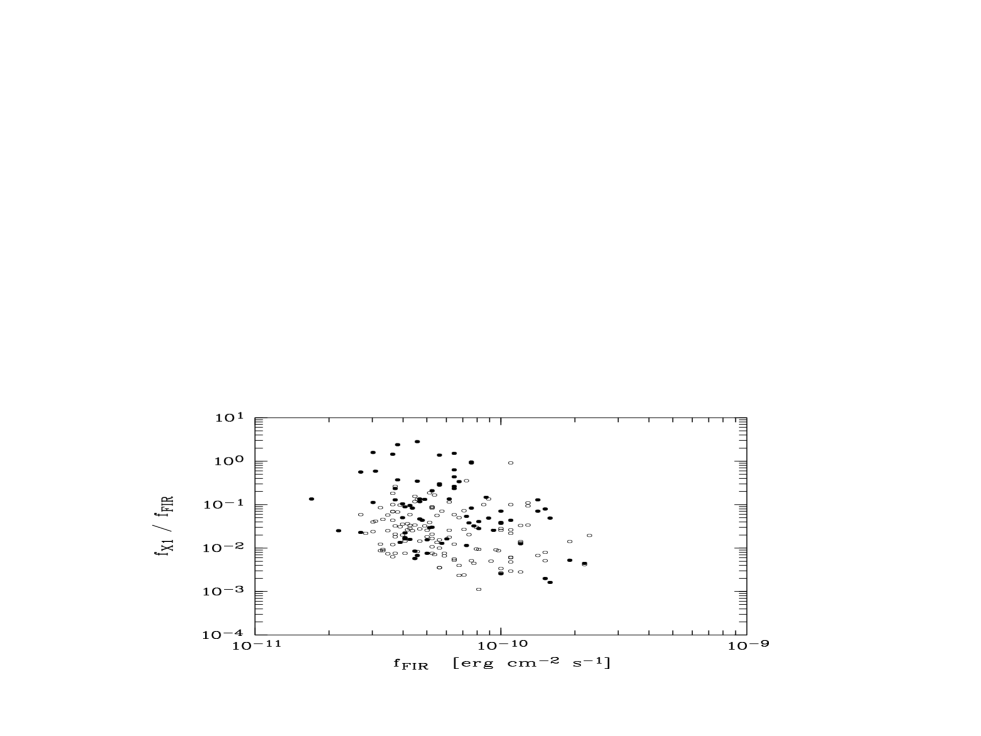
In Fig. 5 we plot the ratio between the far-infrared and soft X-ray flux, against the far-infrared flux for the objects in Table 4. Galaxies identified as Seyfert in NED are marked as filled symbols. The ratio ranges over 4 orders of magnitude and IRAS galaxies identified as Seyfert in the NED tend to be located at the high end of this distribution.
4 Summary
(1) We have correlated the 116,417 X-ray sources detected in the RASS II processing with a sample of 14,315 galaxies selected from the IRAS PSC. Our results build upon a previous correlation of these IRAS galaxies with the RASS I processing.
(2) 372 IRAS galaxies show X-ray emission within a distance of 100 arcsec from the infrared position.
(3) X-ray contour plots overlaid on Palomar Digitized Sky Survey images were inspected to quantify the likelihood that the X-rays originate from the IRAS galaxy. These images are shown for each of the 372 potential identifications.
(4) For 197 objects the soft X-ray emission is very likely associated with the IRAS galaxy. For these objects the soft X-ray fluxes and luminosities are computed and compared with their far-infrared emission. For 42 objects with more than 100 detected source photons we were able to improve the flux estimates by fitting power-law spectra with free spectral index and free absorption column density.
(5) The ratio between the soft X-ray and the far-infrared flux covers about 4 order of magnitudes and can reach values above unity.
The 197 IRAS galaxies with secure X-ray emission are subject of an optical follow-up observation program. The results will be presented in subsequent papers.
Acknowledgements.
We thank J. Trümper, W. Pietsch and U. Zimmermann for helpful discussions. We thank the referee, Dr. M. Lehnert for his suggestions to further improve the paper. The ROSAT project is supported by the Bundesministerium für Bildung, Wissenschaft, Forschung und Technologie (BMBF/DARA) and the Max-Planck-Society. FB acknowledges support by the Deutsche Forschungsgemeinschaft.References
- [1] Adorf H.-M., Meurs E.J.A. 1988, Lecture Notes in Physics 310, 315.
- [2] Boller Th., Meurs E.J.A., Brinkmann W., et al., 1992a, A&A 261, 57
- [3] Boller Th., Meurs E.J.A., Adorf H.-M., 1992b, A&A 259, 101
- [4] Boller Th., Brandt W.N., Fink H.H., 1996, A&A 305, 53
- [5] Brinkmann W., Siebert J., Boller Th., 1994, A&A 281, 355
- [6] Condon J.J., Yin Q.F., Thuan T.X., Boller Th., 1997, AJ submitted
- [7] Cruddace R.G., Hasinger G., Schmitt J.H.M.M., 1988, in Murtagh F., Heck A., eds, Astronomy from Large Databases: Scientific Objectives and Methodological Approaches. Eso Press, Garching, p. 177 (ESO Conference and Workshop Proceedings 28)
-
[8]
Downes R., White R., Reichert G., et al. 1994,
The ROSAT Data Products Guide,
(http://ftp.rosat.mpegarching.mpg.de/rosat_svc/doc/productguide
/ProdGuide.html) - [9] Fabbiano G., Kim. D.-W., Trinchieri G., 1992, ApJS 80, 531
- [10] Hasinger G., Trümper J., Schmidt M., 1991, A&A 246, 2
- [11] Helou G., Soifer B.T., Rowan-Robinson M., 1985, ApJ 298, L7
- [] Jenkner H., Lasker B., Sturch C., et al. 1990, AJ 99, 2081
- [] Lasker B., Sturch C., McLean B., et al. 1990, AJ 99, 2019
- [] Russell J., Lasker B., McLean B., et al. 1990, AJ 99, 2059.
- [12] Schmidt M., Green R.F. 1986, ApJ 305, 68
- [13] Stark A.A., Gammie C.F., Wilson R.W., et al. 1992, ApJS 79, 77
- [14] Voges W., Boller Th., Dennerl K., et al. 1996a, MPE Report 263, 637
- [15] Voges W., Aschenbach B., Boller Th., et al. 1996b, IAUC 6420
- [16] Voges W., Boller Th., 1997, Proceedings of the Vulcano workshop, in press
- [17] Walter R., Fink H.H., 1993, A&A 274, 105
- [18] Zimmermann H.-H., Becker W., Belloni T., et al. 1994, MPE Report 257
Appendix A Notes on individual objects
IRAS F012685436
Two galaxies are located within the IRAS FSC 3 error ellipse.
The major X-ray emission is probably associated with the galaxy
centered south-east of the IRAS centroid position.
IRAS F02562+0610
Several optical sources in or near IRAS 3 ellipse, and
several optical sources near X-ray emission, thus no
unique identification possible.
IRAS F043922713
X-ray centroid and NED position for IRAS F043922713 agree well,
however, the IRAS FSC error ellipse is centered on a nearby galaxy about 1 arcmin
west of the NED position, which is probably the source of the infrared emission.
IRAS F051360012
Relatively large offset of about 50 arcsec between the X-ray centroid
and the infrared position.
A PSPC pointed observation on F051360012 indicates that the X-ray
centroid position and the optical position coincide.
Therefore the offset is probably due to an unusually
large aspect error of the survey data.
IRAS F053405804
The NED IRAS position is taken from the PSC and is inaccurate.
The FSC position is associated with an optical galaxy, but this
galaxy is not the source of the
X-ray emission.
IRAS F060594928
The infrared emission is not clearly associated with any particular
optical galaxy of the apparent cluster.
NED identifies F060594928
with one of the galaxies but the X-ray emission
is clearly not associated with that object.
IRAS F060682705
Condon et al. (1997) find that the IRAS and ROSAT sources are not
identical. Most X-ray emission is probably related to the
northeastern member of the galaxy pair near the X-ray centroid position
which is a Seyfert 1.9 galaxy.
IRAS 062690543
Multiple optical counterparts within IR 3 ellipse.
IRAS 08140+7052
Irregular galaxy Ho II with about 7 arcmin diameter,
multi-component X-ray emission.
Classification grade 1 is given
since all the emission originates inside the galaxy
despite the large
offset between the IRAS FSC and the X-ray centroid
positions.
The infrared luminosity may be larger than given by
FSC/PSC.
IRAS F10214+0644
Condon et al. (1997) identify the galaxy at
optical position
as the IRAS and VLA source. The ROSAT source
is probably associated with the radio-quiet galaxy CGCG 037022.
IRAS 115980112
Two optical counterparts within IRAS PSC
3 error ellipse. The X-ray emission is not spatially resolved.
IRAS F12134+5459
The IRAS source may be a blend of MCG +0920133 and
MCG +0920134.
From the RASS II contour lines we cannot resolve which galaxy
is actually the source of the X-ray emission.
IRAS F13429+6652
A nearby optical counterpart to IRAS galaxy could contribute
to X-ray emission. The X-ray emission from the two components
is not spatially resolved.
IRAS 140725205
The bright optical counterpart near the 3 IRAS PSC
error ellipse may be a star.
The IRAS galaxy is not listed in the FSC.
IRAS F15195+5050
Condon et al. (1997) identify the Seyfert 1
CGCG 274040 NED02
at optical
position
as the probable source of the X-ray emission.
The starburst galaxy CGCG 274040 NED01 is the
primary identification of the VLA source.
The X-ray emission is clearly identified with a neighboring optical
galaxy. Both the VLA and ROSAT galaxies are equally distant to
the IRAS source, thus it remains unclear which is the IRAS source.
IRAS F170230128
Following Condon et al. (1997) and references for object note on
IRAS F170230128,
the Seyfert 1 galaxy UGC 10683 NOTES02 is the most likely
IRAS source. This source is also the main X-ray emitter.
IRAS F18011+4246
The peak X-ray emission appears associated with
CGCG 227016 NED02, however the IRAS galaxy identified by NED
as CGCG 227016 NED01 is within the X-ray positional error also consistent
with the peak X-ray emission. The X-ray emission is spatially
unresolved from both components.
IRAS 18396-3535
The bright optical counterpart within the 3 IRAS PSC
error ellipse could be a star.
The IRAS galaxy is not listed in the FSC.
IRAS 192112855
Multiple optical counterparts within the 3 IRAS PSC error ellipse.
The X-ray emission could arise from a star within the IRAS error ellipse.
The IRAS galaxy is not listed in the FSC.
IRAS F194625843
The optical galaxy ESO 142 G047 associated with the IRAS source seems
not to be related to the X-ray centroid position. There are faint
optical counterparts located at the X-ray peak emission. The ROSAT
survey data do not allow a unique identification of the IRAS source
as X-ray emitter.
IRAS F205474849
The optical galaxy NGC 6987 has a relatively large offset to the X-ray centroid position.
The ROSAT
survey data do not allow a unique identification of the IRAS source
as X-ray emitter.
IRAS 221465955
The X-ray centroid position is outside the 3 IRAS PSC error ellipse.
There seems no unique association of the strong X-ray emitter with one optical
counterpart.
IRAS F23251+2318
The X-ray emission may arise from the faint optical counterpart near the X-ray
peak emission.
Appendix B Identical objects with different FSC and PSC names
Where possible we use the IRAS FSC position and band fluxes instead of the IRAS PSC entries. Due to an improved position determination in the IRAS FSC the IRAS names for identical objects may differ between the PSC and the FSC. Below we list PSC and FSC names for identical objects.
| PSC name | FSC name | PSC name | FSC name | PSC name | FSC name | PSC name | FSC name |
|---|---|---|---|---|---|---|---|
| 00127+2817 | 00128+2817 | 003602432 | 003612432 | 00488+2907 | 00489+2908 | 005400133 | 005410133 |
| 01134+3046 | 01134+3045 | 01464+1249 | 01464+1248 | 02025+0941 | 02025+0940 | 02093+3714 | 02092+3714 |
| 022231922 | 022231921 | 025371641 | 025361641 | 032083723 | 032073723 | 032290618 | 032290619 |
| 033982124 | 033982123 | 035437216 | 035447216 | 041056811 | 041056810 | 043391028 | 043401028 |
| 043844848 | 043844849 | 044706227 | 044696227 | 04503+0114 | 04504+0114 | 04576+0912 | 04575+0912 |
| 052643936 | 052633937 | 052912608 | 052902608 | 053357359 | 053347359 | 053998345 | 054008345 |
| 053395804 | 053405804 | 055767655 | 055777655 | 055815907 | 055805907 | 06280+6342 | 06279+6342 |
| 06295+5743 | 06296+5743 | 07388+4955 | 07387+4955 | 07451+5543 | 07452+5543 | 080806109 | 080816109 |
| 080661905 | 080681906 | 08082+7900 | 08080+7900 | 08162+2717 | 08162+2716 | 09162+2628 | 09161+2628 |
| 09241+5735 | 09242+5735 | 09571+8435 | 09572+8435 | 10213+0644 | 10214+0644 | 10291+6517 | 10290+6517 |
| 11029+3130 | 11028+3130 | 11033+7250 | 11034+7250 | 11058+7159 | 11060+7158 | 11161+6020 | 11162+6020 |
| 11395+1033 | 11396+1033 | 11419+2022 | 11419+2023 | 12055+6527 | 12056+6527 | 12175+2933 | 12176+2933 |
| 12409+7823 | 12409+7824 | 124464058 | 124464057 | 12551+2040 | 12552+2039 | 12561+2752 | 12561+2751 |
| 12566+3507 | 12566+3506 | 12584+2803 | 12585+2803 | 13003+8017 | 13004+8017 | 13150+2051 | 13150+2052 |
| 131772021 | 131762020 | 13428+6652 | 13429+6652 | 13446+1121 | 13445+1121 | 13467+4014 | 13468+4013 |
| 13503+6104 | 13504+6104 | 13519+6933 | 13518+6933 | 13510+0442 | 13509+0442 | 13578+0516 | 13577+0517 |
| 14156+2522 | 14157+2522 | 14457+2308 | 14457+2309 | 15480+6822 | 15480+6821 | 15519+1444 | 15519+1445 |
| 16040+1818 | 16042+1824 | 171667536 | 171677536 | 17520+3250 | 17520+3249 | 17550+6520 | 17549+6520 |
| 17552+6209 | 17551+6209 | 175116542 | 175126542 | 18011+4247 | 18011+4246 | 18130+5703 | 18129+5703 |
| 18216+6418 | 18216+6419 | 183966225 | 18402-6224 | 190735257 | 190745257 | 19290+5830 | 19289+5830 |
| 194635843 | 194625843 | 195198141 | 195188142 | 200511117 | 200501117 | 20069+5929 | 20068+5929 |
| 200446114 | 200456114 | 20448+2515 | 20448+2514 | 205464849 | 205474849 | 212366013 | 212356013 |
| 214675530 | 214685530 | 22403+2927 | 22402+2927 | 224531744 | 224541744 | 224827027 | 224817028 |
| 225376511 | 225376512 | 230165144 | 230175144 | 23229+2835 | 23229+2834 | 23252+2318 | 23251+2318 |
| 23410+0228 | 23411+0228 |