THE STELLAR CONTENT NEAR THE GALACTIC CENTER
Abstract
High angular resolution and images are used to investigate the stellar content within 6 arcsec of SgrA*. The data, which are complete to , are the deepest multicolor observations of this region published to date. The mean locus of the CMD varies across the field, a result that is attributed to differential reddening with amplitude A mag. The reddening variations within 3 arcsec of SgrA* are significantly smaller than this, and the resolved members of the compact star cluster immediately surrounding SgrA* have photometric properties that are not significantly different from objects at larger radii. We find that sources in our field with published m spectra showing either line emission or CO absorption occupy different sequences on the CMD. The emission line stars, which fall along the most richly populated sequence, have redder colors than stars in the Magellanic Clouds with similar spectroscopic characteristics, and evidence is presented that this is due to excess infrared emission in the spectrum of the GC sources.
The photometric properties of the giant branch, which is defined by stars showing CO absorption, are similar to those of the giant branch in Baade’s Window (BW). The mean color and peak brightness of the red giant branch are both consistent with a metal-rich population having an age Gyr, while the width of the giant branch on the CMD is indicative of an age spread dex. Therefore, if the inner bulge contains an underlying population of stars with ages in excess of Gyr, as is the case in BW, then the region within a few arcsec of SgrA* cannot contain a large population of giant branch stars younger than 1 Gyr. We also report the detection of a modest population of faint, blue sources with . We speculate that these are bright main sequence stars at the distance of the GC, although spectra will be required to confirm this interpretation. Nevertheless, the photometric properties of the largely unresolved compact knot of stars immediately surrounding SgrA* provide indirect evidence to support the presence of a large population of faint blue stars. In particular, we confirm previous studies that measure a relatively blue color for this cluster.
a Postal address
1 Introduction
The Galactic Center (hereafter GC) provides a unique laboratory for investigating the nuclear stellar content of a type Sbc (Blanco & Terndrup 1990, van den Bergh 1975) spiral galaxy. Crowding has restricted traditional ground-based surveys of the area within a few arcsec of SgrA* to a relatively small number of bright, highly evolved objects, many of which appear to be the result of a recent burst of star formation (Blum et al. 1996a, and references therein). However, the recent development of moderately large format infrared detector arrays, coupled with technical advances that permit near diffraction-limited angular resolution from ground-based sites, now make it possible to study fainter stars in the area immediately surrounding SgrA*.
The age distribution of stars near SgrA* is of fundamental interest, and a mixture of young, intermediate-age, and old populations is likely present. The discovery of stars showing M supergiant (Lebofsky, Rieke, & Tokunaga 1982) and Wolf-Rayet spectroscopic characteristics (Allen, Hyland, & Hillier 1990; Libonate et al. 1995; Blum, DePoy, & Sellgren 1995) within a few parsec of SgrA* suggests that star formation occured as recently as 10 Myr in the past (e.g. Krabbe et al. 1995, Tamblyn & Rieke 1993). Nevertheless, the physical conditions near the GC may act to suppress star formation, leading some to suggest alternatative explanations for the bright blue objects detected near the GC (e.g. Morris 1993).
There is evidence that the most recent burst of star formation near the GC was not a unique event. In particular, Blum, Sellgren, & DePoy (1996b) investigated the spectroscopic properties of bright red stars within an arcmin of the GC, and concluded that many of these are evolving on the asymptotic giant branch (AGB), and formed during intermediate epochs. Less direct evidence comes from studies of the nuclear regions of M31, which indicate that a centrally-concentrated intermediate-age component is also present in that galaxy (Rich & Mighell 1995; Davidge et al. 1997).
Although largely unstudied, an underlying population of old stars should also be present near the GC. In fact, photometric (Holtzmann et al. 1993) and spectroscopic (Idiart, de Freitas Pacheco, & Costa 1996) studies of Baade’s Window (hereafter BW) indicate that the bulge has an age in excess of 10 Gyr. There are indications that the region within a few arcmin of the GC contains a bulge population that is closely related to that in BW. For example, the luminosity function (LF) of stars within an arcmin of the GC constructed by Blum et al. (1996a) is well matched by the BW LF when after adjusting for the surface brightness differences between the two fields. In addition, spectroscopic studies of nearby galaxies (e.g. Davidge 1997) indicate that the bulge population extends into the nuclear regions of these objects. Nevertheless, the photometric properties of red giants within a few arcsec of SgrA* remain uncertain, although the detection of a deficiency in the strength of CO absorption (Haller et al. 1996; Sellgren et al. 1990) is ostensibly suggestive of a unique population of objects.
One of the primary goals of population studies is to establish ages, a task which in turn requires the detection of the main sequence turn-off. For the GC, this challenging task will require a combination of deep photometric and spectroscopic observations which, with the possible exception of the youngest population, are currently not feasible. Nevertheless, near-diffraction limited imaging studies conducted with 4 metre telescopes can still provide insight into the stellar content near the GC. The m wavelength region is of particular interest for imaging studies, as it provides a good compromise between the needs to reduce line-of-site extinction while avoiding the high background levels that occur longward of m. Line blanketing, which can significantly affect the spectral energy distributions of moderately metal-rich cool stars at optical wavelengths (Bica, Barbuy, & Ortolani 1991), is also greatly reduced longward of m. Finally, imaging information is required to conduct astrometric studies, and build upon the pioneering proper motion studies conducted by Eckart & Genzel (1996).
Attempts to achieve near diffraction-limited angular resolutions near the GC have been done both during (Simons & Becklin 1996; Close, McCarthy, & Melia 1995; Eckart et al. 1993, 1995) and after (Depoy & Sharpe 1991) data acquisition, with the goal of investigating the properties of relatively bright sources. In the current paper, deep high angular resolution images obtained with the 3.6 metre Canada-France-Hawaii Telescope (CFHT) adaptive optics bonnette (AOB), are used to investigate the properties of stars fainter than in a arcsec field centered on SgrA*. These data, which Rigaut et al. (1997a) use to measure stellar proper motions in the vicinity of SgrA*, are supplemented with the deep image constructed by Simons & Becklin (1996), which has been re-analyzed for this study. To the best of our knowledge, this is the deepest multicolor survey of stellar content near SgrA* conducted to date.
2 Observations and Reductions
2.1 JHK Observations
The data were recorded with the CFHT Adaptive Optics Bonnette (AOB) and MONICA (Nadeau et al. 1994) during the nights of UT June 21/22 and 22/23 1996. Optics were installed in MONICA that produced an image scale of 0.034 arcsec per pixel, so that the Hg:Cd:Te array sampled an arcsec field. The key elements of the AOB are a 19 element curvature wavefront sensor, and a 19 electrode bimorph deformable mirror. The optics are conjugated to the telescope pupil. The system operates under modal control with mode gain optimization (Gendron & Léna 1994) to track variations in atmospheric seeing. A more detailed description of the AOB is given by Rigaut et al. (1997b).
A complete observing sequence in each filter consisted of six exposures, offset on the sky at 2 arcsec intervals such that the centers of the various images defined a arcsec rectangle. Four observing sequences were completed in , while a single sequence was completed in the other filters. The reference source for atmospheric compensation was a star 10 arcsec East and 20 arcsec North of SgrA*. Additional details of the observations, including integration times and image quality measurements, are given in Table 1. Two estimates of image quality were computed for each filter: the FWHM, which measures the central compactness of the PSF, and the diameter of an aperture containing 50% of the total energy, which measures the amount of light in the extended wings of the PSF. These two quantities are similar at low Strehl ratios.
The data were reduced using the following sequence, which is similar to that described by Hodapp, Rayner, & Irwin (1992): (1) dark subtraction; (2) division by a dome flat; (3) replacement of bad pixels by interpolating between adjacent pixels; (4) subtraction of the DC sky level, estimated for each image using the DAOPHOT (Stetson 1987) SKY routine; and (5) for the images only, subtraction of the thermal component, which is introduced by foreign material (e.g. dust) on, and thermal inhomogeneities within, the optical elements. The thermal calibration frame was constructed by median combining flat-fielded and sky-subtracted images of a blank sky field, which was observed immediately following the GC. We emphasize that the thermal component is additive, and should not be confused with the multiplicative variations that are removed during flat-fielding.
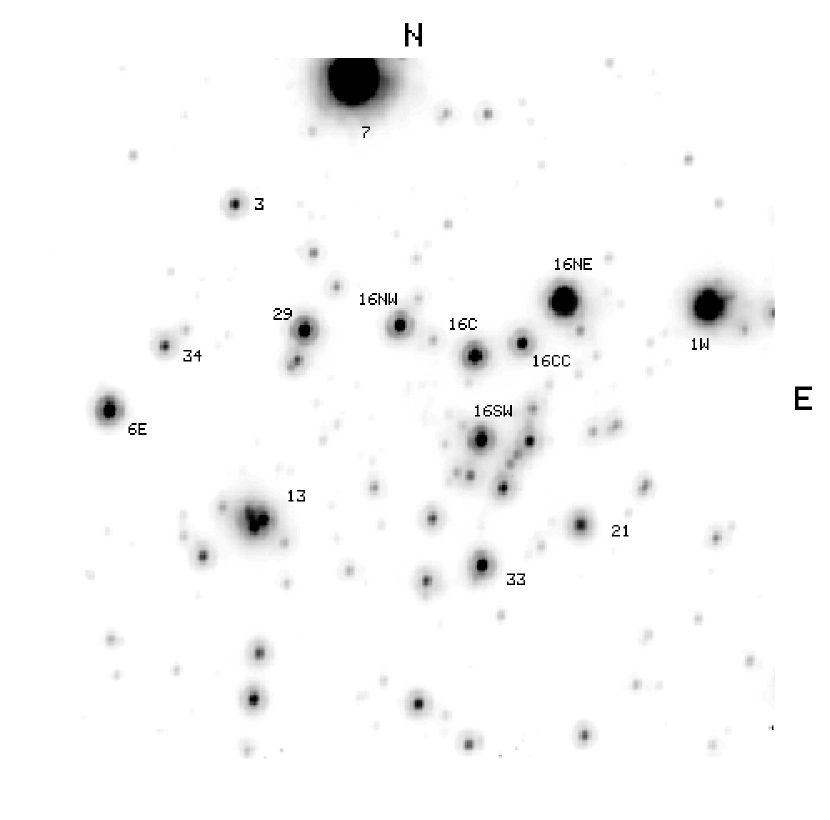
The reduced data were combined to create two sets of images for subsequent analysis. A field covering arcsec was mosaiced in each filter by combining selected portions of individual exposures. There was no overlap between the portions of the images that were combined, so the integration time at each pixel in the final mosaic is that of a single exposure. Frame-to-frame differences in image quality were found to be negligible, so it was not necessary to adjust the image quality in the individual frames when constructing the mosaic. The resulting images were used for the photometric analysis discussed in §4. The final mosaic is shown in Figure 1.
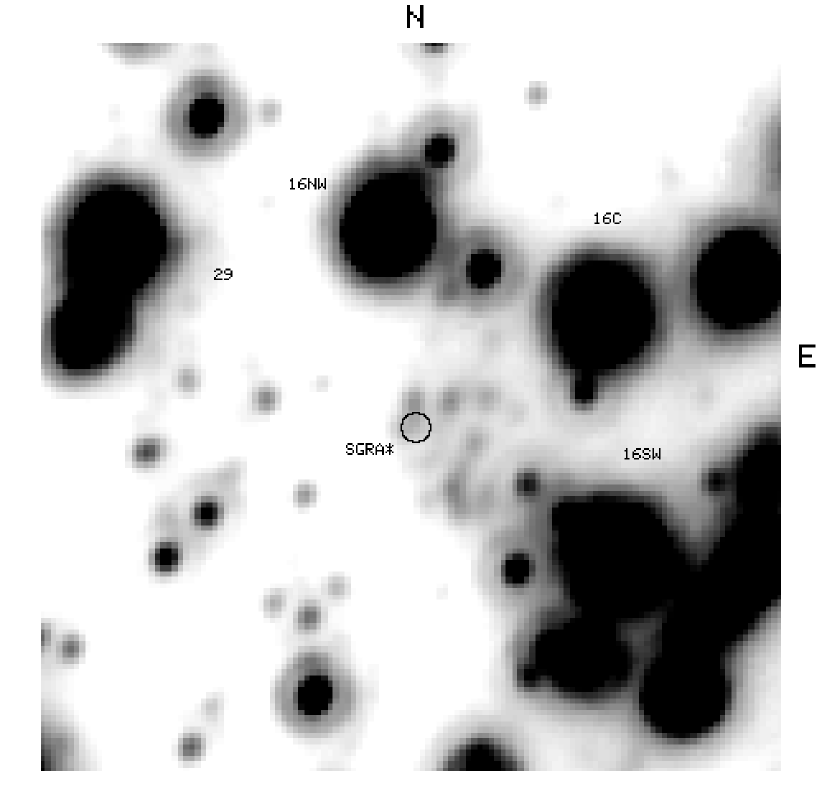
A second set of deeper images, covering a arcsec field centered on SgrA*, was constructed by averaging those portions of the exposures common to the six offset positions. The effective integration time of these images is six times that of the individual exposures. These deep images are used in §5 to investigate the integrated photometric properties of the star cluster immediately surrounding SgrA*. The final deep image is shown in Figure 2.
2.2 Observations
Details concerning the acquisition and reduction of the data were presented by Simons & Becklin (1996). The final image from that study was rotated and spatially re-sampled to match the orientation and pixel scale of the data. The image overlaps with almost 60% of the field mosaiced with the AOB.
3 Photometric Measurements
The brightnesses of individual stars were measured using the PSF-fitting routine ALLSTAR (Stetson & Harris 1988), which is part of the DAOPHOT (Stetson 1987) photometry package. Between 3 and 6 bright stars were used to construct the PSFs, depending on the filter. Isoplanatic effects were found to be negligible due to the small field size. The photometric calibration of the CFHT data was set with the UKIRT faint standard star FS24 (Casali & Hawarden 1992), which was observed at various times throughout the four night observing run. Casali & Hawarden (1992) find that and for FS24 are repeatable to mag and mag, respectively. The instrumental measurements were calibrated by computing the zeropoint shift needed to reproduce the IRS7 brightness published by Forrest, Pipher, & Stein (1989). Although there are indications that IRS7 is variable, with an amplitude of mag in (e.g. Blum et al. 1996a), the measurements of sources in the IRS16 complex made from the current data are in excellent agreement with those made by Depoy & Sharpe (1991, see below), suggesting that any error in the calibration is not large.
The radially-averaged intensity and encircled energy profiles derived from the and PSFs are shown in Figure 3. The intensity curves have been scaled so that the total energies under each curve are identical; hence, the peak intensities measure relative Strehl ratios. It is apparent that the Strehl ratio increases with wavelength, as predicted by simple models of atmospheric turbulence (e.g. Fried 1965). In addition, even though the central diffraction peak is clearly evident in the and PSFs, much of the total PSF energy is contained in broad wings that extend out to arcsec radii. These extended wings are the main reason that the two image quality estimates listed for and in Table 1 differ.
The brightnesses and colors of sources detected in and over the arcsec field are listed in Table 2; is also listed whenever measured. The random uncertainties in the photometry can be determined by comparing brightnesses of sources measured on independent frames. Such a comparison indicates that the uncertainties in are mag at , and mag at .
Table 2 also lists source positions as offsets, in arcsec, from IRS 7. The axis is aligned North-South; offsets to the North and/or East of IRS7 are positive numbers. Sources with IRS numbers, identified from images published by Tollestrup, Capps, & Becklin (1989) and DePoy & Sharpe (1991), are indicated. The number of entries in Table 2 is mainly limited by the data, which suffers from relatively large extinction and poor image quality. Moreover, some of the brighter IRS sources, such as IRS 7, were saturated in and , and hence are not listed in Table 2.
We have compared the photometric measurements for the most luminous members of the IRS16 complex with those made by DePoy & Sharpe (1991). The mean difference, , based on four IRS16 sources and in the sense DePoy & Sharpe minus the values derived in the current study, is listed in Table 3 for each filter. The quoted uncertainties are the standard error of the mean. IRS16S was not considered for these comparisons, as it is located in an extremely crowded environment. The entries in Table 3 suggest that systematic differences, in the sense that the current measurements are the fainter of the two, may be present, although differs from zero at less than the level in all four filters. Nevertheless, it is worth noting that values of are expected since the superior angular resolution of the current data acts to reduce contamination from nearby sources.
While a number of other studies have published photometry of GC sources, the lower angular resolution of these data makes it difficult to obtain accurate measurements in crowded environments such as the IRS16 complex. The occultation measurements summarized by Simons, Hodapp, & Becklin (1990) are an exception, and the brightnesses of the IRS16 components listed in Table 2 of that study agree within the estimated uncertainties with our values.
4 Photometric Properties of GC Stars
4.1 Luminosity Functions and Sample Completeness
The luminosity function (LF) of all sources detected in the mosaic field is shown in Figure 4. The number counts decline when , indicating that incompleteness becomes significant at this point, which corresponds roughly to if kpc (Reid 1993) and A (DePoy & Sharpe 1991) – values for distance and reddening that will be adopted for the remainder of the paper. Sample completeness depends on crowding, which varies across the field; consequently, the brightness at which the sample is 100% completeness will change with distance from SgrA*. The inflexion points in the , , and LFs indicate that these data are typically complete to , , and .
Blum et al. (1996a) found that the LF of stars within an arcmin of the GC follows a power-law, with an exponent matching that in BW. The current data reach roughly 3 mag deeper than those discussed by Blum et al. (1996a), while probing an area much closer to SgrA*. The dashed line in the lower panel of Figure 4 shows the power-law fit to the BW LF constructed by Tiede, Frogel, & Whitford (1995), shifted along the vertical axis to match the GC data when . It is apparent that the LFs for BW and the GC have similar exponents. Therefore, the power-law exponent of the LF within a few arcsec of the GC is the same as its value at larger radii.
Tamblyn & Rieke (1993) suggest that bright main sequence stars may be present near the GC, and that these objects could ionize the diffuse gas in this area. The most luminous Galactic main sequence O stars have M (Humphreys & McElroy 1984) and (Koornneef 1983), so that M. With the adopted values for distance and reddening, these objects would have near the GC. There is no evidence for a discontinuity in the LF when , suggesting that bright main sequence stars are not present in large numbers.
4.2 Color-Magnitude and Two-Color Diagrams
The , , and color-magnitude diagrams (CMDs) are shown in Figures 5, 6, and 7. The data in the right hand panels of each figure have been corrected for distance and reddening using the values adopted earlier. The dashed lines in the left hand panels define the 100% completeness limits; data falling above these curves have the smallest photometric errors, and hence form the basis for the photometric investigation discussed below.
Spectra taken at m indicate that bright sources near the GC can be sorted into three different groups. One group shows strong CO absorption (Lebofsky et al. 1982; Krabbe et al. 1995), and many of these stars may be evolving on the AGB (Blum et al. 1996b). Another group, which likely consists of evolved early-type stars, shows an absence of CO absorption (e.g. Rieke, Rieke, & Paul 1989) and strong m He I emission (Krabbe et al. 1991, 1995; Libonate et al. 1995; Tamblyn et al. 1996). Finally, there are also heavily reddened objects that show a very steep, largely featureless continuum, which may be Young Stellar Objects (Krabbe et al. 1995); these sources tend to be too faint to be detected with the current data at and . We have indicated on each CMD those sources in our field that have m spectra and fall into the first two groups, distinguishing between stars that show CO absorption and HeI emission.
The spectroscopically identified early and late-type stars occupy very different positions on the CMD. The former fall along the dominant plume in the CMD, with , while the latter fall along a redder sequence centered near , with a fainter peak brightness. Therefore, at least in the small field considered here, it appears that early and late-type stars can be separated on the CMD.
The relatively red colors of early-type stars near the GC are somewhat surprising. McGregor, Hillier, & Hyland (1988) obtained near-infrared spectra and photometry for a number of early-type supergiants in the Magellanic Clouds (hereafter MCs), and the six stars in their sample showing m HeI emission are plotted as filled squares in the right hand panel of Figure 5. These data were de-reddened using the estimates given in Table 8 of McGregor et al. (1988), while an LMC distance modulus of 18.45 (van den Bergh 1989) was assumed. Two of the sources do not have independent color excesses, so the mean reddening of the other four sources was adopted for these objects.
The MC He I emission stars have , and fall well blueward of the GC early-type star sequence on the CMD. The two-color diagram, shown in Figure 8, reveals that while the early-type stars near the GC have colors similar to the MC objects, they have significantly redder colors. In fact, the colors of bright early-type stars near the GC are comparable to those of late-type stars. These comparisons suggest that the early-type stars near the GC have excess infrared emission with respect to similar objects in the MCs.
The CMD and the two-color diagram, plotted in Figure 9, further demonstrate the extent to which the photometric properties of bright early-type stars near the GC are affected by non-photospheric emission. In particular, the He I emission line sources have significantly redder colors than the CO absorption stars.
The stellar content of BW has been the subject of a number of investigations, and it is of interest to compare the photometric properties of late-type stars in BW with those near the GC. This comparison is made in the right hand panel of Figure 5, where data for M giants in BW listed by Frogel & Whitford (1987, hereafter FW) are plotted. There is good agreement between the GC and BW sequences. It is apparent from Figure 8 that late-type stars in these two environments also occupy similar regions of the two-color diagram.
The CMD extends roughly 2 mag fainter in than the CMD, mainly because image quality improves while line-of-sight extinction decreases towards longer wavelengths. Unfortunately, the CMD is of only limited use for stellar content studies near the GC, due to excess infrared emission in the spectrum of bright early-type stars (see above), coupled with the lower temperature sensitivity inherent to . In fact, there is no clear distinction between the colors of HeI emission and CO absorption sources in Figure 6. Blum et al. (1996a) attributed the inability to separate early and late-type stars on the CMD to differential reddening; however, it appears that excess infrared emission originating from early-type stars is also an important consideration.
The scatter in the giant branch on the CMD is correlated with distance from SgrA*. To demonstrate this point, the field was divided into three equal area annuli, centered on SgrA*, and the resulting CMDs are compared in Figure 10. There is a tendency for stars with to be located in the inner annulus, a result that reflects the concentration of bright stars in the IRS16 complex. The comparatively narrow CMD in the vicinity of SgrA* is striking, and it is evident that the scatter along the color axis increases with radius. This trend suggests that differential reddening, the incidence of which will increase when data from areas with increasingly larger angular separations are combined, is significant in this field. Reddening variations of amplitude mag would be capable of explaining the width of the CMD.
If bright main sequence stars have only modest infrared excesses then it might be possible to separate these sources from the main body of more evolved objects on the CMD. The region on the CMDs that would be populated by early-type main sequence stars with no infrared excess is delineated by the dotted lines in Figure 10. The horizontal and vertical boundaries correspond to M and . It is perhaps not surprising that the largest number of blue objects are seen in the outermost annulus, where the photometry is deepest. We caution that these objects could be bulge stars subject to lower than average reddening, or foreground disk objects. Spectra will be required to determine the nature of these sources.
4.3 Comparisons with Isochrones
The CMD is compared with selected solar metallicity (z=0.02) and super metal-rich (z=0.05) red giant branch (RGB) and asymptotic giant branch (AGB) sequences from Bertelli et al. (1994) in Figure 11. Bertelli et al. (1994) list and for key evolutionary stages, such as the base and tip of the RGB. The solid lines in Figure 11 join the RGB-base and RGB-tip, while the dotted lines connect the RGB and AGB tips. colors were computed from the published values using the relation defined by the BW M giant observations given by FW.
The metal-rich log(t) = 10.0 isochrones provide a good match to the giant branch, as defined by sources showing CO absorption. While this agreement is gratifying, caution should be exercised when assessing the significance of this result, as the model colors are sensitive to poorly determined quantities such as the mixing length, the relation between effective temperature and color, and chemical mixture. However, the color differences between the various isochrones are likely more reliable, and the comparisons in Figure 11 suggest that the scatter in the giant branch supports an age dispersion log(t) dex among the older stars near the GC.
Luminosities predicted from evolutionary models are more reliable than colors. The brightest red stars in our field have and the isochrones in Figure 11 suggest that these may be RGB-tip objects. The models also predict that if a large intermediate age population were present then red objects brighter than should be detected; while these are abscent in the current data, a population of CO absorption sources with is seen at larger distances from SgrA* (Blum et al. 1996b).
5 Aperture Measurements of SgrA*
Eckart et al. (1995) resolved the region within an arcsec of SgrA* into a compact cluster of sources, none of which appear to be the optical counterpart to SgrA*. The brightnesses and colors of the stars in this complex that are resolved with the current data are summarized in Table 4, where is the angular separation from SgrA* in arcsec. The photometric properties of these stars are not significantly different from those of objects at larger radii, suggesting that the close proximity to SgrA* has not profoundly affected the near-infrared spectral energy distributions of these sources.
Aperture measurements can be used to probe the unresolved stellar content near SgrA*. Eckart et al. (1993) and Close et al. (1995) concluded that the region within 0.5 arcsec of SgrA* is relatively blue, although this result was based on images having poorer angular resolution than that achieved here. In an effort to verify these earlier results, aperture measurements centered on SgrA* were made using the deep co-added images described in §2. These measurements were made using the PHOT routine in DAOPHOT, with the background measured in an annulus between 1 and 1.5 arcsec from SgrA*. In addition to sky emission, the background region also contains light from the surrounding bulge and the disk, so the aperture measurements presented below should be largely free of contamination from these components.
The and colors of SgrA*, corrected for reddening, are summarized in the second and third columns of Table 5. Three aperture sizes were used, the smallest of which matches the width of the central peak in the and PSF, while the largest covers the angular extent of the SgrA* cluster, as estimated from the image. The estimated uncertainties in these colors are mag. A second set of measurements were made with the bright members of the IRS16 complex, the PSFs of which extend into the SgrA* region, subtracted from the image. The results, listed in the last two columns of Table 5, indicate that the near-infrared colors are not significantly affected by these sources.
While the colors in Table 5 change with aperture size, they are consistent with a predominantly stellar origin. This is demonstrated in Figure 12, where the aperture measurements obtained after the bright IRS16 sources were subtracted from the data are compared with those of LMC and SMC clusters studied by Persson et al. (1983). Any comparisons between the colors of bulge sources and MC clusters should be viewed with caution given the substantial differences in chemical composition that exist between these two systems. Nevertheless, the SgrA* measurements fall only slightly below the MC sequence in the two-color diagram, in qualitative agreement with what would be expected given the difference in metallicities between the GC and MCs.
6 Discussion and Summary
High angular-resolution images obtained with the CFHT AOB have been used to investigate the stellar content in a arcsec field centered on SgrA*. The CMD contains two distinct sequences that are populated by hot evolved massive stars and red giants. The hot stellar sequence is the most richly populated when , and has colors that are systematically redder than those of stars in the MCs that share similar spectroscopic characteristics. The and two color diagrams suggest that the difference between GC and MC sources is due to excess infrared emission from the GC population. This non-photospheric emission complicates population studies near the GC based on photometric data obtained longward of m, and explains, at least in part, why early and late-type GC stars occupy similar regions of the CMD. That early-type stars near the GC are more heavily obscured by circumstellar material than similar objects in the MCs is not an unexpected result if mass loss scales with metallicity, as predicted by radiative-driven wind theory (e.g. Kudritzki, Pauldrach, & Puls 1987). In addition, higher metallicities in ejected material will lead to a greater circumstellar dust content.
The giant branch stars within a few arcsec of SgrA* have photometric properties that are similar to those of giants in BW. The color and peak brightness of the giant branch locus on the CMD is well matched by metal-rich 10 Gyr isochrones, and the width of this sequence suggests that giants within a few arcsec of SgrA* span a range of ages log(t) dex. Therefore, if the Galactic bulge contains a large underlying population with an age in excess of 10 Gyr, as predicted from photometric (Holtzmann et al. 1993) and spectroscopic (Idiart et al. 1996) studies of BW, then the presence of a large intermediate age population within a few arcsec of the GC cannot be ruled out. Blum et al. (1996b) have identified a number of luminous AGB stars with within a few arcsec of SgrA*. The Bertelli et al. (1994) isochrones, shown in Figure 11, suggest that stars of this brightness need not belong to a relatively young population; rather, they could be AGB stars with ages approaching 10 Gyr.
Haller et al. (1996) and Sellgren et al. (1990) find a deficiency in the strength of CO absorption near SgrA*. While the CMD, which is complete to , shows only a modest giant branch population, the LF of our field, which extends 4 mag fainter, can be represented by a power-law exponent similar to that in BW, suggesting that a well-populated giant branch occurs within a few arcsec of SgrA*. This lends support to the suggestion made by Eckart et al. (1995) that the CO deficiency is due to contamination from an early-type population. However, we caution that the bulge is a three-dimensional system viewed in projection, so that some of the stars with small angular offsets from the GC may actually be foreground or background objects, located at large distances from the GC.
Aperture measurements centered on the largely unresolved complex of stars immediately surrounding SgrA* suggest that the light is photospheric in origin. The broad-band colors of this cluster are also relatively blue, and the discovery of a number of faint () blue stars at larger distances from SgrA* suggests that a moderately bright main sequence component may be present in the vicinity of the GC. Nevertheless, spectra will be required to determine if these are bona fide main sequence stars at the distance of the GC, intrinsically red objects that are subjected to lower than average line-of-sight extinction, or foreground disk objects.
Sincere thanks are extended to Eric Becklin for giving permission to use the IRTF data. Our gratitude is also extended to an anonymous referee, who made numerous suggestions that greatly improved the paper.
TABLE 1: Observing Log
| Filter | Date | Integration Time | FWHM | 50% EE |
|---|---|---|---|---|
| (sec) | (arcsec) | (arcsec) | ||
| UT June 22/23 1996 | 0.42 | 0.52 | ||
| UT June 21/22 1996 | 0.20 | 0.40 | ||
| UT June 21/22 1996 | 0.16 | 0.35 |
TABLE 2: Data
| Reference | IRS # | x | y | ||||
|---|---|---|---|---|---|---|---|
| # | (arcsec) | (arcsec) | |||||
| 1 | –3.9 | 0.7 | 13.28 | 6.13 | 2.05 | – | |
| 2 | 7SE | 2.1 | -1.1 | 11.69 | 6.06 | 2.52 | 1.28 |
| 3 | 5.3 | –2.6 | 12.05 | 5.30 | 2.23 | – | |
| 4 | 2.3 | –2.4 | 14.36 | 1.65 | 0.87 | – | |
| 5 | 0.4 | –3.3 | 12.65 | 5.31 | 1.91 | – | |
| 6 | 5.5 | –5.1 | 11.93 | 5.26 | 2.17 | 4.08 | |
| 7 | 16NE | 2.7 | –4.5 | 9.24 | 4.99 | 1.98 | 1.75 |
| 8 | 2.9 | –5.0 | 11.94 | 5.01 | 2.41 | 2.13 | |
| 9 | 5.6 | –5.6 | 11.95 | 5.65 | 2.53 | – | |
| 10 | 16CC | 1.9 | –5.1 | 10.50 | 5.19 | 2.23 | 1.62 |
| 11 | 0.1 | –4.8 | 14.24 | 2.01 | 0.78 | – | |
| 12 | 29S | –1.9 | –4.5 | 11.31 | 5.92 | 2.41 | 1.17 |
| 13 | 16C | 1.0 | –5.1 | 9.92 | 5.64 | 2.41 | – |
| 14 | –1.6 | –5.8 | 13.03 | 4.96 | 1.80 | 2.04 | |
| 15 | 16SW-W | 0.8 | –6.5 | 10.09 | 5.33 | 2.02 | 1.85 |
| 16 | 0.5 | –7.1 | 11.49 | 5.29 | 2.05 | 2.54 | |
| 17 | 0.1 | –7.1 | 13.58 | 5.18 | 2.24 | – | |
| 18 | 1.0 | –7.4 | 10.81 | 5.33 | 2.09 | 1.95 | |
| 19 | –0.3 | –7.7 | 11.20 | 5.25 | 2.08 | – | |
| 20 | 13 | –3.1 | –7.1 | 10.67 | 5.36 | 1.87 | – |
| 21 | 33W | –3.1 | –8.1 | 11.20 | 5.92 | 2.10 | – |
| 22 | 33 | 0.4 | –8.6 | 10.24 | 5.54 | 2.18 | – |
| 23 | 4.2 | –9.6 | 13.46 | 4.31 | 1.62 | – | |
| 24 | 0.5 | –9.5 | 12.36 | 5.56 | 2.14 | – | |
| 25 | 2.9 | –10.4 | 12.68 | 5.11 | 2.10 | – | |
| 26 | 4.5 | –11.2 | 12.25 | 5.38 | 2.17 | – | |
| 27 | –5.1 | –9.3 | 12.43 | 6.78 | 2.13 | – | |
| 28 | 2.5 | –11.2 | 12.25 | 5.77 | 2.32 | – | |
| 29 | 20 | –1.2 | –10.8 | 10.89 | 6.08 | 2.11 | – |
| 30 | –0.5 | –11.6 | 11.34 | 6.36 | 2.32 | – |
TABLE 3: Comparisons with DePoy & Sharpe (1991)
| Filter | |
|---|---|
TABLE 4: and Measurements of Sources Near SgrA*
| r | ||
|---|---|---|
| (arcsec) | ||
| 0.18 | 14.00 | 1.87 |
| 0.17 | 14.02 | 1.78 |
| 0.16 | 14.26 | 1.67 |
| 0.26 | 14.51 | 1.92 |
TABLE 5: SgrA* Aperture Measurements
| Radius | ||||
|---|---|---|---|---|
| (arcsec) | (No IRS16) | (No IRS16) | ||
| 0.085 | 0.31 | 0.10 | 0.46 | 0.17 |
| 0.170 | 0.21 | 0.01 | 0.26 | 0.05 |
| 0.340 | 0.03 | –0.09 | 0.02 | –0.08 |
REFERENCES
Allen, D. A., Hyland, A. R., & Hillier, D. J. 1990, MNRAS, 244, 706
Bertelli, G., Bressan, A., Chiosi, C., Fagotto, F., & Nasi, E. 1994, A&AS, 106, 275
Bica, E., Barbuy, B., & Ortolani, S. 1991, ApJ, 382, L15
Blanco, V. M., & Terndrup, D. M. 1990, AJ, 98, 843
Blum, R. D., DePoy, D. L., & Sellgren, K. 1995, ApJ, 441, 603
Blum, R. D., Sellgren, K., & DePoy, D. L. 1996a, ApJ, 470, 864
Blum, R. D., Sellgren, K., & DePoy, D. L. 1996b, AJ, 112, 1988
Casali, M., & Hawarden, T. 1992, JCMT-UKIRT Newsletter, 4, 33
Close, L. M., McCarthy, D. W. Jr., & Melia, F. 1995, ApJ, 439, 682
Davidge, T. J. 1997, AJ, 113, 985
Davidge, T. J., Rigaut, F., Doyon, R., & Crampton, D. 1997, AJ, 113, 2094
DePoy, D. L., & Sharpe, N. A. 1991, AJ, 101, 1324
Eckart, A., & Genzel, R. 1996, Nature, 383, 415
Eckart, A., Genzel, R., Hofmann, R., Sams, B. J., & Tacconi-Garman, L. E. 1993, ApJ, 407, L77
Eckart, A., Genzel, R., Hofmann, R., Sams, B. J., & Tacconi-Garman, L. E. 1995, ApJ, 445, L23
Forrest, W. J., Pipher, J. L., & Stein, W. A. 1986, ApJ, 301, L49
Fried, D. L. 1965, J Opt Soc America, 55, 1427
Frogel, J. A., & Whitford, A. E. 1987, ApJ, 320, 199
Gendron, E., & Léna, P. 1994, A&A, 291, 337
Haller, J. W., Rieke, M. J., Rieke, G. H., Tamblyn, P., Close, L., & Melia, F. 1996, ApJ, 456, 194
Hodapp, K-W, Rayner, J., & Irwin, E. 1992, PASP, 104, 441
Holtzman, J. A. et al. 1993, AJ, 106, 1826
Humphreys, R. M., & McElroy, D. B. 1984, ApJ, 284, 565
Idiart, T. P., de Freitas Pacheco, J. A., & Costa, R. D. D. 1996, AJ, 111, 1169
Koornneef, J. 1983, A&A, 128, 84
Krabbe, A., Genzel, R., Drapatz, S., & Rotaciuc, V. 1991, ApJ, 382, L19
Krabbe, A. et al. 1995, ApJ, 447, L95
Kudritzki, R. P., Pauldrach, A., & Puls, J. 1987, A&A, 173, 293
Lebofsky, M. J., Rieke, G. H., & Tokunaga, A. T. 1982, ApJ, 263, 736
Libonate, S., Pipher, J. L., Forrest, W. J., & Ashby, M. L. N. 1995, ApJ, 439, 202
McGregor, P. J., Hillier, D. J., & Hyland, A. R. 1988, ApJ, 334, 639
Morris, M. 1993, ApJ, 408, 496
Nadeau, D., Murphy, D. C., Doyon, R., & Rowlands, N. 1994, PASP, 106, 909
Persson, S. E., Aaronson. M., Cohen, J. G., Frogel, J. A., & Matthews, K. 1983, ApJ, 266, 105
Reid, M. 1993, ARA&A, 31, 345
Rich, R. M., & Mighell, K. J. 1995, ApJ, 439, 145
Rieke, G. H., Rieke, M. J., & Paul, A. E. 1989, ApJ, 336, 752
Rigaut, F., Doyon, R., Davidge, T. J., Crampton, D., Rouan, D., & Nadeau, D. 1997, A&A, submitted
Rigaut, F. et al. 1997, in preparation
Sellgren, K., McGinn, M. T., Becklin, E. E., & Hall, D. N. B. 1990, ApJ, 359, 112
Simons, D. A., & Becklin, E. E. 1996, AJ, 111, 1908
Simons, D. A., Hodapp, K.-W., & Becklin, E. E. 1990, ApJ, 360, 106
Stetson, P. B. 1987, PASP, 99, 191
Stetson, P. B., & Harris, W. E. 1988, AJ, 96, 909
Tamblyn, P., & Rieke, G. H. 1993, ApJ, 414, 573
Tamblyn, P., Rieke, G. H., Hanson, M. M., Close, L. M., McCarthy, D. W. Jr., & Rieke, M. J. 1996, 456, 206
Tiede, G. P., Frogel, J. A., & Whitford, A. E. 1995, AJ, 110, 2788
Tollestrup, E. V., Capps, R. W., & Becklin, E. E. 1989, AJ, 98, 204
van den Bergh, S. 1975, ARAA, 13, 217
van den Bergh, S. 1989, A&A Review, 1, 111