1 Introduction
The main motivation for studying X-ray binaries is not that they exhibit a wide range of complex phenomenology, which they do, but that they contain neutron stars and black holes. These are objects of fundamental physical interest, as they make it possible to derive information about the equation of state of very-high-density matter and to perform tests of general relativity in the strong-field regime. In this talk, I shall be discussing low-mass X-ray binaries (LMXBs) containing neutron stars exclusively, as it is in the understanding of the physics of these systems that great progress has recently become possible by the discovery, with NASA’s Rossi X-ray Timing Explorer (RXTE), of a new phenomenon, kilohertz quasi-periodic oscillations (kHz QPO).
In these LMXBs matter is transferred from a low-mass (1 M⊙) star to a neutron star by way of an accretion disk. The X rays originate in the hot (107 K) plasma comprising the inner few 101 kilometers of the flow. This is very close to the neutron star, which itself has a radius, , of order 10 km, so that by studying the properties of this flow one expects to be able to derive information about the star.
The high temperatures in the inner flow are caused by the release of large amounts of gravitational energy when the matter descends into the neutron star’s very deep gravitational potential well (; here and in the remainder of this Section I assume a value of M⊙ for the neutron star’s mass ). As the characteristic velocities near the star are of order , the dynamical time scale, the time scale for motion of matter through the emitting region, is short; 0.1 ms for =10 km, and 2 ms for =100 km.
There is a number of processes that is expected to happen on these time scales. Circular orbital motion takes place with a period (as seen from infinity; for a distant observer Kepler’s harmonic law holds in a Schwarzschild geometry). For an orbital radius of 15 km the orbital period is =0.8 ms. If the star is small enough to allow it, orbital motion at the general relativistic marginally stable orbit, at 12.5 km in a Schwarzschild geometry, takes place at (as viewed from infinity). This corresponds to a of 0.6 ms. Including the general relativistic frame dragging due to the neutron star spin this value decreases with the angular momentum of the neutron star. Various oscillations of inner disk and star are expected to take place on similar time scales, and of course the spin of the neutron star is limited by this time scale as well (a realistic neutron star maximum spin rate depends on gravitational radiation losses for rapidly spinning neutron stars and is thought to be between 0.4 and 1.4 ms; Cook, Shapiro & Teukolsky 1994).
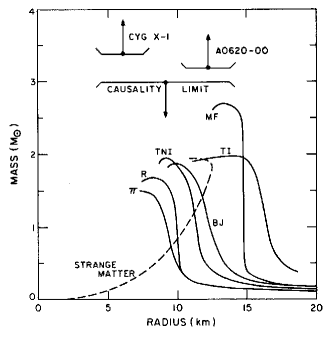
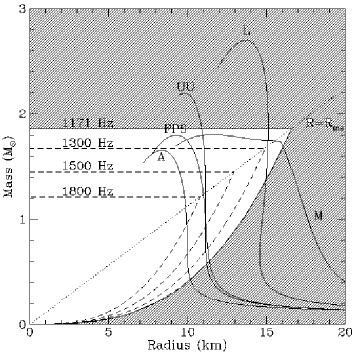
There are two different areas of fundamental physics to which study of the accretion flows onto neutron stars can contribute. First, the inner flow takes place in a region of spacetime where strong-field general-relativistic effects are important. One may therefore expect to be able to measure some of these effects, such as for example the existence of a region where no stable orbits are possible (if the star is small enough). Second, the interaction between the elementary particles in the very high-density interior of neutron stars, which determines the equation of state (EOS) of the matter there, is insufficiently well understood to confidently predict the structure, the maximum spin rate or the maximum mass of a neutron star, or even the radius of a neutron star of given mass (Fig. 1). This means that, inversely, by measuring neutron star properties and thereby constraining the EOS of very-high-density matter, one is learning new things about the properties of elementary particles.
So, the main motivation for studying the flow of matter onto a neutron star is that its nature depends on untested, or even unknown, properties of spacetime and matter. Among the most basic properties of these flows are their short, millisecond, characteristic time scales. Up to less than a year ago, no direct information existed on these flows’ properties at these time scales. In this paper I report on how, since February 1996, we are for the first time actually observing time variability from these flows at the expected millisecond time scales. New rapid-variability phenomena have been discovered, namely quasi-periodic oscillations in the X-ray flux with amplitudes of up to several 10% of the total flux, quality factors (see §4.1) of up to nearly 1000, and frequencies between 300 and 1200 Hz. I shall call these phenomena “kHz QPO” (kilohertz quasi-periodic oscillations) throughout the rest of this paper.
In studying this new phenomenon, the astrophysical community is building on some 15 years of experience with studying similar, slower oscillation phenomena in these same sources. I shall not attempt to provide a review here of what happened in these years. For a description of time series power spectral analysis methods I refer the interested reader to my paper (Van der Klis 1989a) in the excellent “Cesme” proceedings book “Timing Neutron Stars” in the same series as the present Volume. Have a look at this paper if you want to find out if your QPO is significant and what its fractional rms amplitude is. The last pre-kHz-QPO overview of rapid X-ray variability in X-ray binaries can be found in the book “X-Ray Binaries” (Van der Klis 1995). Look here if you wish to find out about atoll sources, Z sources and the latters’ 16–60 Hz horizontal-branch oscillations and the 6–20 Hz normal-flaring branch oscillations. For understanding what follows, it is useful to remind the reader of the usual terminology with respect to the subclasses of LMXBs (Hasinger & Van der Klis 1989): Z sources are near-Eddington accretors and probably have somewhat stronger (1–5 109 G) magnetic fields, atoll sources are often X-ray burst sources, have luminosities between 10 and a few 10, and are thought to have somewhat weaker magnetic fields (108–109 G).
X-ray astronomers are presently scrambling to try and make sense of the phenomenology of kHz QPO, which turn out to be at the same time highly suggestive of interpretation and very restrictive of possible models, whereas theorists have already begun working out sophisticated models. None of this has reached an equilibrium state yet, and what I report in this paper will necessarily be of a “snapshot” nature. What is clear at this point is that for the first time we are seeing a rapid X-ray variability phenomenon that is directly linked with a neutron star’s most distinguishing characteristic (only shared among macroscopic objects with stellar-mass black holes): its compactness. This is particularly evident if the phenomena in some way are related to orbital motion. After all, a Keplerian orbital frequency of 1200 Hz around a 1.4M⊙ neutron star as seen from infinity corresponds to an orbital radius of 15 km, directly constraining the EOS and only just outside the general-relativistic marginally stable orbit. Whatever the model, for the first time we have to seriously worry about general relativistic effects in describing the observable dynamics of the physical system.
2 Why now?
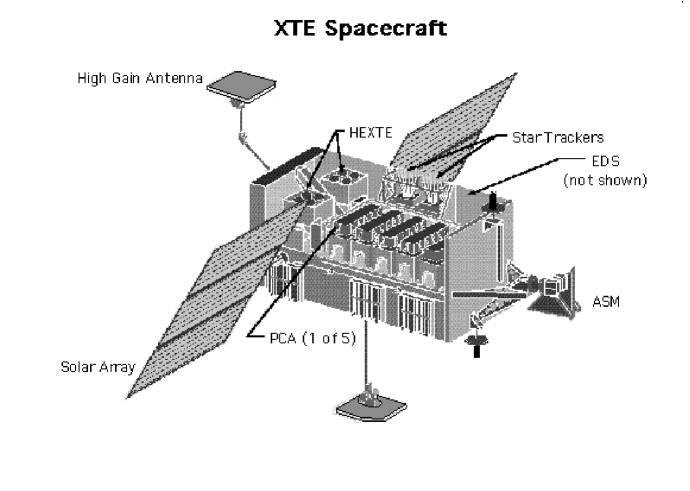
It is appropriate to spend a few lines on the question: what made these discoveries possible? On December 30th, 1995, NASA lauched the Rossi X-ray Timing Explorer (RXTE). The proportional counter array (PCA) onboard the RXTE satellite has an effective area of 7000 cm2. This is more than 4 to 8 times the area of the main instrument of ESA’s EXOSAT (1983–1986; half the detector array was usually used to monitor the background) and nearly twice that of ISAS’s Ginga (1987–1991). For really bright sources, the PCA is able to detect 105 c/s, whereas the other two instruments could not be safely pointed towards the brightest sources (these were only observed off-axis) and attained highest count rates of 104 c/s. The reason that this is such a crucial difference, (but not the only reason that kHz QPO were not found before, see below) is that the signal-to-noise ratio (in sigmas) with which photon-counting instruments detect weak variability of given fractional rms amplitude goes linear with count rate : for a power spectral feature of width and integration time the signal-to-noise ratio is (in the limit that and for negligible background) (Van der Klis 1989b; notice that this expression gives the signal-to-noise ratio, or the “single-trial detection-significance in sigmas”, which is not the same as the sensitivity to QPO, which depends on the number of trials; Van der Klis 1989a). If the background is not negligible, the expression becomes
where and are the source and background count rate, respectively, and is the rms amplitude as a fraction of the source count rate. This means that for a QPO peak to be detectable even at just a 3 level with EXOSAT’s “half array” it should be 25 in RXTE. Among the kHz QPO peaks now known there are a few that are that significant, but not many.
EXOSAT’s best time resolution was 0.25 ms, leading to a 2-kHz Nyquist frequency, sufficient for all phenomena to be discussed here. Ginga had 1 ms as its best time resolution (and even this was due to a last-minute design change motivated by the discovery, with EXOSAT, of QPO phenomena in the 6–60 Hz range), and therefore could not observe beyond 0.5 kHz. Although most of the new phenomena were therefore (just) out of its reach, with Ginga the kHz QPO now known to occur in X-ray bursts in 4U 172834, which have frequencies of 363 Hz, could easily have been discovered. Yet EXOSAT nor Ginga discovered the kHz QPO.
The reasons for this can be found in differences in telemetry bandwidth and observing efficiency. Whereas sub-millisecond time resolutions were sometimes employed in EXOSAT observations of the brightest sources (Z sources and the brightest [“galactic center”] atoll sources, see Hasinger & Van der Klis 1989), they were rarely used for fainter objects, and as it seems now, in the bright sources the kHz QPO have lower fractional amplitudes and/or are restricted to the higher photon energies. The reason that 0.25-ms resolutions were not routinely used was that the limited telemetry bandwidth forced a choice between instrumental modes stressing spectral resolution at the expense of time resolution or vice versa. In order to get at least some spectral resolution at millisecond time scales, observers often favoured a mode (HER7) where 4-ms resolution data were obtained in 4 broad energy bands (plus a slow, high spectral-resolution mode running in parallel). When searching for variability near 1 ms in low-mass X-ray binaries, they usually selected the brightest sources in the class (the distinction between Z and atoll sources didn’t become clear until the EXOSAT mission was over; Hasinger & Van der Klis 1989). See Jongert & Van der Klis (1996) for an account of a periodicity search in X-ray bursts observed with EXOSAT. The best Nyquist frequencies in that search were indeed 2 kHz, but in most cases it was 0.25 kHz or even less.
Most of the work with Ginga concentrated on X-ray spectroscopy, not timing. The high time-resolution modes could only be used when the satellite was over the ground station in Japan, which made for a very low observing efficiency in those modes. (This problem of communication with the satellite is solved in the case of RXTE by using the TDRSS communications satellites.) Consequently, relatively short integration times were usually attained in high-time resolution configurations. Nevertheless, Ginga data might yet yield a kHz QPO as frequencies below its 0.5 kHz Nyquist frequency do occasionally occur (see Tables 1 and 2).
3 The early discoveries
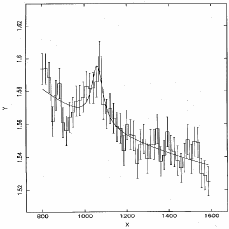
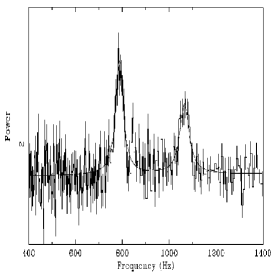
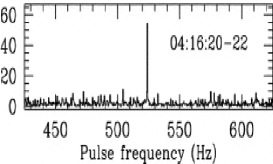
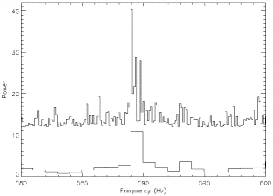
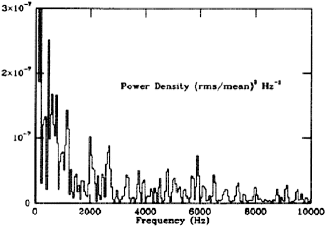
The first two sources in which kHz QPO were detected, during an exciting few days in February 1996, were 4U 172834 and Sco X-1. Tod Strohmayer of Goddard Space Flight Center (GSFC) and collaborators had proposed to observe 4U 172834 in order to look for neutron star r- and g-modes and for the neutron star spin. I had traveled down to GSFC to perform the first RXTE observations of Sco X-1, which our group (comprising some of the same people of the RXTE PCA team as Tod’s) had proposed to take advantage of RXTE’s 105 c/s capability (§2) which would improve the detection significance of any weak variability by an order of magnitude. In our proposal we had remarked that we suspected beat-frequency QPO phenomena near “700 Hz” might be observed. We, too, had promised to look for the neutron star spin. While, after a bit of waiting for our data to come out of the production pipeline, I was just starting the first Sco X-1 analysis, Tod showed me his first power spectrum of 4U 172834 exhibiting a QPO peak near 800 Hz. This was the first “kHz” phenomenon. When I got on with the Sco X-1 data, sure enough, there was a peak near 1100 Hz! This was the first “sub-millisecond” phenomenon (Fig. 3).
Of course I discussed this result with Tod and the Sco X-1 team members. We were very excited, but cautious, as obviously the new effect might be instrumental, and our conversations focused on ways to make certain it wasn’t. I analyzed some of our data on Cyg X-1 which had similar observational parameters and count rate as the 4U 172834 data, and showed the result to the 4U 172834 team: it was clear that there was no sign of any 800 Hz QPO there. For Sco X-1 I found that the frequency of the 1100 Hz QPO increased along the so-called “normal branch” (NB) in the X-ray color-color diagram, i.e., with mass accretion rate. Both teams were sufficiently confident that the effects were real, IAU Circulars were submitted and they came out on February 20th (Van der Klis et al. 1996a; Strohmayer et al. 1996a). In the Sco X-1 circular we said we thought we might be seeing “the keplerian frequency at the inner edge of the disk near the magnetospheric boundary, or its beat frequency with a slower (100 Hz) pulsar”; in the 4U 172834 circular Strohmayer et al., more cautiously, remarked that “explanations in terms of either keplerian frequencies or a beat-frequency model cannot yet be ruled out, although no evidence has yet been seen for a coherent pulsar frequency in the same data.”. They also noted that “oscillation modes associated with the crust of a neutron star have frequencies in the range observed”. Tod later told me that he submitted his 4U 172834 circular before I submitted the Sco X-1 circular, and that he was dismayed it came out second. Of course, officially the IAU Central Bureau for Astronomical Telegrams is not in the business of establishing scientific priorities; their mission is to rapidly disseminate urgent information. Our discoveries were not independent, as we discussed our results and assisted each other before publication, and the two teams had common members. But let it be noted for history: Tod saw the 800 Hz in 4U 172834 before I saw the 1100 Hz in Sco X-1! I think it is good that in these exciting first few days we focused on the science and freely exchanged information rather than letting the competitive spirit get the better of us. As we ventured on into the new field, this principle of a rapid and open flow of information has been maintained, much helped by that invaluable medium, the IAU Circulars. Particularly in the case of satellite missions, with their limited life spans, the rapid distribution of scientific results is essential to make optimal use of the observational resources.
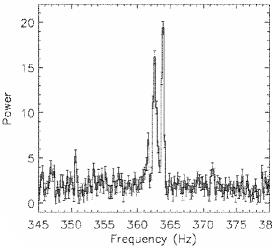
The next thing that happened was that on March 6 Van Paradijs et al. (1996) reported QPO in the 850–890 Hz range in a third source, 4U 160852. The first opportunity after all this excitement that some of us had to come together and discuss the new discoveries was during the 2-3 April RXTE Users Group Meeting at Goddard Space Flight Center (Schwartz 1996). By then I had been able to detect a second QPO peak near 830 Hz in Sco X-1 simultaneous with the 1100 Hz peak by making use of a special capability of RXTE onboard data processing (recording of “double events”). In 4U 172834 Todd Strohmayer had an indication for a weak feature above 1000 Hz, but he wasn’t sure of it yet. Just a few weeks later, he was: on April 26 in another IAU Circular Strohmayer et al. (1996b) reported the simultaneous presence in 4U 172834 of two kHz QPO peaks whose frequencies changed with time but whose difference remained near 363 Hz. In addition, they had seen a third QPO peak in five out of seven X-ray bursts of the source which also had a frequency of 363 Hz. Of course, this showed that we were dealing with a beat-frequency phenomenon (§4.3). Strohmayer et al. (1996b) did not mention this in so many words, but they did mention one of the most salient conclusions of this: that the observations were consistent with a neutron star spin period of 2.75 ms (1/363 Hz). Articles about these initial Sco X-1 and 4U 172834 results appeared in the September 20, 1996 ApJ Letters issue (Van der Klis et al. 1996c, Strohmayer et al. 1996c; see Fig. 4).

4 The current situation
Source Lower Upper Peak Burst References (in order peak peak sepa- QPO of RA) freq. freq. ration freq. (Hz) (Hz) (Hz) (Hz) 4U 0614+09 520 Ford et al. 1996, 1997a,b Van der Klis et al. 1996d 480 750 Méndez et al. 1997a 3274 328a Vaughan et al. 1997 800 1150 4U 160852 570 Van Paradijs et al. 1996 Berger et al. 1996 800 Vaughan et al. 1997 650 940b 2937 Méndez et al. 1997b Yu et al. 1997 890 1125b 23312 4U 163653 830 Zhang et al. 1996, 1997 Zhang 1997 898 1147 25720 Van der Klis et al. 1996d 581 Wijnands et al. 1997a 940 1190 27610 Vaughan et al. 1997 1228 835 897 4U 172834 500 Strohmayer et al. 1996a,b,c 640 990 3555 363 790 1100 KS 1731260 898 1159 26010 524 Morgan & Smith 1996 Smith et al. 1997, Wijnands 1207 & Van der Klis 1997 4U 173544 1140 Wijnands et al. 1996, 1997b 1160 MXB 174329c 589 Strohmayer et al. 1996d, 1997 4U 182030 546 Smale et al. 1996, 1997 796 1065 2758 Aql X-1 750 Zhang 1997 549 830
Arrows indicate ranges over which the frequency was observed to vary; these can be made up of several overlapping ranges from different observations. Frequencies not connected by arrows are measurements at different epochs. Frequencies in the same row were observed simultaneously (except for burst QPO). Entries straddling the upper and lower peak columns are of single, unidentified peaks. a Marginal; in persistent emission (Ford et al. 1997a). b Special detection method; Méndez et al. (1997b). c Source identification uncertain.
Kilohertz QPO have now111October 1st, 1997 been reported in 13 LMXBs, 4 of which are Z sources and 9 of which are atoll sources and probable atoll sources (see Van der Klis 1995 for a recent review of LMXB subclasses; hereafter I shall use “atoll source” for LMXBs that probably fall in this class as well as for those that definitely do so), together covering nearly three orders of magnitude in X-ray luminosity (10-3 to 1 ). Tables 1 and 2 summarize some of these results, and provide an overview of the literature that is approximately complete as of this writing. A clear pattern of systematic behaviour has emerged, and for that reason, rather than getting into an exhaustive description of the phenomenology, or following the historical line I shall concentrate on what I consider at this point to be the main clues. For most of the kHz QPO observational references in the remainder of this section I refer to these Tables.
4.1 Twin peaks
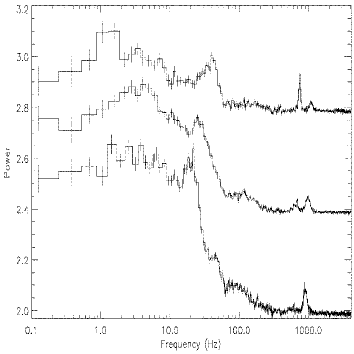
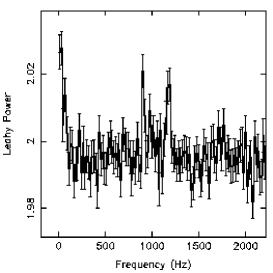
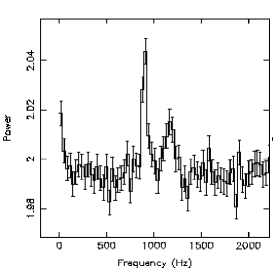
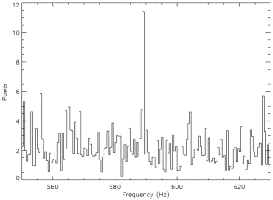
In nearly all kHz QPO sources (10 out of 13) two simultaneous kHz peaks (hereafter: twin peaks) are observed in the power spectra of the X-ray count rate variations (Figs. 4–6).

The lower-frequency peak (hereafter the lower peak) has been observed at frequencies between 325 and 940 Hz, the higher-frequency peak (hereafter the upper peak) has been observed at frequencies between 500 and 1228 Hz. When the accretion rate increases, both peaks move to higher frequency. In atoll sources is inferred to correlate with X-ray count rate (except in some “upper banana” states, Hasinger & Van der Klis 1989, where no kHz QPO have so far been seen), and in these sources kHz QPO frequency increases with count rate (Fig. 7). In Z sources in the so-called “normal branch” (NB), is inferred to anticorrelate to count rate, and indeed in Z sources in the NB, the kHz QPO frequency increases when the count rate drops, but in those sources, also, frequency increases monotonically with as inferred from curve length along the Z track.
Source Lower Upper Peak References (in order peak peak sepa- of RA) freq. freq. ration (Hz) (Hz) (Hz) Sco X-1 570 870 Van der Klis et al. 1996a,b,c, 2922 1997b 800 1050 2473 830 1080 1130 GX 51 567 Van der Klis et al. 1996e 325 652 32711 448 746 895 GX 17+2 645 Van der Klis et al. 1997a Wijnands et al. 1997c 480 780 2948 780 1080 1087 Cyg X-2 730 Wijnands et al. 1997d 490 840 34321 530 860 1020
Notes: see Table 1.


In the sources 4U 0614+091 (Ford et al. 1997a; Méndez et al. 1997a) it has been observed that the frequency vs. count rate relation was different at different epochs; the frequency seems to better track the black-body flux as obtained from a two-component spectral fit than the total count rate (Ford et al. 1997b). In 4U 160852 (Méndez et al. 1997b) the frequency vs. count rate relation is either non-monotonic or time-variable.
In most sources, the separation between the kHz peaks is consistent with remaining constant while the peaks change frequency (Figs. 7 and 8). However, in Sco X-1 the peak separation varies systematically with inferred , from 310 Hz when the upper peak is near 870 Hz to 230 Hz when it is near 1075 Hz: the peaks move closer together by 80 Hz while they both move up in frequency as increases (Fig. 9 left; Van der Klis et al. 1997b). In 4U 160852 (Méndez et al. 1997b) the peak separation between two different observations also appears to have changed.

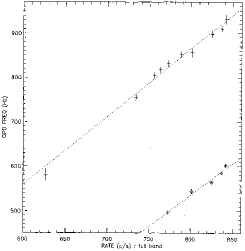

In Sco X-1, there is a good correlation between the frequencies of the 6 Hz “normal branch oscillations” and the kHz QPO which is not easy to understand within current models (Fig. 9 right; see Van der Klis et al. 1996c for a suggestion).


One of the distinguishing characteristics of kHz QPO is that they often show a relatively large coherence. The quality factor Q, defined as the QPO peak’s centroid frequency divided by its full width at half maximum regularly reaches values of more than 100 in one or both of the twin peaks (although Q values near 10 are also common). This provides a strong constraint on “orbiting clump” type models (below), as lifetime broadening considerations show that the clumps must persist over hundreds of cycles.
Because QPO amplitudes depend very strongly on photon energy (§4.5), great care must be taken in comparing amplitudes between different sources or different observations, as both differences in the effective energy band used as differences in absorption can strongly affect the overall amplitude. Values between 1 and 15% (rms) have been reported over the full RXTE/PCA band (2–60 keV).
4.2 Burst QPO
In five atoll sources single kHz peaks have been seen during one or more X-ray bursts, with frequencies between 363 and 589 Hz (Table 1). These oscillations are not detected in each burst. Where, in a given source, they have been seen more than once (in more than one burst) the frequency was the same within 1 Hz. In three of these sources (4U 172834, 4U 163653 and KS 1731260) twin kHz peaks in the persistent emission have also been obseved. It turns out that in each case, the burst QPO frequencies (360–580 Hz) are close to the frequency differences between the twin peaks (in 4U 172834), or twice that (in the other two sources). Of course this immediately suggests a beat-frequency phenomenon (Strohmayer et al. 1996c; see §4.3). In a sixth atoll source (4U 0614+09) there is marginal evidence for a third peak at the twin-peak separation frequency which corresponds to an oscillation in the persistent emission rather than in X-ray bursts.
The burst QPO have shown even larger coherence than the twin peaks (Fig. 10). In several cases, they were coherent as long as they could be observed (seconds). Burst QPO attained a record-level Q of 900 in a burst in KS 1731260 (Smith, Morgan & Bradt 1997). In 4U 172834 and 174329 (Strohmayer et al. 1996c, 1997), drifts by 1 Hz have been observed in the QPO frequency. These drifts are suggestive of the bursting layer slightly expanding and then recontracting, changing its rotation rate to conserve angular momentum and thus modulating the QPO frequency. Both the high Q value and the small frequency drifts of the burst QPO therefore support the view that their origin lies in the neutron star spin, and that their frequency is close to the spin frequency. We could be seeing hot spots at the surface related to uneven nuclear burning caused by either a propagating nuclear burning front or the build-up (due to magnetic channeling) of extra fuel at the magnetic poles which burns during the burst. In the latter case the link between the magnetic field lines and the hot spots must be severed during the X-ray bursts in order to make the frequency drifts possible. This could happen as a consequence of the convection in the bursting layer (Bildsten 1996, priv. comm.).
4.3 A beat-frequency phenomenon
The three cases of three commensurate frequencies described above demonstrate that a beat-frequency phenomenon plays a central part in kHz QPO phenomenology: two frequencies must be interacting to produce a third one. If the burst QPO indeed arise through surface features spinning around with the neutron star, then the “other” frequency must be due to something that is able to beat with the spin frequency in such a way as to produce (to first order) only one additional frequency. The simplest way to do this is by some other azimuthal variation. The most straightforward model is that this azimuthal variation consists of inhomogeneities at the inner edge of the accretion disk moving around the neutron star with the local Keplerian angular velocity. In this model the upper kHz peak is at the Kepler frequency corresponding to the inner edge of the disk, and the lower peak at its beat with the spin (assuming disk and star spin in the same direction; otherwise the interpretation of the two kHz peaks is reversed). The fact that the burst QPO sometimes have a frequency twice the twin peak separation implies that in those cases we see two events (e.g., due to two hot spots on the surface) per neutron star spin period, where the inner edge of the disk sees only one. Other models than this simplest one are in principle possible, for example models involving beats between the spin and oscillations either at the neutron star surface or in the disk. These could have very different angular velocities than the Keplerian one, and could have -fold symmetries making the beat frequency times higher. This kind of devil’s advocate models will need careful attention in order for interpretations in terms of neutron star parameters and general relativistic effects to be compelling. Even if the upper peak reflects clump orbital motion at the inner edge of the disk, we have as yet no independent evidence that the orbital velocity of these clumps is the same as that of a test particle in vacuum; in fact, radiation forces are expected in some cases to be considerable.
If we accept that some kind of beat-frequency model is at work, with the burst QPO at the neutron star spin frequency (or twice that), the upper kHz peak at the Kepler frequency of some preferred orbital radius around the neutron star, and the lower kHz peak at the difference frequency between these two, then the next question is, what is this preferred radius. Strohmayer et al. (1996c) suggested that it is the magnetospheric radius, Miller, Lamb & Psaltis (1996) proposed it is the sonic radius (§5.4).


In models of this kind, which involve the neutron star spin as one of the frequencies participating in the beat-frequency process, the twin peak separation is predicted to be constant. Therefore, the results of a varying twin-peak separation in Sco X-1 (and, if confirmed, 4U 160852) are in strong contradiction to straightforward beat-frequency models. To maintain the beat-frequency idea, in Sco X-1 a second unseen frequency has to be postulated in addition to the (in Sco X-1) unseen neutron-star spin frequency. Two different proposals to explain the systematically varying peak separation frequency in Sco X-1 have been put forward. Lamb (priv. comm. 1996) suggests different inner disk edge frequencies at different heights above the symmetry plane in a thick disk, White & Zhang (1997) propose changing rotation frequencies of the puffed-up neutron star envelope which maintains its angular momentum, and therefore slows down, as the envelope puffs up, similarly to what has been proposed to happen in X-ray bursts. Both proposals rely on the near-Eddington accretion typical of Z sources and would not work for 4U 160852 near 0.1
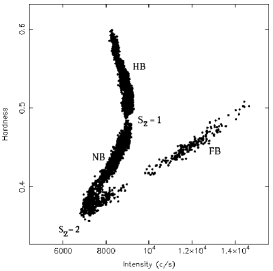
In all four Z sources with kHz QPO (Table 2) twin kHz peaks and the so-called horizontal-branch oscillations (HBO; Van der Klis et al. 1985) are seen simultaneously (Fig. 11). HBO have been interpreted to be a product of the magnetospheric beat-frequency mechanism (Alpar & Shaham 1985, Lamb et al. 1985), and so have kHz QPO in atoll sources (Strohmayer et al. 1996c). Clearly, in Z sources this model can not explain both types of QPO. It is possible in principle that the kHz QPO in the Z sources is a different phenomenon from that in the atoll sources (e.g., Strohmayer et al. 1996c), but this seems unlikely: the frequencies, their dependence on , the coherencies, the peak separations and the fact that there are two peaks, one of which sometimes becomes undetectable at extreme , are too similar to attribute to just coincidence. The amplitude of the kHz QPO in Z sources is also in the range of that seen in the atoll sources (although in some atoll sources much higher values have been seen). If there is only one phenomenon, then the variable twin peak separation in Sco X-1 and perhaps 4U 160852, the simultaneous presence of kHz QPO and HBO in Z sources, and the direct indications for a beat frequency in the atoll sources must all be explained within the same model, a formidable challenge. If the sonic-point beat-frequency model explains the kHz QPO and the magnetospheric beat-frequency model the HBO, then in Z sources there is a Keplerian disk well inside the magnetosphere (Van der Klis et al. 1997b).
4.4 Single peaks
One of the twin peaks sometimes (at high or low for the source considered) drops below the detection limit while the other one is still observable (Tables 1 and 2). Burst QPO so far were always single. In addition to these cases of single kHz QPO peaks, there has been a number of cases where the suspicion arose that a single kHz peak might be something else than either one of the twin peaks or a third peak located near the difference frequency of the twin peaks. In particular this was the case in 4U 160852 (Berger et al. 1996) and 4U 163653 (Zhang et al. 1996, Wijnands et al. 1997a). In these cases, the frequency of the QPO peak seemed to vary erratically over a range of 830–890 Hz (4U 160852) and 835–897 Hz (4U 163653) while there were no obvious variations in the X-ray colors that indicated that changed. The frequency variations seemed unrelated to count-rate variations as well. However, in 4U 160852 Mendez et al. (1997b) recently, by applying a new technique to increase sensitivity to weak QPO, detected a second peak. A dependence of frequency on count rate (although a different one during two observations three days apart) was also found. So, although the final word is not yet in, it now seems likely that these “single” peaks are just another aspect of the twin-peak kHz QPO phenomenon.
4.5 Energy dependence
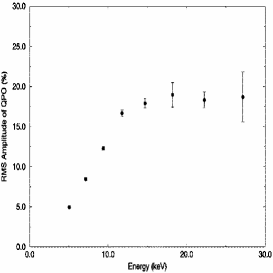
The amplitudes of kHz QPO have, in all cases where a check was possible, shown a strong positive dependence on photon energy (Fig. 12). Their amplitudes when measured in a broad photon-energy band can therefore be expected to depend strongly on details of the low-energy part of the spectrum, which contributes many photons and little kHz QPO amplitude: detector cutoff and interstellar absorption will affect the overall fractional amplitude. Reported fractional amplitudes vary between 0.5 and a few percent in Z sources and 3 and 15% (rms) in atoll sources when measured over a 2–20 keV band; at higher energies amplitudes up to 40% (rms) have been observed.
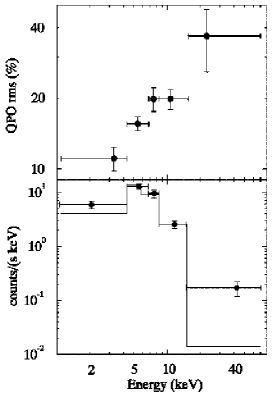
Méndez et al. (1997a) show that the energy spectrum of the oscillating flux can be fitted with a blackbody spectrum with a temperature of 1.6 keV and a radius of 0.50.2 km (Fig. 12). The QPO could therefore be due to modulation of emission from a region on the neutron star surface with these properties. However, the data allow many different spectral models. For example, alternative interpretations that fit the data as well are that the oscillations are caused by variations with an amplitude of 2.5% in the temperature of a 1.1 keV blackbody with a radius of 10km, or by 5% variations in the optical depth of an unsaturated Comptonization spectrum.

A final strong model constraint is provided by the small magnitude of time lags between the kHz QPO signal as observed in different energy bands. Time-lag measurements require very high signal-to-noise ratios, and have so far only been made in the “single” peaks in 4U 160852 and 4U 163653 near 850 Hz, and in a 730 Hz peak in 4U 0614+09 which was probably an upper peak (Vaughan et al. 1997). Finite lags of 10–60sec were discovered in 4U 160852; the hard photons lag the soft ones by increasing amounts as the photon energy increases (Fig. 13). Upper limits of 30sec and 45sec were set in 4U 163653 and 4U 0614+09, respectively. These are by far the smallest lags ever measured; they correspond to light travel distances of 3–20 km! For rather general assumptions about the spectral formation mechanism, this limits the scale of any Compton scattering regions dominating the spectral shape to between a few and a few tens of km.
4.6 Puzzles
The great enigma in the phenomenology right now is, in my opinion, the peculiar lack of correlation between kHz QPO frequency and average source luminosity, whereas in each individual source a strong correlation between frequency and is observed (Van der Klis 1997). In 4U 0614+09, at a luminosity of a few times 10, similar QPO frequencies have been observed as in 4U 182030, which is near 10, and in Sco X-1, which is inferred to be a near-Eddington accretor. (It is interesting to note that no kHz QPO have been detected in sources such as GX 9+1, GX 9+9 and GX 13+1 which are thought to cover the 0.1–0.5 range.) This must mean that another, compensating, parameter than just instantaneous accretion rate is affecting the properties of the kHz QPO, most likely by directly affecting the frequency, although some kind of selection effect that leads to suppression of any QPO outside the 300–1200 Hz range is also a possibility. This latter possibility of course requires that the peaks actually observed in sources with different luminosities are in some sense “different”. One would expect that in sources that go through a large decrease in accretion rate (transients) several “new” QPO peaks would successively appear near 1200 Hz, move down in frequency and disappear near 300 Hz. This has not been seen and seems somewhat unlikely.
An obvious candidate for such a compensating parameter is the neutron star magnetic field strength, but neutron star mass or spin, either by their effects on the surrounding space-time or directly, might play a role as well. What would be required, specifically, is that there exists a correlation or an anti-correlation between, say, the magnetic field strength of the neutron star and its mean accretion rate , and that the QPO frequency depends on in such a way as to approximately compensate the effect. Interestingly, it has been concluded previously (Hasinger and Van der Klis 1989, see Van der Klis 1995) on the basis of comparing Z and atoll source phenomenology that and are correlated among LMXBs. Recently, spectral modeling (Psaltis et al. 1997) has tended to confirm this, and very recently White & Zhang (1997) have shown that if one assumes a standard spin-up law (which, as they remark, may be incorrect, see below) and spin up at an equal to the current one, the spin rates that can be inferred from the kHz QPO imply a tight correlation between average and . In the magnetospheric beat-frequency model (Alpar & Shaham 1985) , if it really is correlated with , qualitatively fits the requirements for the compensating parameter sketched above. However, the simultaneous detections of HBO and kHz QPO in the Z sources (§4.3) as well as a number of other considerations (Miller et al. 1996) make this model unattractive. Perhaps, the magnetic field strength affects the inner accretion flows in other ways than by just terminating the disk at the magnetospheric radius. If magnetic stresses could somehow slow down the (for example, orbital) motion responsible for the kHz QPO, that would do the trick. Of course, radiative stresses diminish the effective gravity and are expected to slow down orbital motion (Miller & Lamb 1993), but the luminosity is not independent from , but instead expected to vary proportionally to it, so that radiative stresses cannot fulfill the compensating-parameter role: we already know that when in a given source goes up so does , but this does not prevent the QPO frequency from going up as well.
Another suggestion (A. King, at the September 1997 Amsterdam Workshop on Compact Stars and Close Binary Systems) is that the neutron star surface temperature (as set by some longer-term average over ) affects the frequency- relation. The attraction of this idea is that it might also explain the changes in the frequency vs. count-rate relation in 4U 0614+09 and 4U 160852 (§4.1).
Two final puzzles: (i) The maximum kHz frequencies observed in each source (Tables 1 and 2) are nearly all constrained to the relatively narrow range 1036–1228 Hz. In at least five sources, spread over the entire range of average X-ray luminosity, the upper peak has been observed to disappear below the detection limit when its frequency is somewhere in this range as soon as the flux exceeds a certain limit. However, this flux limit is widely different between sources. There is no evidence for a sudden drop in QPO amplitude near these flux limits. It is as if this clustering of frequencies is caused by a conspiracy for the apparently brighter sources to have intrinsically weaker kHz QPO, which can’t be true. (ii) The 12 neutron star spin rates that can be inferred from the kHz QPO (Tables 1 and 2; spin is estimated as either the burst QPO frequency or half that, or the twin peak separation frequency) are also confined to a quite narrow range (235–363 Hz). According to White & Zhang (1997) the least contrived explanation for this is that the magnetospheric radius (and therefore the equilibrium spin rate) depends only very weakly on accretion rate, and the magnetic field strengths of these neutron stars are all similar.
4.7 Promises
From the above it should be clear that kHz QPO likely provide the first measurements of the spin rates of low-magnetic-field neutron stars in LMXB — a holy grail of X-ray astronomy since twenty years. The spin rates are in rough accordance with expectations from the LMXB-millisecond radio pulsar evolutionary connection. As was already discussed in §4.6, they may also present a possibility to constrain neutron star fields.
The most exciting aspect of kHz QPO, however, is that potentially they can be used to constrain neutron-star masses and radii, and to test general relativity. There is a lively ongoing discussion about this. Kaaret, Ford & Chen (1997) have proposed that the behavior of the “single” QPO peaks in 4U 160852 and 4U 163653 described above is related to orbital motion near the marginally stable orbit, and from this derive neutron star masses of 2M⊙. Zhang, Strohmayer & Swank (1997) have proposed that the narrow range of maximal frequencies described above must be identified with the general-relativistic marginally stable frequencies, which leads them to the conclusion that the neutron stars’ masses are near 2M⊙ as well. An alternative possibility is that the maximal frequencies are set by the Keplerian frequency at the neutron star surface. This requires the star to be larger than the marginally stable orbit and for 1.4M⊙ neutron stars would favour the stiffest equations of state. As should be clear from §4.4 and 4.6, there are quite considerable problems with these interpretations. Very recently, Stella & Vietri (1997) have proposed that the Lense-Thirring precession frequencies for the inner edge of the disk that can be predicted on the basis of the measured neutron-star spin frequencies and Kepler frequencies can be seen in the power spectra of some atoll and perhaps even Z sources in the form of broad low-frequency humps (these humps were already noted by Hasinger & Van der Klis 1989 and are very clear in some RXTE data, e.g., Fig. 4 right).
Just the assumption that the upper peak corresponds to Keplerian motion around the neutron star allows to set useful limits on neutron star parameters, a point made by Miller et al. (1996) in their paper on a particular model that interprets the upper peak in this way (see §5.4). Different from the proposals just mentioned, these limits do not rely on identifying any of the observed frequencies with the marginally stable orbital frequency. Kluzniak & Wagoner (1985) and Kluzniak, Michelson & Wagoner (1990) already anticipated that if the orbital frequency of accreting matter near a neutron star could be measured, this could be used to to determine neutron star parameters and test general relativity, although these authors did not present the detailed argument below. There are two direct constraints on the neutron star mass and radius from the simple assertion that there is stable Keplerian motion at the frequency of the upper peak: (1) the radius of the star must be smaller than the radius of this Keplerian orbit, in Schwarzschild coordinates , and (2) the radius of the marginally stable orbit must also be smaller than this: or , as no stable orbit is possible within this radius. Condition (1) is a mass-dependent upper limit on the radius of the star, and condition (2) provides an upper limit on the mass. Fig. 14 shows these limits in the neutron star mass-radius diagram for Hz, plus an indication of how the excluded area (shaded) would shrink for higher values of the upper peak frequency (the currently highest value is 1228 Hz; Table 1). If the softest EOS are incorrect, it seems likely that this method will eventually demonstrate this. Putting in the corrections for the frame dragging due to the neutron star spin (which were neglected in Fig. 14) requires knowledge of the spin rate (presumably the twin peak separation, or half that). The correction also depends somewhat on the neutron star model, which determines the relation between spin rate and angular momentum, so that the limits as plotted in Fig. 14 become slightly different for each EOS. These corrections change the limits on mass and radius only slightly. For a Keplerian frequency of 1193 Hz (Wijands et al. 1997a) the above equations imply M⊙ and km. With frame dragging corrections for an assumed spin rate of 275 Hz these limits change into M⊙ and km for a wide range of equations of state (Wijnands et al. 1997a).
5 Models
This section is intended not so much to provide an exhaustive comparative discussion of the models that have so far been proposed for kHz QPO, as to alert the reader to the various basic physical pictures that have been discussed.
Of course, the phenomenology as described in the previous section very strongly suggests that a beat-frequency model of some kind is at work. Neutron star spin and disk Keplerian motion are periodic phenomena known to be present in the system and are therefore natural candidates for providing the basic frequencies. However, it is too early to declare any proposed implementation of a beat-frequency model for kHz QPO an unqualified success. Let us first look at other models that have been put forward.
5.1 Neutron star vibrations
Remarkably short shrift has been given so far to neutron star vibration models. The short time scale variations in kHz QPO frequency and the lack of higher-frequency peaks have been cited as reasons for rejecting these models. Of course, a fundamental problem for vibration models (also for lower-frequency QPO) has always been to explain how the vibrations would be able to produce appreciable modulations of the X-ray flux, in the case of kHz QPO with amplitudes up to 15% (full band) to 40% (10 keV). Also, it is unclear what physics would be required to pick out just 2 (or 3) frequencies from the range of modes one would expect in most of these models.
5.2 Photon bubble model
A model based on numerical radiation hydrodynamics has been proposed by Klein et al. (1996) for the case of the kHz QPO in Sco X-1. In this model accretion takes place by way of a magnetic accretion funnel. In the funnel, the mass accretion rate is locally super-Eddington, and photon bubbles form, which rise up by buoyancy through the accreting matter.
Klein et al. find that the “bursting of the bubbles” at the top of the flow can produce kHz QPO signals that resemble the observed ones in several respects (Fig. 15). Their initial calculations, for a total X-ray luminosity of 0.17 predicted that there should be QPO peaks at higher frequencies. High time-resolution observations of Sco X-1 performed in order to check on this showed no evidence of higher-frequency peaks down to quite good limits (Van der Klis et al. 1997b; this provides a strong constraint on various other models as well). In the most recent calculations (for =5 109 Gauss and 0.240.4; Klein 1997, private communication) one or two strong QPO peaks are found, whose frequencies increase with accretion rate, and the higher-frequency peaks are of low amplitude. The model also predicts the presence of a power law at frequencies 2 kHz with an index of 5/3. These models are not likely to be able to naturally produce beat frequencies such as observed in atoll sources. Perhaps they apply to the Z sources. This would require the atoll and Z source kHz QPO to have different physical origins.
5.3 Jets
The relation between the QPO frequencies observed in Sco X-1 can be nicely explained with a model where each of the two QPO signals comes from one of two diametrically opposed relativistic jets emanating from the central source. In this picture a central shrouded X-ray pulsar provides the basic high-frequency signal. The observer sees the pulsar signal reflected off inhomogeneities in the two jets. Three frequency shifts affect the observed frequencies: a redshift (identical for each jet) because the inhomogeneities move away from the pulsar at relativistic speed, special-relativistic time dilation, and an additional redshift and blueshift for the receding and approaching jet, respectively. The predicted frequencies for the signals reflected off the two jets will be , where is the jets’ speed, their angle with the line of sight, and the unseen pulse frequency (Van der Klis et al. 1997b). This model fits the Sco X-1 data remarkably well, for =1370 Hz (which could be twice the neutron star spin frequency) and =61∘, if we assume that with increasing , the jet’s speed decreases from =0.48 to 0.26 (Van der Klis et al. 1997b). However, it is hard to see how this model can explain the atoll sources’ kHz QPO properties, as frequency shifts without the peaks’ frequency separation being affected, as are observed in those sources, can not be accommodated by the model.
5.4 Beat-frequency models
Finally, let’s turn to beat-frequency models. Although numerous disk and star frequencies could be hypothesized to beat together, the two beat-frequency models that have been discussed both identify the upper peak’s frequency with the Keplerian frequency of the accretion disk at some preferred radius, and the lower peak with the beat between this Keplerian frequency and the neutron star spin frequency. When disk and star spin in the same direction, this naturally leads, to first order, to the generation of only one beat frequency. The magnetospheric beat-frequency model, which has been used previously to explain certain cataclysmic variable oscillations (Patterson 1979) and the so-called horizontal-branch oscillations (HBO) in Z sources (Alpar & Shaham 1985; Lamb et al. 1985), uses the magnetospheric radius as the preferred radius of which we observe the Kepler frequency. As HBO and kHz QPO have been seen simultaneously in all four Z sources where kHz QPO have so far been observed, at least one additional model is required.
According to Miller, Lamb & Psaltis (1996), applying the magnetospheric beat-frequency model to the kHz QPO leads to several difficulties. They propose the sonic-point model instead. This model uses the sonic radius as the preferred radius of which we observe the Kepler frequency. The sonic radius is defined as the radius where the radial inflow velocity becomes supersonic. In the absence of other stresses, the sonic radius is located near the general-relativistic marginally stable orbit (at in a Schwarzschild geometry and closer in in a Kerr geometry). Radiative stresses may change the location of the sonic radius, as indeed is required by the observation that the kHz QPO frequencies vary with . As we have seen (§4.7), interpretations along these lines have direct consequences for the EOS of high-density matter and provide possibilities to test general relativity in the strong-field regime.

In the sonic-point model, the mechanism that produces the upper peak is as follows. At the sonic radius clumps form in the accretion flow that live for tens to hundreds of QPO cycles (i.e., several 0.01 to several 0.1 s). During a clump’s lifetime, its matter gradually accretes onto the neutron star surface. This accreting matter follows a fixed spiral-shaped trajectory in the frame corotating with the Keplerian motion, and therefore hits the neutron star surface at a specific spot, the “footpoint”of that clump’s spiral flow (Fig. 16). Enhanced accretion at the footpoint produces enhanced emission there, and because the footpoint travels around the neutron star surface at the Keplerian angular velocity of the sonic radius, irrespective of what the neutron star’s spin is, the observer sees the hot spot change aspect and perhaps appear and disappear with the sonic radius’ Keplerian frequency. The narrowness of the QPO peaks implies that all the clumps are near one precise radius, allows for relatively little fluctuations in the spiral flow, and requires the above-mentioned long clump lifetimes.
In Z sources, applying this model for the kHz QPO, and the magnetospheric beat-frequency model for the HBO leads to the conclusion that the sonic radius is well within the magnetosphere (Van der Klis et al. 1997b), so that only part of the matter can be “picked up” by the magnetic field lines at , and the remainder must maintain its Keplerian flow to much closer in. The modulation of the radiation caused by this mechanism is not a modulation of the total luminosity, but a modulation of the direction into which this luminosity is emitted (“beaming”). If some of these neutron stars have a magnetic field strong enough to channel some of the accreting matter to the magnetic poles (as required by the magnetospheric beat-frequency model for Z sources), then another beaming modulation is expected at the neutron star spin frequency. However, so far this modulation has not been detected in any Z source, which presents the difficulty that one has to somehow get rid of the spin frequency but not of the sonic-radius Keplerian frequency. As both are beaming modulations and the frequencies are similar, this may require some finetuning of the scattering process that is smearing the pulsations.
Miller et al. (1996) predict that as the sonic radius approaches the general-relativistic marginally stable orbit the frequency of the upper peak will hit a “ceiling” and remain stable for further increases in accretion rate. There are so far no data that have shown this. Instead it has been observed that the QPO gradually weaken as increases, and finally disappear below the detection limit above some level of inferred accretion rate. This level, however, is very different between sources (much higher in sources with a higher average luminosity), but at frequencies that are mostly in the range 1100–1200 Hz. Perhaps this is what really happens when is reached.
Now let’s turn to the question how the lower peak is produced in the sonic-point model. The footpoint running over the neutron star surface will of course encounter the same point on the surface once every beat period between the neutron star spin and the sonic-point Keplerian frequencies. If there are gradients over the surface this could affect the emission properties of the footpoints at the beat frequency. However, this is not the model proposed by Miller et al. They propose instead that the physical interaction that eventually leads to the modulation of the X-ray flux at the beat frequency takes place at the sonic radius. In their model, X-rays produced by the accretion of matter channeled onto the magnetic poles are emitted into two broad “lighthouse beams”, sweeping around at the neutron star spin frequency. These beams irradiate the clumps at the sonic radius when they sweep over them, which happens once per beat period. This leads to a modulation, at the beat frequency, in the rate at which the clumps provide matter to their spiral flows. Consequently, the accretion of matter onto the footpoints, and therefore their emission, is modulated at the beat frequency, and this leads to the lower peak we see in the power spectra. This model predicts various aliases and harmonic of the observed peaks should also be present, but these have not been observed so far. The model requires the pulsar beams to extend out to the sonic radius with sufficient strength to affect the accretion flow there, yet to be smeared, presumably by scattering further out, to below the detection levels that have so far been reached (e.g., Vaughan et al. 1997). On the other hand the footpoints’ emission beams must be able to propagate to infinity in order for us to see the sometimes quite strong upper peaks. As double peaks are seen in sources between several 10-3 and 1 , all these processes must operate in a way to keep the phenomenology the same over a large range in (but this, of course, is a problem in any interpretation that attempts to explain these phenomena by one mechanism across the board). The cases of 4U 163653 and KS 1731260, where the pulsar frequency appears to be twice the twin-peak separation frequency, in the Miller et al. model requires a further explanation of the question why pulsar frequency observed during X-ray bursts is twice the interaction frequency with the sonic-radius clumps. If, for example, we see nuclear fuel accumulated at two magnetic poles burning in the bursts, why doesn’t emission caused by the accretion of this fuel onto both these poles interact with the clumps, but only that from one pole?
Obviously, a large amount of effort is still required to make any of the models so far proposed stick. Fortunately, as it looks now the theoretical efforts that are underway at this point will be guided by a very constraining body of RXTE data. Eventually, most LMXBs will likely exhibit the new phenomenon, and many of its properties can be measured with RXTE with great precision.
Acknowledgements.
This work was supported in part by the Netherlands Organization for Scientific Research (NWO) under grant PGS 78-277 and by the Netherlands Foundation for Research in Astronomy (ASTRON) under grant 781-76-017.References
- [] Alpar, M.A. & Shaham, J. 1985, Nat 316, 239
- [] Berger, M. et al. 1996, ApJ 469, L13
- [] Ford, E. et al. 1996, IAU Circ. 6426
- [] Ford, E. et al. 1997a, ApJ 475, L123
- [] Ford, E. et al. 1997b, ApJ 486, L47
- [] Cook, G.B., Shapiro, S.L. & Teukolsky, S.A., 1994 ApJ 424, 823
- [] Hasinger, G. & Van der Klis, M. 1989, A&A 225, 79
- [] Jongert, H.C. & Van der Klis, M., 1996, A&A 310, 474
- [] Kaaret, Ph., Ford, E. & Chen, K., 1997, ApJ 480, L27 astro-ph/9701101
- [] Klein, R.L. et al. 1996, ApJ 469, L119
- [] Kluźniak, W. & Wagoner, R.V., 1985, ApJ 297, 548
- [] Kluźniak, W., Michelson, P. & Wagoner, R.V., 1990, ApJ 358, 538
- [] Lamb, F.K., Shibazaki, N., Alpar, M.A. & Shaham, J. 1985, Nat 317, 681
- [] McClintock, J.E. 1986, in The Physics of Accretion onto Compact Stars, K.O. Mason, M.G. Watson & N.E. White (Eds), Lecture Notes in Physics (Springer Verlag), Vol. 266, 211
- [] Méndez, M. et al. ApJ 485, L37
- [] Méndez, M., et al. 1997b, ApJ (in preparation)
- [] Miller, M.C. & Lamb, F.K. 1993, ApJ 413, L43
- [] Miller, M.C., Lamb, F.K. & Psaltis, D. 1996, ApJ (submitted) astro-ph/9609157
- [] Morgan, E.H. & Smith, D.A. 1996, IAU Circ. 6437
- [] Patterson, J. 1979, ApJ 234, 978
- [] Psaltis, D. & Lamb, F.K. 1997, ApJ (submitted)
- [] Schwartz, D. 1996, Minutes XTE Users Group Meeting, Goddard Space Flight Center, April 2-3 1996. http://heasarc.gsfc.nasa.gov/docs/xte/xug.html
- [] Smale, A.P., Zhang, W. & White, N.E. 1996, IAU Circ. 6507
- [] Smale, A.P., Zhang, W. & White, N.E. 1997, ApJ 483, L119
- [] Smith, D.A., Morgan, E.H. & Bradt, H. 1997, ApJ 479, L137
- [] Stella, L. & Vietri, M. 1997, (in preparation) astro-ph/9709085
- [] Strohmayer, T., Zhang, W. & Swank, J. 1996a, IAU Circ. 6320
- [] Strohmayer, T. et al. 1996b, IAU Circ. 6387
- [] Strohmayer, T. et al. 1996c, ApJ 469, L9
- [] Strohmayer, T., Lee, U. & Jahoda, K. 1996d, IAU Circ. 6484
- [] Strohmayer, T., Giles, A.B., Jahoda, K. & Lee, U. 1997, ApJ 486, 355
- [] Van der Klis, M. 1989a, in Timing Neutron Stars, H. Ögelman & E.P.J. van den Heuvel (Eds), Kluwer, NATO ASI C262, p. 27
- [] Van der Klis, M. 1989b, ARA&A 27, 517
- [] Van der Klis, M. 1995, in X-Ray Binaries, W.H.G. Lewin, J. van Paradijs & E.P.J. van den Heuvel (Eds), Cambridge University Press, p. 252
- [] Van der Klis, M. 1997, Proceedings of the Wise Observatory 25th Anniversary Symposium, Tel Aviv, Israel, 30 December 1996, astro-ph 9704272
- [] Van der Klis, M. et al. 1985, Nat 316, 225
- [] Van der Klis, M. et al. 1996a, IAU Circ. 6319
- [] Van der Klis, M. et al. 1996b, IAU Circ. 6424
- [] Van der Klis, M. et al. 1996c, ApJ 469, L1
- [] Van der Klis, M. et al. 1996d, IAU Circ. 6428
- [] Van der Klis, M. et al. 1996e, IAU Circ. 6511
- [] Van der Klis, M. et al. 1997a, IAU Circ. 6565
- [] Van der Klis, M., Wijnands, R., Chen, W. & Horne, K., 1997b, ApJ 481, L97
- [] Van Paradijs, J. et al. 1996, IAU Circ. 6336
- [] Vaughan, B.A. et al. 1997, ApJ 483, L115
- [] Wijnands, R.A.D. et al. 1996, IAU Circ. 6447
- [] Wijnands, R.A.D. et al. 1997a, ApJ 479, L141
- [] Wijnands, R.A.D. et al. 1997b, ApJ (in preparation)
- [] Wijnands, R.A.D. et al. 1997c, ApJ (in press)
- [] Wijnands, R.A.D. et al. 1997d, ApJ (in preparation)
- [] Wijnands, R.A.D. & Van der Klis, M., 1997, ApJ 482, L65
- [] Yu, W. et al. 1997, ApJ (in preparation)
- [] Zhang, W. 1997, Paper presented at the 190th AAS Meeting, Winston-Salem, USA
- [] Zhang, W., Lapidus, I., White, N.E. & Titarchuk, L. 1996, ApJ 469, L17
- [] Zhang, W. et al. 1997, IAU Circ. 6541
- [] Zhang, W., Strohmayer, T.E. & Swank, J.H., 1997, ApJ 482, L167