MGC 2214+3550: A New Binary Quasar 111Observations reported here were made with the Multiple Mirror Telescope Observatory, which is operated jointly by the University of Arizona and the Smithsonian Institution.
Abstract
We report the discovery of a binary quasar, MGC 2214+3550 A,B, whose components have similar optical spectra at a redshift . The quasars are separated on the sky by , and have a magnitude difference of mag. The VLA radio map at 3.6 cm shows a single 47 mJy radio source with a core-jet morphology that is coincident with the brighter optical quasar A. Gravitational lensing is ruled out by the lack of radio emission from quasar B, and the lack of any visible galaxies to act as the lens. We conclude that MGC 2214+3550 A and B are physically associated. With a projected separation of kpc (), MGC 2214+3550 A,B is one of the smallest binary quasars.
keywords:
Quasars: individual (MGC 2214+3550) — radio galaxies — gravitational lensing — binary quasars1 Introduction
The first candidate gravitational lens to be discovered, Q 0957+561 (Walsh et al. 1979), had an image separation (.′′) typical of a small cluster of galaxies. The cluster was rapidly discovered in optical images (Young et al. 1981) and Q 0957+561 is universally believed to be a gravitational lens. The third candidate gravitational lens to be discovered, Q 2345+007 (Weedman et al. 1982), also had an image separation (.′′) typical of a small cluster of galaxies. No such cluster is seen in optical images, leaving Q 2345+007 as the prototypical “dark lens” candidate. There are now 9 high-redshift quasar pairs similar to Q 2345+007. They have separations from to , identical redshifts (), similar spectra, and no detectable, normal object to serve as the lens. For the smaller separation lenses and the two wide separation radio lenses (see Keeton & Kochanek 1996)222A current summary of the lens data is available at http://cfa-www.harvard.edu/glensdata, a normal galaxy (or cluster) located in the correct position to serve as the lens is always seen in HST images of the system, unless the quasar to galaxy contrast is too severe to detect a normal galaxy (see Keeton, Kochanek & Falco 1997 for a summary of the optical properties), so explanations of the problematic pairs must invoke a class of group to cluster mass objects that have too few stars or too little hot X-ray emitting gas to be detected locally. However, the objects would be times more abundant than known massive objects, and would contradict most of the generally accepted models of structure formation (see Kochanek 1995; Wambsganss et al. 1995). Despite periodic theoretical attempts (e.g., Jimenez et al. 1997) and new observations (e.g.; Michalitsianos et al. 1997; Patnaik et al. 1996; Pello et al. 1996; Small, Sargent & Steidel 1997), little progress has been made in confirming or rejecting the wide-separation optical quasar pairs as gravitational lenses.
Most of the known lenses were not, in fact, found in surveys of optical quasars but in imaging surveys of radio sources (e.g.; Burke, Lehár & Conner 1992; Browne et al. 1997; King & Browne 1996). As we discuss in Kochanek, Falco & Muñoz (1997) a comparison of the optical and radio data yields a simple proof that most of the quasar pairs cannot be gravitational lenses. The 9 problematic doubles are all pairs, in which both quasars are radio-quiet. The other detectable permutations are pairs in which both quasars are radio-loud, and pairs in which one quasar is radio-loud and the other is radio-quiet. The most important, disregarded facts about the wide-separation quasar pairs is the lack of a population of radio-loud pairs and the existence of one pair.
The key observational discovery bearing on the “gravitational lens versus binary quasar” argument was the discovery by Djorgovski et al. (1987) of the first pair, PKS 1145–071. The system has an angular separation of , a small magnitude difference of , and indistinguishable redshifts of . The lower limit on the radio flux ratio is 500:1, providing conclusive evidence that the system is not a gravitational lens. The spectral similarities of the two components are not particularly better or worse than the wide separation quasar pairs or many of the true gravitational lenses for that matter. Most quasars are radio-quiet, with only (15%) showing 5 GHz radio fluxes exceeding 50 (10) mJy (Hooper et al. 1997). Thus, for every pair we discovered, we would expect to find pairs similar to the claimed dark lenses. The very existence of PKS 1145–071 combined with the small fraction of radio-loud quasars essentially rules out the gravitational lens hypothesis for most of the quasar pairs. The only significant weakness in the chain of inference is the uniqueness of the system.
We report here on the discovery of a second binary quasar, MGC 2214+3550, with , mag and . We identified the object as a quasar in the course of our ongoing redshift survey of 177 flat-spectrum radio sources covering the 6 cm flux range 50–250 mJy (Falco, Kochanek & Muñoz 1997). The goal of our survey is to determine the radio luminosity function for faint radio sources, to set limits on cosmological models using the statistics of radio-selected gravitational lenses. A subsample of 108 flat-spectrum sources in the flux range 50–200 mJy was selected from the MIT-Green Bank (MG) II and III Surveys (Langston et al. 1990; Griffith et al. 1990). For each source in our sample, we obtained band CCD images for optical identification and photometry. Finally, we procured low-resolution spectra of the candidate radio source counterparts with the MMT. Since the radio positions are accurate to better than ″, with the errors dominated by the small systematic offsets between the radio VLA and optical GSC coordinate reference frames, there was rarely any ambiguity in the identification of the optical counterparts. However, we oriented the spectrograph slit to obtain a spectrum of the next nearest optical source as a matter of routine. MGC 2214+3550 turned out to have a visible neighbor within 3″; when we obtained the spectra of both objects, we discovered that both were quasars with indistinguishable redshifts. In §2 we describe the optical and radio data, and in §3 we discuss whether MGC 2214+3550 A,B is a binary quasar or a gravitational lens and its consequences.
2 Observations
MGC 2214+3550 was initially selected for our redshift survey from the single-dish 6 cm MG III catalog of Griffith et al. (1990). An accurate interferometric radio position was obtained from the MIT Archive of VLA snapshots of the MG survey radio sources (MG-VLA: Lawrence et al. 1986; Hewitt 1986; Lehár 1991; Herold-Jacobson 1996). MGC 2214+3550 was observed for 2 min using the A configuration at 3.6 cm. The interferometer data were calibrated and mapped using standard AIPS333AIPS (Astronomical Image Processing System) is distributed by the National Radio Astronomy Observatory, which is a facility of the National Science Foundation operated under cooperative agreement by Associated Universities, Inc. procedures, and the flux densities were scaled to 3C 286 (Baars et al. 1977). Three iterations of mapping and self-calibration were performed to improve the map quality. The off-source map rms was mJy beam-1, only higher than the expected thermal noise, and the FWHM beam size was approximately . The source has a typical core-jet morphology (see Figure 1), with a compact core and an associated jet extending eastwards by . The peak surface brightness of the core and the jet are mJy beam-1 and mJy beam-1, respectively, and the total VLA interferometer flux density of the source is mJy. The VLA radio coordinates for the peak of the compact core are =22:14:56.98, =35:51:25.8 (J2000.0), with an estimated astrometric uncertainty of (Lawrence et al. 1986).
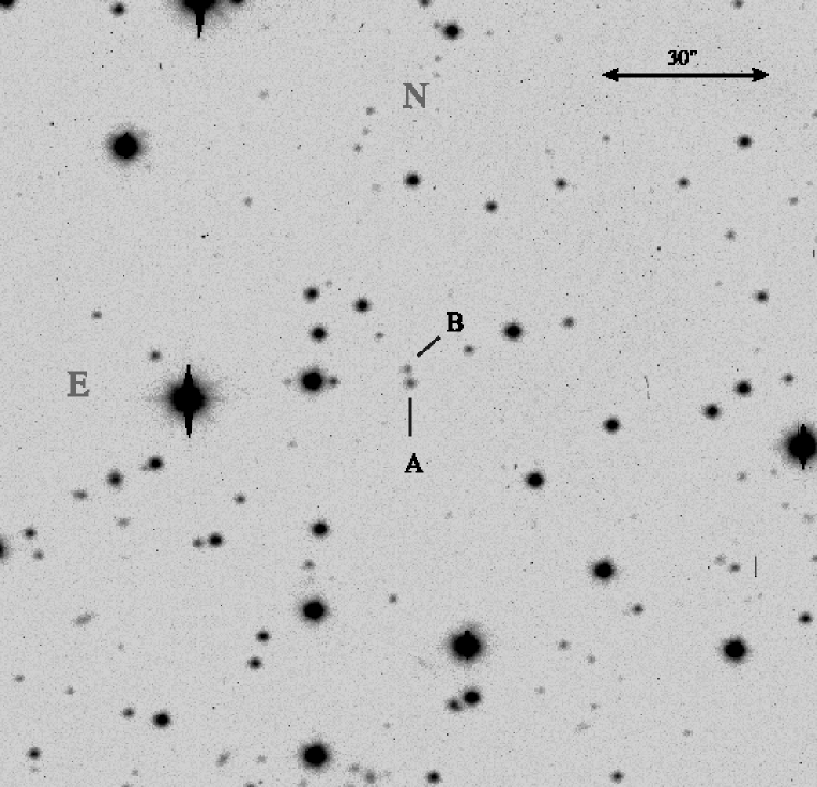
After selecting MGC 2214+3550 for our redshift survey, we obtained an band image of its optical counterpart with the Fred Lawrence Whipple Observatory (FLWO) 1.2m telescope; the detector was a Loral 20482 CCD, with a Kron-Cousins filter. The pixel scale of the CCD was , the nominal gain 2.30 electrons/ADU, and the nominal read-out noise 7.0 electrons per pixel. We bias-subtracted and flattened the image using standard procedures in IRAF444IRAF (Image Reduction and Analysis Facility) is distributed by the National Optical Astronomy Observatories, which are operated by the Association of Universities for Research in Astronomy, Inc., under contract with the National Science Foundation.. We used the HST Guide Star Catalog (GSC) to perform the astrometric identifications. The instrumental magnitudes were calibrated using a GSC star in our field, with an assumed mean color for GSC stars. As a result, our photometry is likely to have absolute uncertainties of mag. The optical image revealed 2 compact objects, the brighter of which we named A, and the other B. The pair has a separation of in the direction with PA=13∘ east of north from A (see Figures 1 and 2). We used the IRAF task “daophot” to build an empirical model of the 12 FWHM point spread function (PSF), and we found that A and B were unresolved. After subtracting the PSF, we could not see any significant residual. Table 1 lists the magnitudes and positions that we obtained for A and B.
We obtained spectra of A and B with the MMT and the Blue Channel spectrograph, with a slit of width 1″ and a 300 line mm-1 grating. The usable wavelength range is 3400–8100 Å, with a dispersion of 1.96 Å pixel-1, and an effective resolution of 6.2 Å (FWHM). We took 4 exposures on 3 separate nights (the journal of observations is in Table 2). In exposures 1 and 4 we placed the slit on both components, while in exposures 2 and 3 it was placed on each component in turn, with the slit perpendicular to the line A–B, giving us a total of three spectra for each component. Because detailed spectra were not relevant to the goals of our redshift survey, and because of our relatively poor observing conditions, we did not obtain high quality spectra. Nonetheless, all 6 spectra of the two objects show the same two emission lines, corresponding to CIII 1909 Å and MgII 2798 Å at the same redshift of . To improve the signal-to noise ratio (SNR), we combined the 3 spectra for each of the two QSO components, and we calibrated the fluxes using the spectrophotometric standard BD+40.4032, whose spectrum was acquired under photometric conditions. Unfortunately, we could not acquire standard spectra for all the nights; thus, our flux calibration is only approximate. The redshifts for the 2 components, based on the CIII 1909 Å and MgII 2798 Å emission lines, are and . In Table 3 we show the analysis of the redshifts obtained using each emission line. If the spectrum of component A is used as a template in a cross-correlation with the spectrum of B, a relative velocity of is obtained. The combined MMT spectra for the A and B components are shown in Figure 3. It is easy to notice the similarity in the shapes of these spectra, and especially in the detailed profiles of the CIII and MgII emission lines. However, there is a difference between the continua of A and B, with the B continuum increasing slightly more rapidly than that of A, toward the blue. The measured equivalent widths are, for CIII: Å ( Å) in A (B); and for MgII: Å ( Å) in A (B). The equivalent widths of lines in one component appear to differ from those in the other, but the low SNRs in the continua of our spectra imply that this dissimilarity is marginal. We also combined all 6 spectra; the emission lines then stand out more strongly above the continuum, but we could not identify any foreground absorption features.
We compared the optical and radio data by determining the relative astrometry of the optical and radio sources, and by determining an upper limit on the existence of other radio sources in the nearby field. We determined the position for optical component A with the program IMWCS555Originally written at the University of Iowa, and adapted and amplified by D. Mink at the Smithsonian Astrophysical Observatory. to set the world coordinate system in our CCD image. We matched 25 stars in the image with the reference catalog USNO-A (Monet 1996). The final absolute coordinates (see Table 1) have a standard error of . The coordinate difference between the optical A component and the radio source is , . As an additional test, we determined the coordinates of the A component using 10 GSC stars falling within our CCD frame and the results were compatible with those given above. Thus, it appears that the optical counterpart to the radio source is the A component. There is no significant radio emission at the location of component B, with an upper limit of mJy beam-1, from the rms noise in the map. By comparing this to the peak surface brightness of the radio core, we obtain a lower limit of on the A/B radio flux ratio.
Finally, we analyzed the morphologies of the other objects detected within a 70″ radius region around each of the A and B optical quasars, and found that they are all point sources; therefore, we could not find any nearby galaxy or cluster of galaxies that was brighter than mag.
3 Discussion
It is attractive, but difficult, to explain the MGC 2214+3550 A,B system as two gravitationally lensed images of a single quasar. The spectra for the two components are similar, with a redshift difference that is consistent with zero. The angular separation is only , easily produced by a galaxy or galaxy-group-sized lens, and the 0.5 mag image brightness ratio is also typical of gravitational lensing. The differences in the equivalent widths of CIII 1909 Å and MgII 2798 Å, and the differences between the continua of A and B, are weak evidence against lensing and are comparable to the differences in the optical properties of many of the pairs claimed as gravitational lenses. However, if the radio source is quasar A (or B, for that matter), then the difference between the radio flux ratio () and the optical flux ratio () cannot be readily explained by a lens model.
There are three possible explanations for the dissimilar radio and optical ratios, within the context of a gravitational lens scenario, but none is likely. First, extinction of A by mag is ruled out by the minimal differences in the spectral continuum slopes of the two components. Second, a microlensing fluctuation making B brighter by at least 3.5 mag is unlikely. Even for true point sources we expect an rms magnitude fluctuation of only 1 mag (Witt, Mao & Schechter 1995), and the empirical evidence shows that the observed microlensing fluctuations are considerably smaller (see Corrigan et al. 1991; Houde & Racine 1994), implying that the quasar source sizes are insufficiently point-like for the images to exhibit the maximum fluctuation. With such a large microlensing effect we would also expect larger differences in the equivalent widths of the emission lines (e.g., Schneider & Wambsganss 1990). Third, strong differential variations in the optical and radio fluxes, combined with a suitable time delay between the two quasar images, may be able to produce the observed ratios. Our existing data cannot eliminate this hypothesis, since we lack optical and radio time series, but it is unlikely.
The flux ratio differences are not a problem if our astrometric identification is incorrect. In this case, it may be possible that the radio source is actually associated with the lens galaxy, so that it lies between the A and B images of a background radio-quiet quasar. Such a registration is improbable because there are only about AGN over the entire sky with 6 cm total flux density above 30 mJy (Gregory et al. 1996; Griffith & Wright 1993). With galaxies in the observable universe, the probability of any lens galaxy being sufficiently radio-bright is 1 in .
The last serious problem with the lensing interpretation is that no lensing material can be seen optically. The mass to produce the image separation requires at least an galaxy or a group of galaxies. An galaxy member of a lensing group should be easily detected in our images, since even at the higher than optimal lens redshift of an galaxy would have . An anomalously faint lens is very unlikely, given the presence of lenses with the expected optical fluxes in all other convincing lens systems (see Keeton, Kochanek, & Falco 1997), and given that MGC 2214+3550 would have the lowest source redshift of any known lensed system.
We conclude that the MGC 2214+3550 A,B system is a binary quasar with a projected separation of kpc (for ), making it one of the smallest projected separation quasar binaries. The velocity differences, if interpreted as due to the Hubble flow, correspond to a line-of-sight separation of Mpc (). However, the uncertainties in the velocity difference are so large that a far better estimate can be obtained from the density associated with the correlation function. If the quasar-quasar density is , 90% of the objects have line-of-sight separations smaller than approximately 10 times the projected separation, or about kpc. The existence of MGC 2214+3350 A,B proves that PKS 1145–071 was not a statistical fluke, and that we really are seeing the number of objects expected if most or all the large separation quasar pairs are binary quasars rather than gravitational lenses. Adding the absence of wide separation radio pairs, we believe that the combination of the optical and radio data conclusively proves that a fraction of bright, high redshift quasars are members of binary quasar systems. In Kochanek et al. (1997) we quantify the case against the lens interpretation in greater detail, and provide a simple physical argument for the excess of binary quasars over that predicted from the quasar-quasar correlation function (see Djorgovski 1991) based on the physics of galaxy mergers.
Acknowledgements.
We are grateful to A. Milone for her help and perseverance during our MMT observations. We also thank A. Vikhlinin for a FLWO 1.2m image, L. Macri for an MMT spectrum, and C. Keeton for theoretical magnitude estimates. Our research was supported by the Smithsonian Institution. JAM is supported by a postdoctoral fellowship from the Ministerio de Educación y Cultura, Spain. CSK is supported by NSF grant AST-9401722 and NASA ATP grant NAG5-4062. JL acknowledges support of NSF grant AST93-03527.References
- (1)
- (2) Baars, J. W. M., Genzel, R., Pauliny-Toth, I. I. K. & Witzel, A. 1977, A&A, 61, 99
- (3)
- (4) Browne, I. W. A., et al. 1997, in “Observational cosmology with the new radio surveys”, ed. M. Bremer, N. Jackson & I. Perez-Fournon (Dordrecht: Kluwer)
- (5)
- (6) Burke, B. F., Lehár, J., & Conner, S. R. 1992, in Gravitational Lenses, ed. R. Kayser, T. Schramm, & L. Nieser (Springer: Berlin), 237
- (7)
- (8) Corrigan, R. T., Arnaud, J., Fahlman, G. G., Fletcher, J. M., Hewett, P. C., Hewitt, J. N., Le Fevre, O., McClure, R., Pritchet, C. J., Schneider, D. P., Turner, E. L., Webster, R. L., Yee, H. K. C., 1991, AJ, 102, 34
- (9)
- (10) Djorgovski, S., 1991 The Space Distribution of Quasars, ASP #21, D. Crampton, ed., (ASP) 349
- (11)
- (12) Djorgovski, S., Perley, R., Meylan, G. & McCarthy, P. 1987, ApJ, 321, L17
- (13)
- (14) Falco, E. E., Kochanek, C. S. & Muñoz, J.A. 1997, ApJ in press, astro-ph/9707032
- (15)
- (16) Gregory, P. C., Scott, W. K., Douglas, K., Condon, J. J., 1996, ApJS, 103, 427
- (17)
- (18) Griffith, M., Langston, G., Heflin, M., Conner, S., Lehár, J. & Burke, B. F. 1990, ApJS, 74, 129
- (19)
- (20) Griffith, M. R., Wright, A. E., 1993, AJ, 105, 1666
- (21)
- (22) Herold-Jacobson, L. K. 1996, Ph.D. Thesis, Massachusetts Institute of Technology
- (23)
- (24) Hewitt, J. N., 1986, Ph. D. Thesis, Massachusetts Institute of Technology
- (25)
- (26) Hooper, E. J., Impey, C. D., Foltz, C. B. & Hewett, P. C. 1996, ApJ, 473, 746
- (27)
- (28) Houde, M., & Racine, R. 1994, AJ, 107, 466
- (29)
- (30) Jimenez, R., Heavens, A. F., Hawkins, M. R. S. & Padoan, P. 1997, electronic preprint astro-ph/9709050
- (31)
- (32) Kochanek, C. S. 1995, ApJ, 435, 545
- (33)
- (34) Kochanek, C. S., Falco. E. E., & Muñoz, J. A. 1997, preprint
- (35)
- (36) Keeton, C. R. & Kochanek, C. S. 1996, in “Astrophysical Applications of Gravitational Lensing”, eds. C. S. Kochanek & J. N. Hewitt, Kluwer Academic Publishers: Dordrecht, Holland, 419
- (37)
- (38) Keeton, C. R., Kochanek, C. S. & Falco, E. E. 1997, ApJ submitted, astro-ph/9708161
- (39)
- (40) King, L. J., & Browne, I. W. A. 1996, MNRAS, 282, 67
- (41)
- (42) Langston, G. I., Heflin, M. B., Conner, S. R., Lehár, J. L., Carilli, C. L. & Burke, B. F. 1990, ApJS, 72, 621
- (43)
- (44) Lawrence, C. R., Bennett, C. L., Hewitt, J. N., Langston, G. I., Klotz, S. E., Burke, B. F., Turner, K. C., 1986, ApJS, 61, 105
- (45)
- (46) Lehár, J. 1991, Ph.D. Thesis, Massachusetts Institute of Technology
- (47)
- (48) Michalitsianos, A., Falco, E., Muñoz, J. A. & Kazanas, D. 1997, ApJ, 487, L117
- (49)
- (50) Monet, D. 1996, BAAS, 188, 5404
- (51)
- (52) Patnaik, A.R., Schneider, P., & Narayan, R. 1996 MNRAS, 281, 17
- (53)
- (54) Pello, R., Miralles, J.M., Le Borgne, J.-F., Picat, J.-P., Soucail, G., & Bruzual, G. 1996, A&A, 314, 73
- (55)
- (56) Schneider, P. & Wambsganss, J. 1990, A&A, 237, 42
- (57)
- (58) Small, T. A., Sargent, W. L. W., Steidel, C. C. 1997, AJ in press, astro-ph/9709203
- (59)
- (60) Walsh, D., Carswll, R. F., & Weymann, R. J. 1979, Nature, 279, 381
- (61)
- (62) Wambsganss, J., Cen, R., Ostriker, J. P., & Turner, E. L. 1995, Science, 268, 274
- (63)
- (64) Weedman, D. W., Weymann, R. J., Green, R. F. & Heckman, T. M. 1982, ApJ, 255, L5
- (65)
- (66) Witt, H. J., Mao, S. & Schechter, P. L. 1995, ApJ, 443, 18
- (67)
- (68) Young, P. J., Gunn, J., Oke, J. B., Westphal, J. A. & Kristian J. 1981, ApJ, 241, 507
| Object | (J2000) | (J2000) | |
|---|---|---|---|
| A | 22:14:56.97 | 35:51:25.5 | |
| B |
| Exp. | Object | Central | Exp. | Date | Air Mass | P.A. | Seeing |
|---|---|---|---|---|---|---|---|
| No | (Å) | (s) | dd/mm/yy | ∘ E of N | (arcsec) | ||
| 1 | MGC 2214+3550 | 6000 | 2700 | 08/09/96 | 1.031 | -176.9 | 0.9 |
| 2 | MGC 2214+3550 A | 6000 | 1769 | 05/07/97 | 1.002 | -90.9 | 1.1 |
| 3 | MGC 2214+3550 B | 6000 | 2700 | 05/07/97 | 1.022 | -83.9 | 1.3 |
| 4 | MGC 2214+3550 | 6000 | 3600 | 09/07/97 | 1.055 | 11.9 | 2.1 |
| Object | CIII 1909 Å | MgII 2798 Å | Redshift | ||
|---|---|---|---|---|---|
| —————————— | —————————— | ||||
| (Å) | z | (Å) | z | ||
| A | 3576 | 0.873 | 5272 | 0.884 | 0.8790.008 |
| B | 3570 | 0.870 | 5264 | 0.882 | 0.8760.008 |